Global stock market indices: How the world markets performed today - 1 April 2025
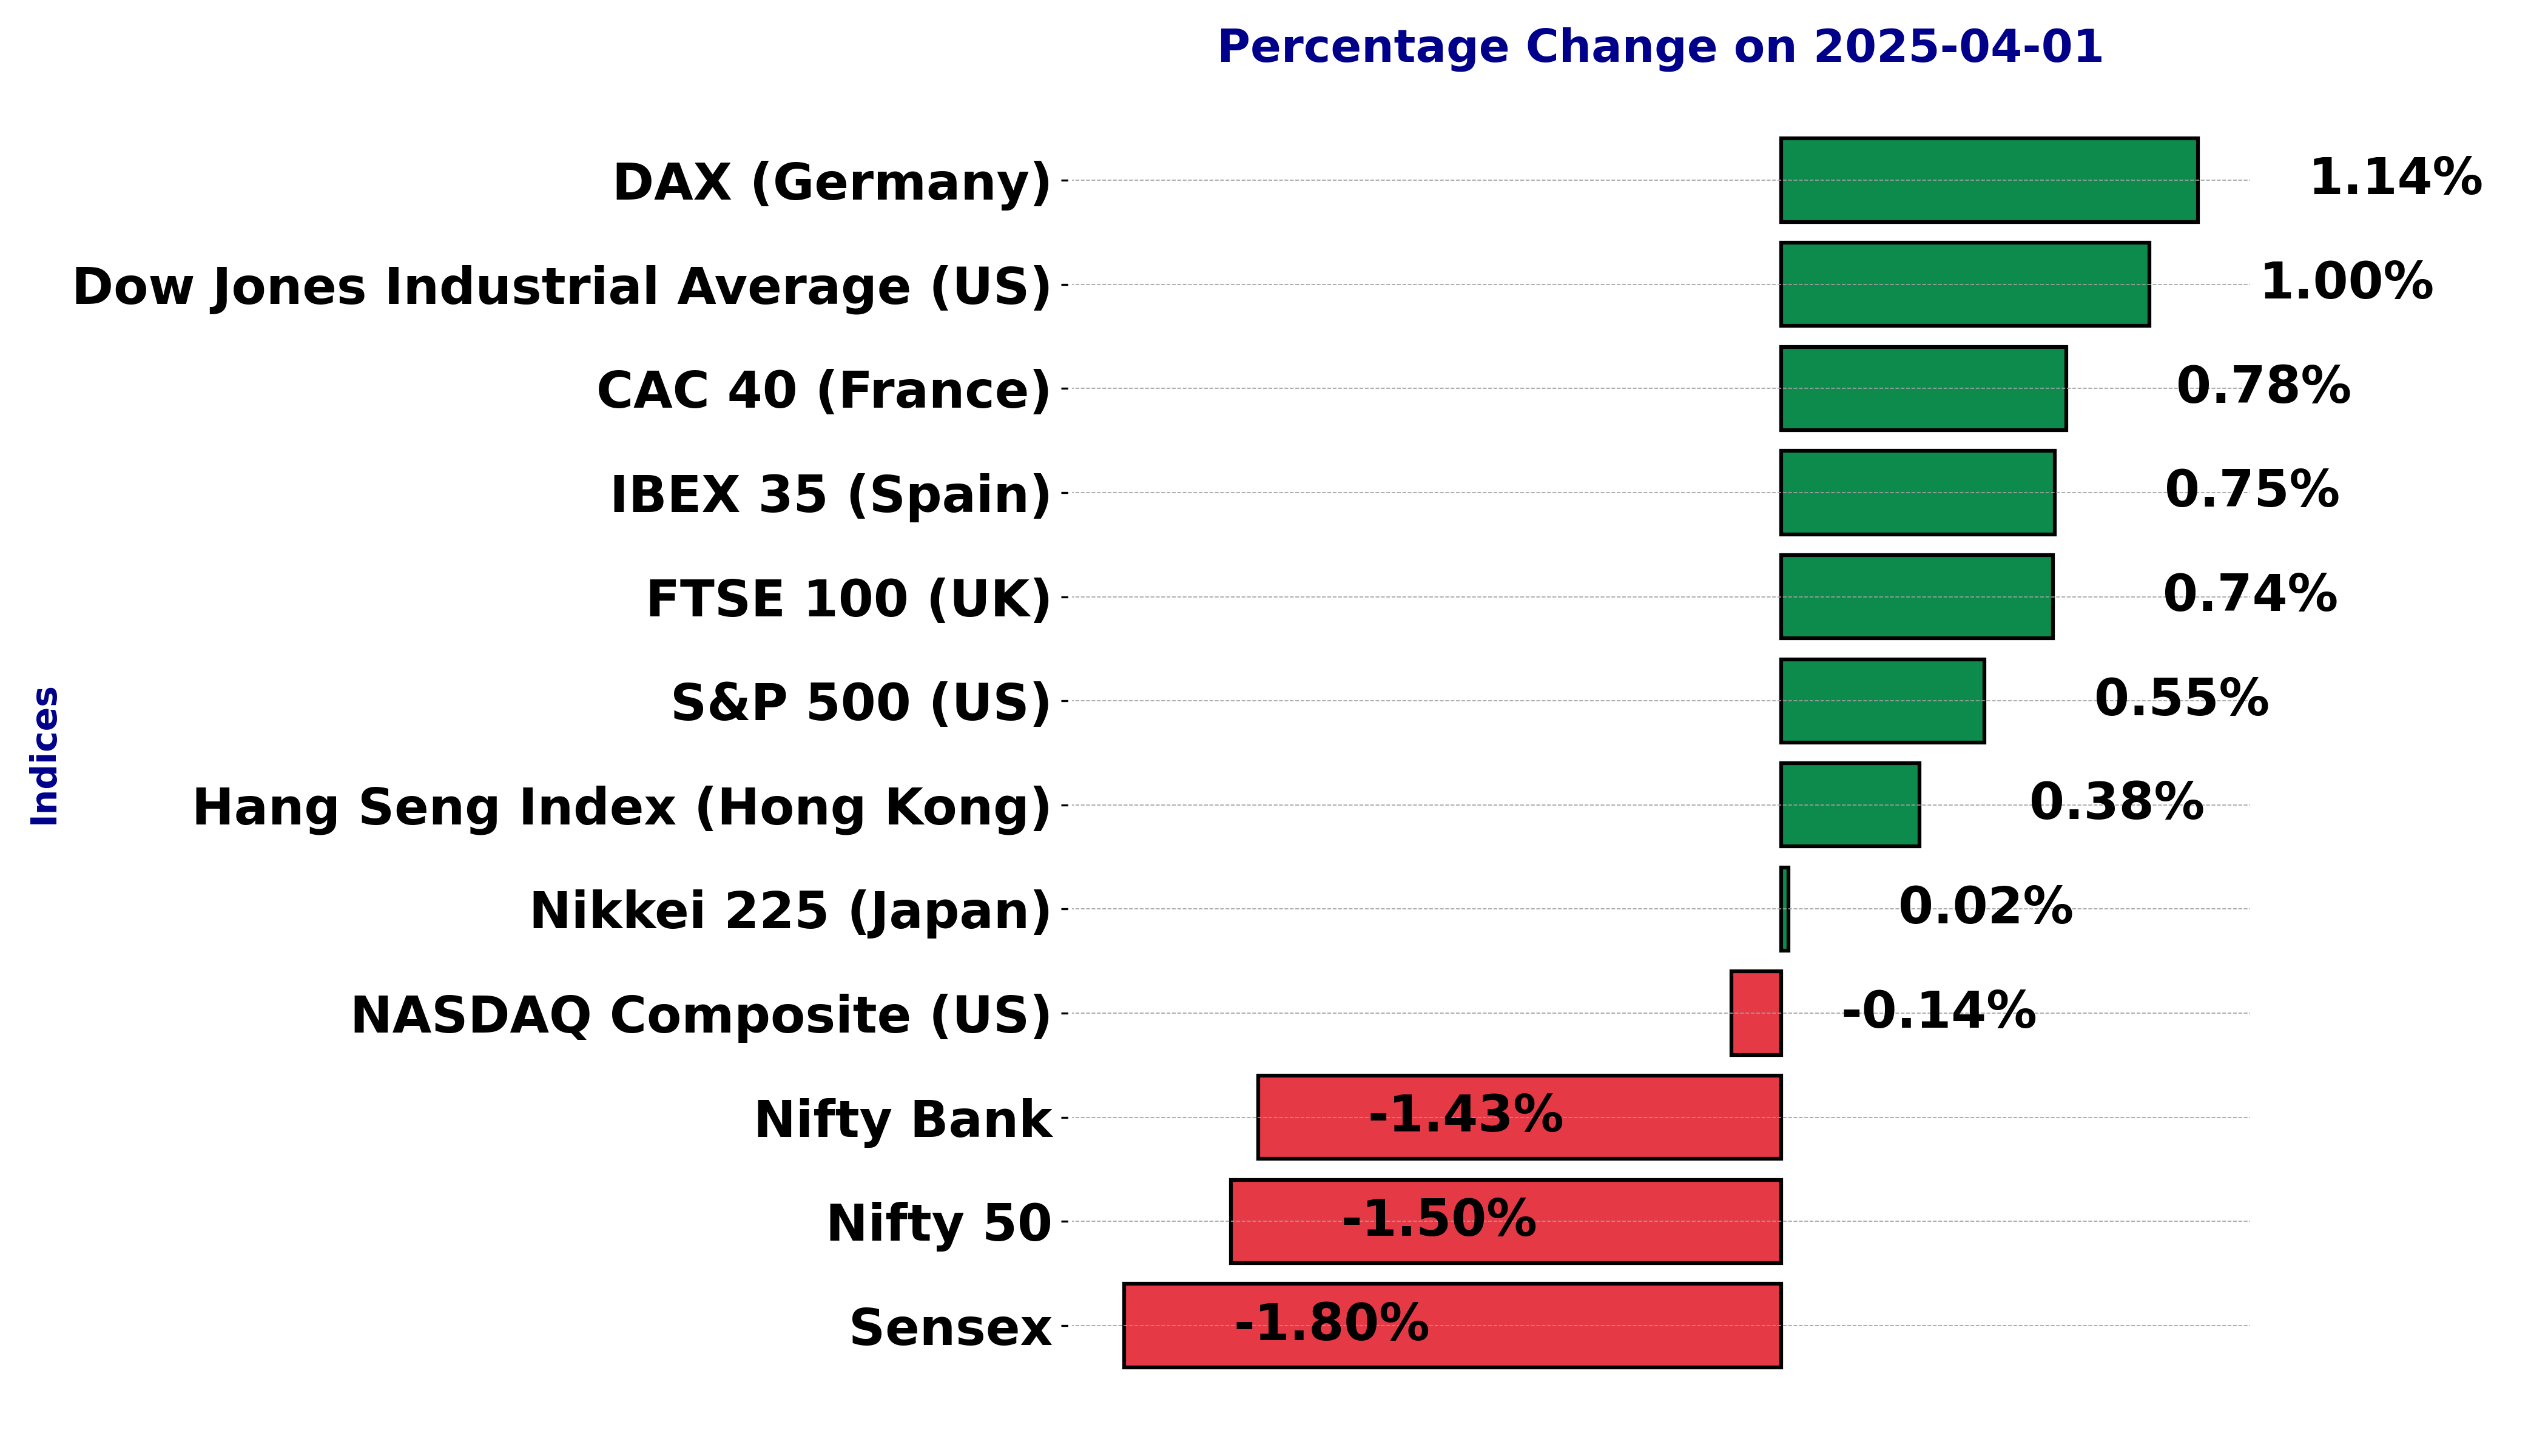
The international stock market indices showed varied performances on April 01, 2025, reflecting the economic sentiment across different regions.
In this article, we analyze the performance of key global indices including the S&P 500, Dow Jones Industrial Average, NASDAQ Composite, FTSE 100, DAX, CAC 40, IBEX 35, Nikkei 225, Hang Seng, Nifty 50, and BSE Sensex.
Analysis for Sensex - April 01, 2025

The Sensex opened at 76,882.58 and closed at 76,024.51, marking a decline of 1.80% with a points change of -1,390.41. The moving averages suggest mixed momentum, with the 50-day EMA slightly below the current close and the RSI indicating a neutral position.

Relationship with Key Moving Averages
The Sensex closed below both the 50-day EMA (76,258.59) and the 200-day EMA (77,164.47), indicating a potential bearish trend as the current close (76,024.51) is below these key moving averages. The 10-day EMA (76,607.63) is above the closing price, and the 20-day EMA (76,081.85) slightly exceeds the close, suggesting that short-term momentum is also in a downward direction.
Moving Averages Trend (MACD)
Based on the stock data for Sensex, the MACD value of 473.1986 is above the MACD Signal of 203.7653, suggesting a bullish momentum. However, given the overall negative percentage change of -1.80%, investors should remain cautious of potential market volatility.

RSI Analysis
The RSI value for Sensex is 50.33, suggesting a neutral momentum in the market. Values close to or around 50 typically indicate a balance between bullish and bearish pressures, implying that the index is currently neither overbought nor oversold.

Analysis for Dow Jones Industrial Average (US) - April 01, 2025

The Dow Jones Industrial Average closed at 42,001.76, marking a 1.00% increase from the previous close, with a points change of 417.86. Despite closing higher, technical indicators show mixed signals with the 10-day EMA below the 50-day EMA and a RSI of 44.73, suggesting cautious optimism among investors.

Relationship with Key Moving Averages
The Dow Jones Industrial Average opened below its 200-day EMA of 42014.78 and closed below the 50-day EMA of 42831.12, indicating potential downward pressure. However, it closed above the 10-day EMA of 42088.17 but below the 20-day EMA of 42288.04, suggesting mixed short-term momentum.
Moving Averages Trend (MACD)
The Dow Jones Industrial Average shows a MACD of -324.95, which is higher than the MACD Signal of -406.48, indicating a potential bullish momentum. However, the negative MACD values suggest that the index is currently in a bearish trend overall.

RSI Analysis
The Relative Strength Index (RSI) for the Dow Jones Industrial Average is 44.73, indicating that the index is in the neutral zone. An RSI below 50 suggests that there may be more selling pressure than buying on the index, but it is not in the oversold or overbought territory.

Analysis for CAC 40 (France) - April 01, 2025

CAC 40 (France) opened at 7837.45 and closed at 7851.36, marking a rise of 60.65 points and a percentage change of 0.78% from the previous close of 7790.71. The index experienced a high of 7884.35 and a low of 7814.73, reflecting moderate intraday movement, with no trading volume recorded for this data. The Relative Strength Index (RSI) is at 40.83, suggesting a neutral to slightly bearish momentum, while the MACD indicates a negative divergence.

Relationship with Key Moving Averages
Based on the given data for CAC 40 (France), the current closing price of 7851.36 is below the 10-day EMA of 7960.05 and the 50-day EMA of 7951.13 but above the 200-day EMA of 7709.81. This indicates a potential continuation of the short-term downtrend amidst a long-term positive trend.
Moving Averages Trend (MACD)
The MACD for CAC 40 (France) is -33.01, which is significantly below the MACD Signal line at 0.52. This suggests a bearish momentum in the market, indicating potential downward pressure on the index.

RSI Analysis
CAC 40 (France) RSI Analysis: The current RSI for CAC 40 is 40.83, suggesting a bearish momentum as it is below the neutral level of 50. This might indicate the index is approaching oversold conditions, but not yet in a typical oversold territory which is below an RSI of 30.

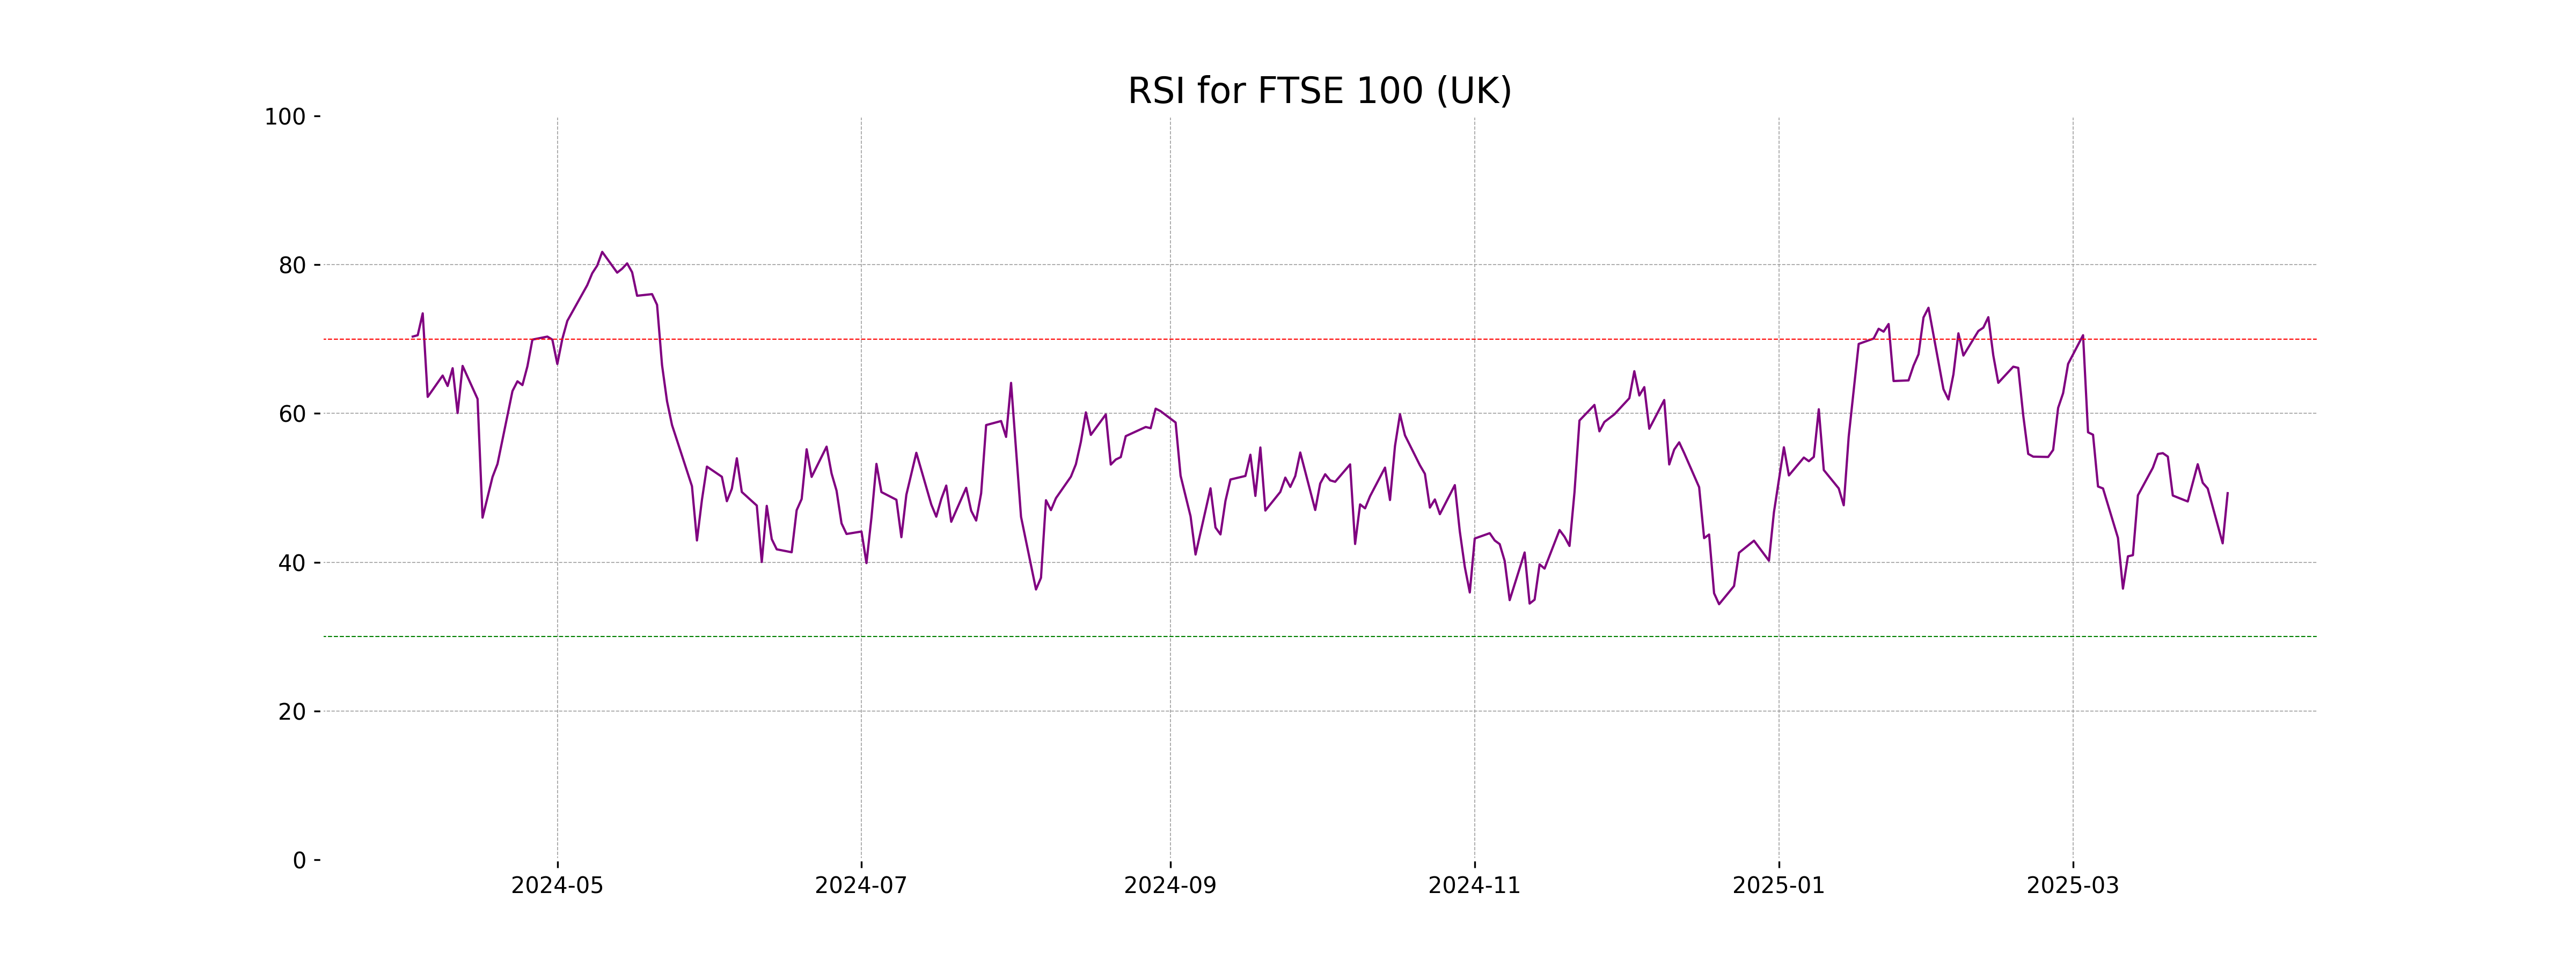
Analysis for FTSE 100 (UK) - April 01, 2025

FTSE 100 (UK) opened at 8582.81 and closed at 8646.41, showing a positive change of 0.74% from the previous close of 8582.80. Despite a neutral RSI of 49.28, the index experienced a points change of 63.61, indicating a moderate upward movement amidst mixed signals from the MACD.

Relationship with Key Moving Averages
FTSE 100 (UK) closed at 8646.41, which is above the 50 EMA of 8613.31, indicating a recent uptrend possibility. However, it is below the 10 EMA of 8648.92 and 20 EMA of 8656.18, suggesting potential resistance in the short term. The 200 EMA is at 8358.78, showing the index is on a longer-term upward trend.
Moving Averages Trend (MACD)
FTSE 100 (UK): The current MACD value of -3.36 compared to the MACD Signal of 2.36 suggests a bearish momentum. Investors might want to closely monitor the trend as the MACD line is below the signal line, indicating potential continued downward movement.

RSI Analysis
The RSI (Relative Strength Index) for FTSE 100 is 49.28, indicating a neutral position as it is close to the midpoint of 50. This suggests neither overbought nor oversold conditions in the market. Traders may await further market signals before taking strong buy or sell actions.
Analysis for DAX (Germany) - April 01, 2025

The DAX (Germany) index opened at 22,343.41 and closed at 22,415.73, showing a positive movement with a percentage change of 1.14% and a points change of 252.24. The RSI indicates a moderate level of 46.59, suggesting neither overbought nor oversold conditions, while the MACD is below the MACD Signal, potentially indicating a bearish trend.

Relationship with Key Moving Averages
The DAX (Germany) closed above the 50 EMA (22,251.08) and the 200 EMA (20,307.11) but below the 10 EMA (22,649.97) and 20 EMA (22,693.89), suggesting a possible short-term bearish outlook despite a stronger position relative to medium and long-term averages. The RSI of 46.59 also indicates neutrality, aligning between the overbought and oversold thresholds.
Moving Averages Trend (MACD)
The MACD analysis for DAX (Germany) suggests a bearish outlook as the MACD value of 36.92 is significantly below the MACD Signal of 161.99. This indicates that the recent momentum is weaker compared to historical values, potentially signaling a downturn or correction in the current trend.

RSI Analysis
The DAX's Relative Strength Index (RSI) is at 46.59, indicating that the index is in a neutral zone, neither overbought nor oversold. Traders might interpret this as a lack of strong momentum in either direction.

Analysis for S&P 500 (US) - April 01, 2025

The S&P 500 Index opened at 5527.91, reaching a high of 5627.56 and closing at 5611.85. The index experienced a positive change with a 0.55% increase compared to the previous close of 5580.94, showing a points change of 30.91. Despite this upward movement, the current price is still below key moving averages, indicating potential caution in the market.

Relationship with Key Moving Averages
Relationship with Key Moving Averages for S&P 500 (US): The current closing price of 5611.85 is below the 10 EMA of 5668.81, 20 EMA of 5713.11, 50 EMA of 5816.79, and 200 EMA of 5703.14, indicating a bearish short-term trend. Additionally, the RSI at 40.41 suggests the index is nearing oversold territory.
Moving Averages Trend (MACD)
The MACD value for S&P 500 is -65.31, and the signal line is at -72.51, suggesting a weak upward momentum as the MACD line is above the signal line. However, both values being negative indicates overall bearish pressure in the market.

RSI Analysis
In the analysis of the S&P 500 (US), the RSI is at 40.41, indicating that the index is currently in the neutral zone, leaning towards being oversold. This suggests potential for a price reversal if the RSI drops further, typically below 30, which is considered an oversold level.

Analysis for Hang Seng Index (Hong Kong) - April 01, 2025

The Hang Seng Index opened at 23,217.11, reached a high of 23,456.58, and closed at 23,206.84, marking a positive change of 0.38% from the previous close of 23,119.58. It demonstrated a MACD below the signal line, suggesting bearish momentum, while the 50-EMA and 200-EMA indicate a long-term uptrend when compared to the current closing price. The RSI is relatively neutral at 48.04.

Relationship with Key Moving Averages
The Hang Seng Index is currently trading slightly above its 50-day EMA, suggesting a short-term upward trend. However, it remains well above its 200-day EMA, indicating a longer-term strength in comparison to historical averages. The index is positioned below its 10-day and 20-day EMAs, which may signal near-term resistance.
Moving Averages Trend (MACD)
The MACD for the Hang Seng Index shows a value of 178.23, while the MACD Signal is 380.58. Since the MACD is below the MACD Signal, it may indicate a potential bearish trend for the index.

RSI Analysis
The RSI of the Hang Seng Index (Hong Kong) is 48.04, which suggests it is approaching a neutral state. This level indicates that the index is neither overbought nor oversold at the current moment, suggesting a potential consolidation or indecision in the market.

Analysis for IBEX 35 (Spain) - April 01, 2025

The IBEX 35 index in Spain opened at 13,191.0 and closed at 13,233.4, marking a 0.75% increase from the previous close of 13,135.4, with a points change of 98. The trading volume was noted at 32,698,516. The RSI value is 53.11, indicating a moderately bullish sentiment, while the MACD is at 109.66 against a signal of 137.95, suggesting a potential weakening in upward momentum.

Relationship with Key Moving Averages
The IBEX 35 closed at 13,233.40, which is above its 50-day EMA of 12,908.62 and substantially above the 200-day EMA of 11,961.69, indicating a bullish trend. However, it is slightly below the 10-day EMA of 13,279.16, suggesting short-term weakness.
Moving Averages Trend (MACD)
The MACD for IBEX 35 shows a value of 109.66, while the signal line is higher at 137.95. This suggests a potential bearish signal, indicating the possibility of downward momentum as the MACD line is below the signal line. However, further analysis of additional indicators is recommended for a comprehensive assessment.

RSI Analysis
The RSI (Relative Strength Index) for IBEX 35 stands at 53.11, indicating a neutral momentum with no current intense buying or selling pressure. Being near the midpoint of the RSI scale (which ranges from 0 to 100), the index does not show signs of being overbought or oversold, suggesting potential stability in the current trend.

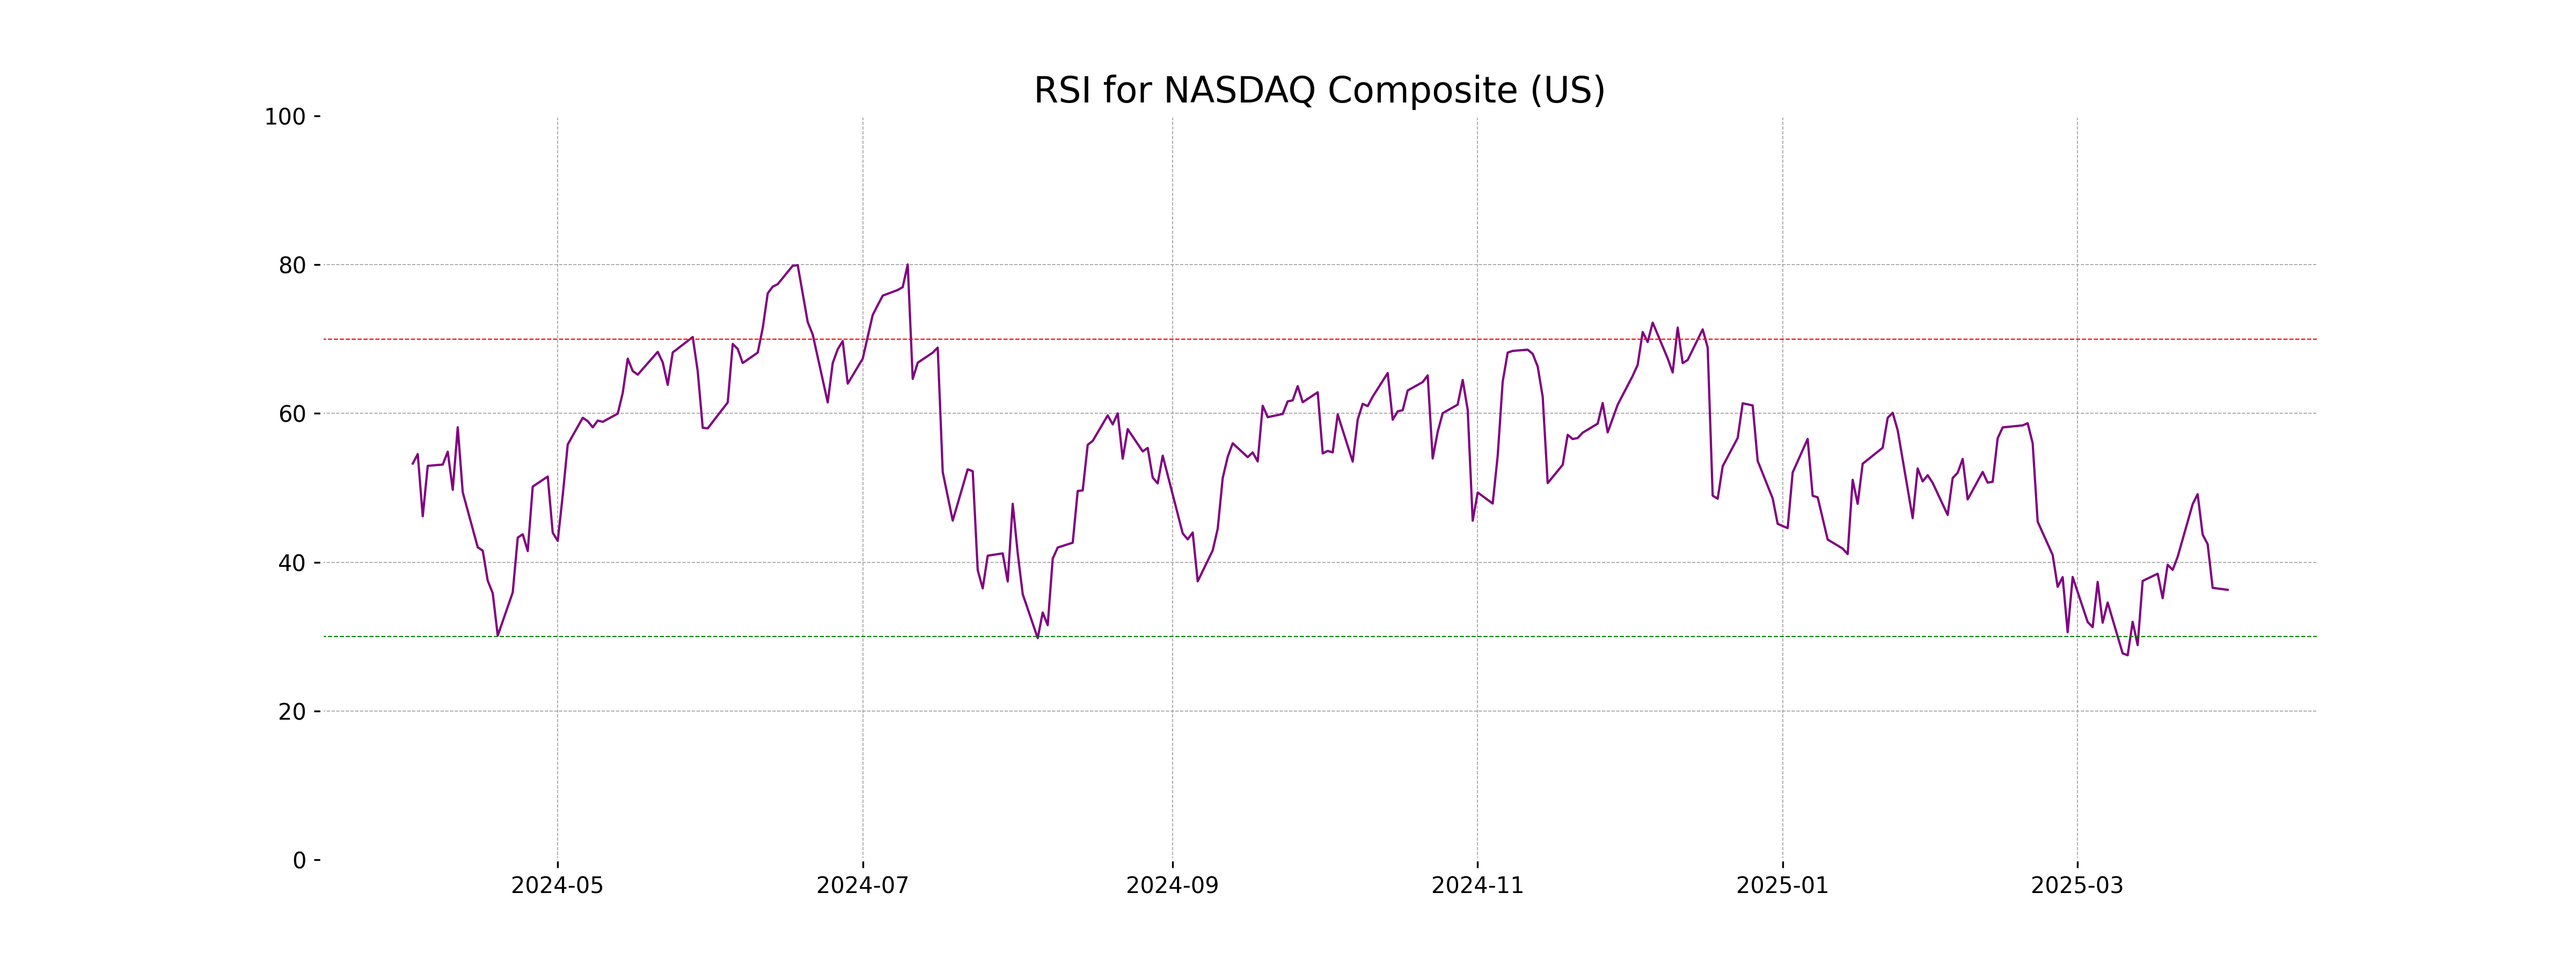
Analysis for NASDAQ Composite (US) - April 01, 2025

NASDAQ Composite (US) Performance: On its latest trading day, the NASDAQ Composite opened at 17,045.44 and closed at 17,299.29, marking a slight decrease of 0.14% from the previous close. With a trading volume of 8,122,180,000 and an RSI of 36.29, the index shows signs of being in a bearish trend, as suggested by a negative MACD value.

Relationship with Key Moving Averages
Based on the given data, NASDAQ Composite is trading below its key moving averages, with the current close of 17299.29 being lower than its 50-EMA of 18513.42, 200-EMA of 18230.96, 10-EMA of 17711.76, and 20-EMA of 17954.07. This suggests a short-term and long-term bearish momentum.
Moving Averages Trend (MACD)
The MACD for NASDAQ Composite is -348.30, with a Signal Line of -369.46, indicating bearish momentum as the MACD is above the Signal Line yet still in negative territory, suggesting a potential decline continuation. The RSI stands at 36.29, indicating the index is approaching oversold conditions.

RSI Analysis
The NASDAQ Composite's RSI is currently at 36.29, which indicates that it is nearing the oversold territory. This suggests potential for a market correction or bounce-back in price, as RSI values below 30 typically signal that an asset is undervalued.
Analysis for Nikkei 225 (Japan) - April 01, 2025

Nikkei 225 (Japan) opened at 35,961.19 and closed slightly higher at 35,624.48, marking a modest increase of 0.02% from the previous close with a points change of 6.92. The RSI indicates a potentially oversold condition at 29.16, while the MACD is -446.54, suggesting bearish momentum compared to the MACD Signal.

Relationship with Key Moving Averages
Nikkei 225 is currently trading below all its key moving averages, with the 10 EMA at 36923.01, the 50 EMA at 37929.84, and the 200 EMA at 38106.91. This indicates a bearish sentiment as the index is significantly lower than these averages, coupled with an RSI of 29.16, suggesting it's in oversold territory.
Moving Averages Trend (MACD)
The MACD for Nikkei 225 indicates a bearish sentiment, as the MACD value of -446.54 is below the MACD Signal line of -327.19. This suggests a downward momentum in the stock price.

RSI Analysis
The RSI for Nikkei 225 is 29.16, placing it in the oversold territory. This suggests a potential buying opportunity, indicating that the index might be undervalued currently.

Analysis for Nifty Bank - April 01, 2025

Nifty Bank opened at 51,178.15 and closed at 50,827.50, marking a decline of approximately -1.43% with a points change of -737.35. The stock's RSI is 59.81, indicating a relatively neutral momentum, while the MACD suggests a bullish trend with a difference of 258.97 between the MACD and the signal line.

Relationship with Key Moving Averages
Nifty Bank's current close of 50827.5 is above the 50-day EMA of 49785.97 and the 200-day EMA of 49995.36, indicating a generally bullish trend despite the recent negative change. However, it is slightly above the 10-day EMA of 50716.42 and below the recent highs, suggesting a potential near-term correction.
Moving Averages Trend (MACD)
MACD Analysis for Nifty Bank: The MACD value for Nifty Bank is currently 640.62, which is higher than the MACD Signal of 381.65. This suggests a bullish trend, indicating potential upward momentum in the stock price. However, with other metrics in consideration, one should use MACD in conjunction with additional indicators for a comprehensive analysis.

RSI Analysis
The RSI for Nifty Bank is 59.81, indicating a relatively neutral position near the midpoint of 50. This suggests that the stock is neither overbought nor oversold at the moment, reflecting balanced buying and selling pressures.

Analysis for Nifty 50 - April 01, 2025

Nifty 50 opened at 23,341.10 and closed at 23,165.70, marking a decline of 353.65 points or approximately -1.50% compared to the previous close. The index showed volatility, with a high of 23,565.15 and a low of 23,136.40. The 50 EMA was observed at 23,117.90, indicating a close alignment with the closing value, while the RSI was 53.02, suggesting a moderately neutral momentum.

Relationship with Key Moving Averages
Nifty 50 closed below its previous close and all key EMAs, with the close at 23165.70 compared to the 50 EMA at 23117.90 and the 200 EMA at 23408.59, indicating downward momentum. The 10 and 20 EMAs at 23275.02 and 23091.70, respectively, suggest a short-term consolidation phase below these averages.
Moving Averages Trend (MACD)
Nifty 50 is showing a bullish trend as the MACD is above the MACD Signal line, with a value of 171.26 compared to the signal's 82.99. This suggests potential upward momentum in the stock's price. However, the overall market environment and other indicators should also be considered for a comprehensive analysis.

RSI Analysis
The relative strength index (RSI) for the Nifty 50 is at 53.02, indicating a neutral momentum. Generally, an RSI value above 70 suggests that a stock is overbought, while a value below 30 implies it is oversold. With RSI at 53.02, the Nifty 50 is neither in an overbought nor oversold condition, suggesting no strong momentum in either direction.
