Global stock market indices: How the world markets performed today - 7 April 2025
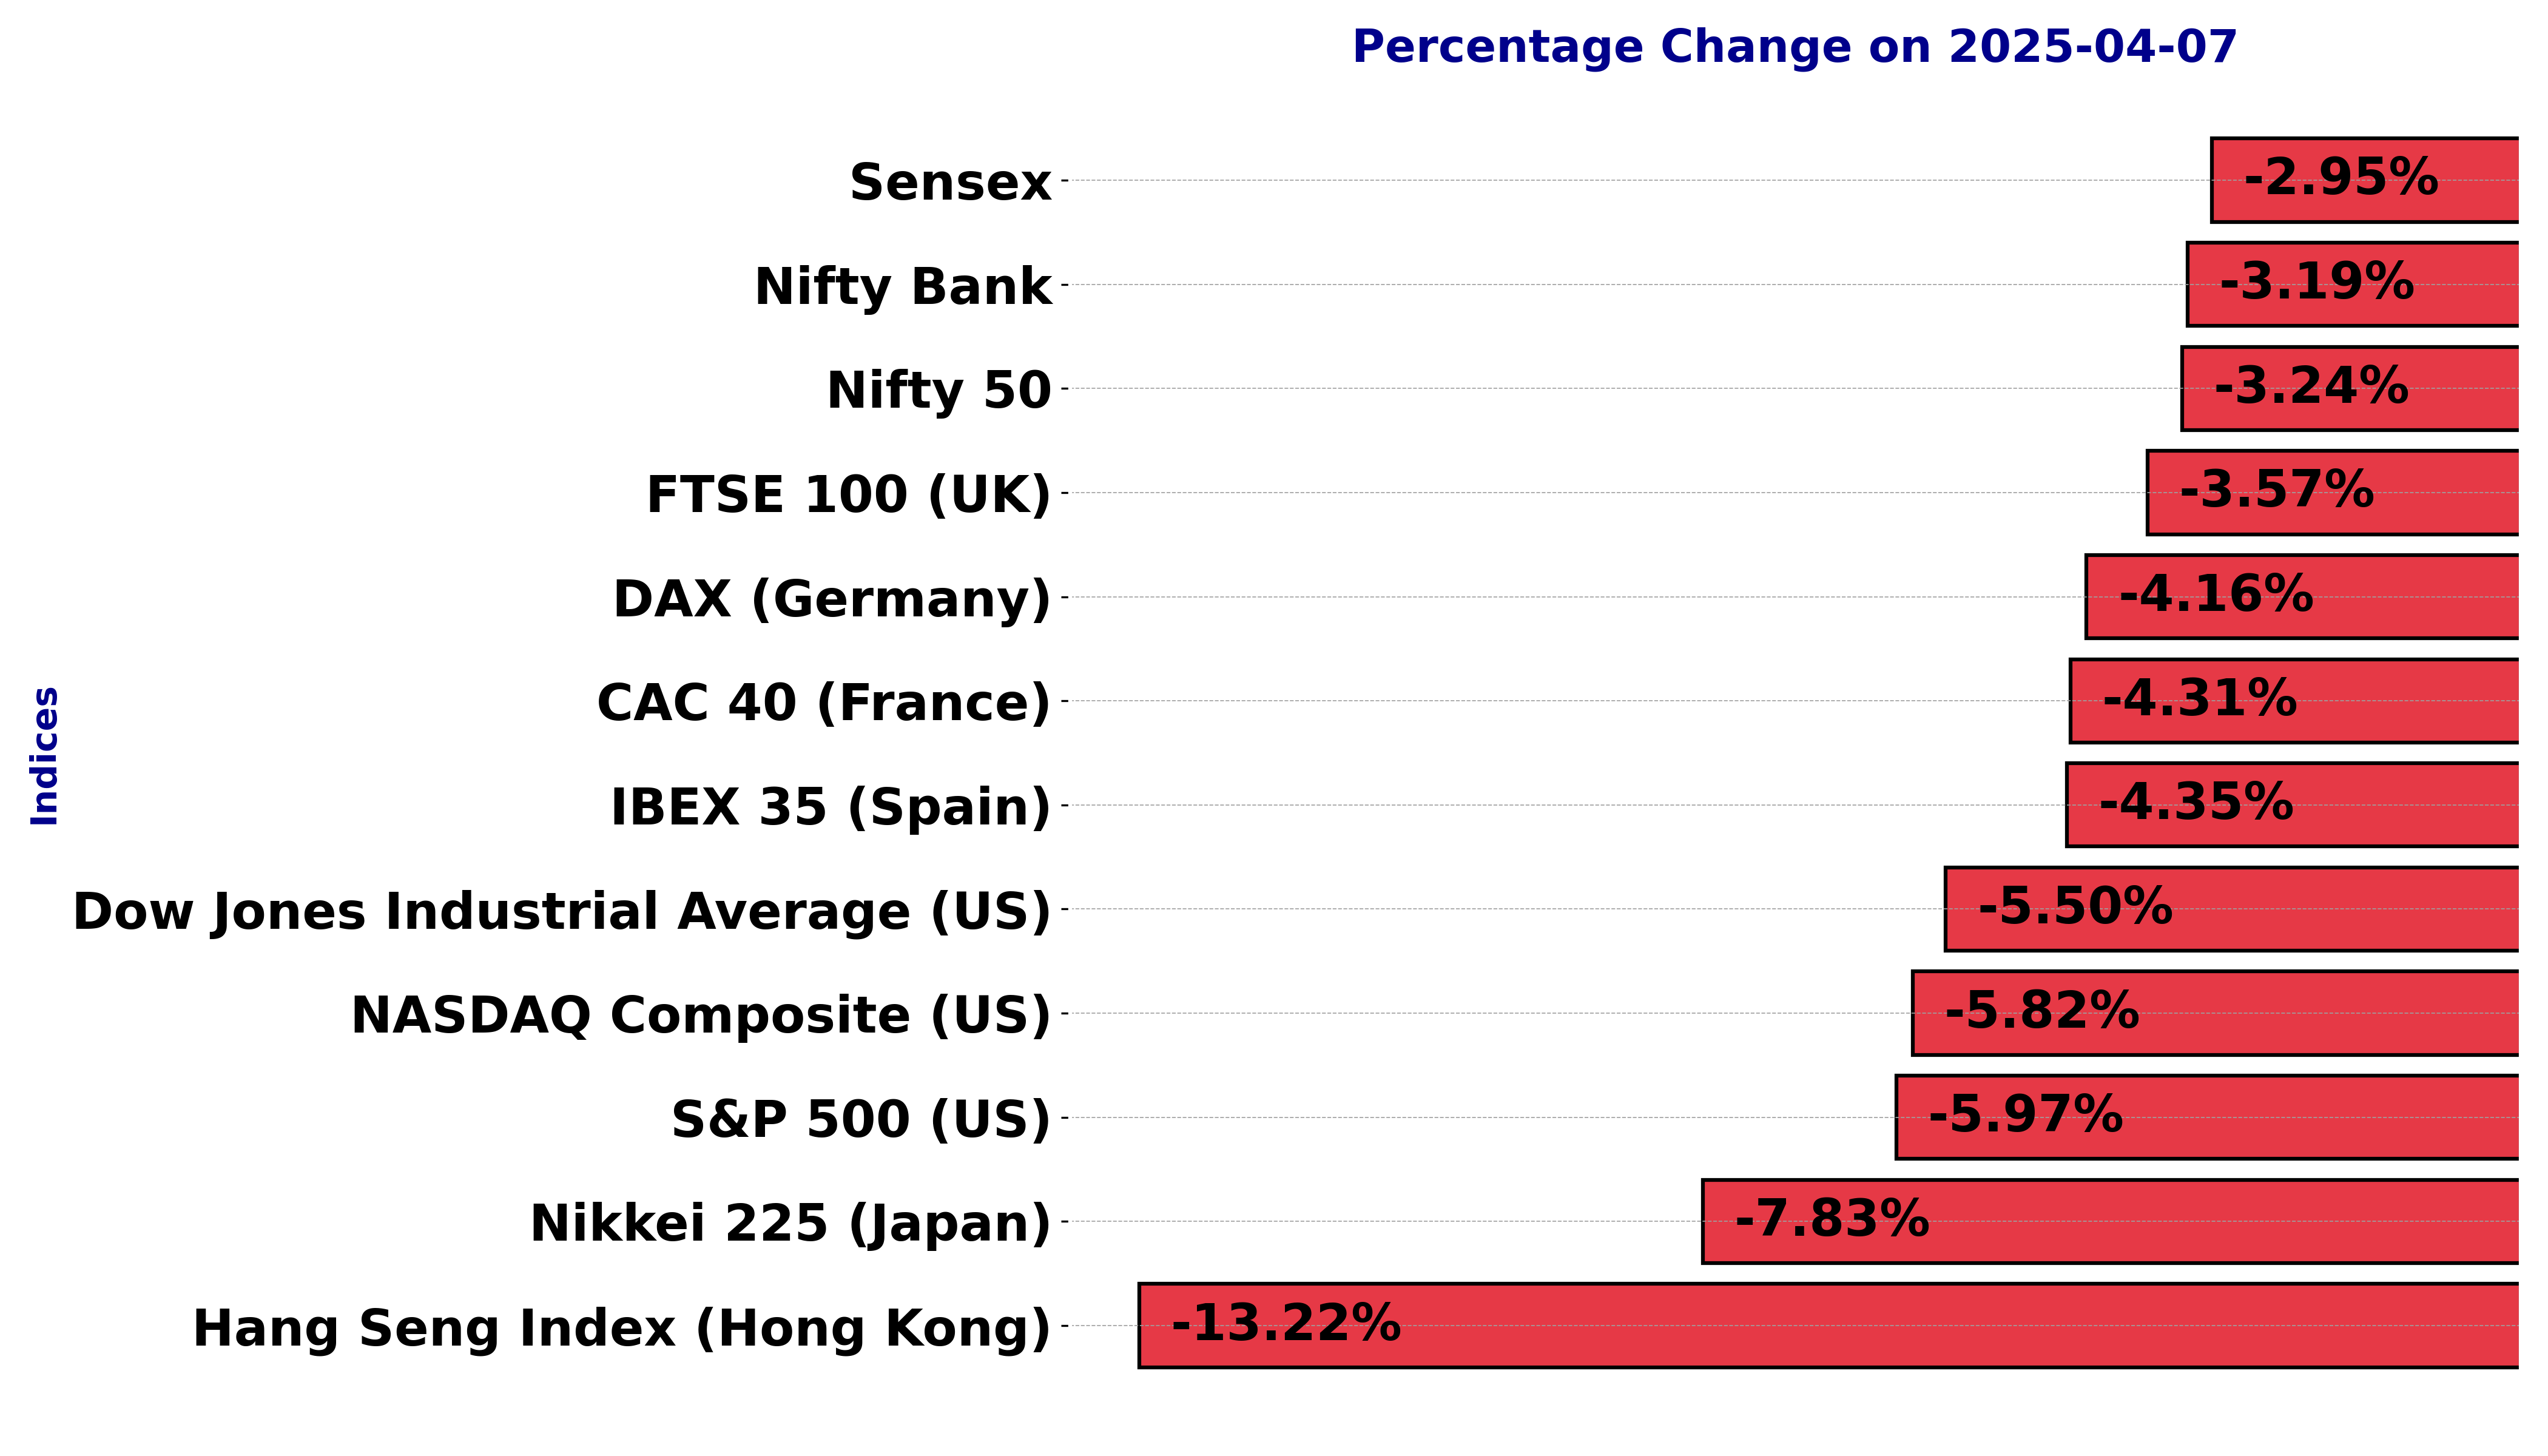
The international stock market indices showed varied performances on April 07, 2025, reflecting the economic sentiment across different regions.
In this article, we analyze the performance of key global indices including the S&P 500, Dow Jones Industrial Average, NASDAQ Composite, FTSE 100, DAX, CAC 40, IBEX 35, Nikkei 225, Hang Seng, Nifty 50, and BSE Sensex.
Analysis for Sensex - April 07, 2025

The Sensex opened at 71,449.94 and closed at 73,137.90, experiencing a decrease of approximately 2.95% or a points change of -2,226.79, compared to the previous close of 75,364.69. The RSI is at 34.12, indicating a potential oversold scenario. The short-term moving averages (10 EMA and 20 EMA) are below the 50 EMA, reflecting a bearish trend.

Relationship with Key Moving Averages
Based on the given data for Sensex, the current closing value of 73,137.90 is below the 10-day EMA (75,754.84), 20-day EMA (75,794.10), 50-day EMA (76,116.34), and 200-day EMA (77,093.90), indicating a bearish trend. This positioning below the key moving averages suggests potential continued downward pressure.
Moving Averages Trend (MACD)
The MACD for Sensex is 12.98, which is below the MACD Signal of 229.35, indicating a bearish trend. This could suggest potential downward momentum, as the MACD line is significantly lower than the signal line.

RSI Analysis
The Relative Strength Index (RSI) for Sensex is at 34.12, indicating that the index is approaching oversold territory. An RSI below 30 generally suggests that a stock or index is oversold, suggesting potential for a price rebound if other factors align.

Analysis for Dow Jones Industrial Average (US) - April 07, 2025

The Dow Jones Industrial Average (US) opened at 40097.90, reached a high of 40097.90, and closed at 38314.86, indicating a significant decline of 5.50% with a point change of -2231.07. The RSI is at 23.55, suggesting the index is in oversold territory. Additionally, the MACD value of -637.26 indicates bearish momentum compared to the signal line.

Relationship with Key Moving Averages
The Dow Jones Industrial Average opened significantly below its 10, 20, 50, and 200-day EMAs, indicating a substantial downtrend. With a close far below these EMAs, the technical indicators suggest bearish momentum, as supported by the low RSI and negative MACD.
Moving Averages Trend (MACD)
Dow Jones Industrial Average (US) MACD Analysis: The MACD value of -637.26 and the MACD Signal value of -422.31 indicate a bearish momentum in the Dow Jones Industrial Average. The MACD is moving further below its signal line, suggesting strengthening downward momentum.

RSI Analysis
### RSI Analysis for Dow Jones Industrial Average (US): The RSI (Relative Strength Index) for the Dow Jones Industrial Average is currently at 23.55, indicating that it is in the oversold territory. This low RSI suggests that the index could be experiencing a bearish trend, with a potential for a reversal if conditions change.

Analysis for CAC 40 (France) - April 07, 2025

CAC 40 (France) Performance: The CAC 40 closed at 6961.56, experiencing a drop of 313.39 points, which is a 4.31% decrease from its previous close of 7274.95. The stock shows bearish momentum with an RSI of 19.06, indicating oversold conditions. The MACD of -168.92 further suggests a negative trend compared to the MACD Signal of -63.06.

Relationship with Key Moving Averages
The CAC 40 index closed below its key moving averages, with the close at 6961.56 compared to its 50-day EMA of 7871.72, 200-day EMA of 7698.72, 10-day EMA of 7624.60, and 20-day EMA of 7801.36. This positioning indicates a strong downward trend as the close is significantly lower than these averages.
Moving Averages Trend (MACD)
The MACD for CAC 40 is at -168.92, which is below the MACD Signal line of -63.06. This suggests a bearish trend as the MACD line is significantly below the signal line, indicating potential continued downward momentum.

RSI Analysis
The Relative Strength Index (RSI) for CAC 40 (France) is 19.06, which indicates that the index is in the oversold territory. This suggests potential buying opportunities could emerge, as the RSI below 30 typically implies that the stock has been heavily sold off.

Analysis for FTSE 100 (UK) - April 07, 2025

FTSE 100 (UK) experienced a significant decline, closing at 7767.15 with a percentage decrease of -3.57% from the previous close of 8055. The index shows bearish momentum with an RSI of 15.72, indicating oversold conditions, and a MACD of -119.66, which is considerably below the signal line, suggesting negative sentiment.

Relationship with Key Moving Averages
FTSE 100 (UK) is currently trading below its key moving averages, with a closing price of 7767.15 compared to the 50 EMA of 8553.52, 200 EMA of 8353.37, 10 EMA of 8374.07, and 20 EMA of 8501.45. The substantial divergence suggests a bearish trend, compounded by an RSI of 15.72, indicating that the index is in a highly oversold condition.
Moving Averages Trend (MACD)
The MACD for FTSE 100 is -119.66, significantly below the MACD Signal of -36.51, indicating a strong downward momentum in the market. With a very low RSI of 15.72, the index is in oversold territory, suggesting potential for a reversal or continued bearish trend.

RSI Analysis
FTSE 100 (UK) currently has a very low RSI of 15.72, indicating that the index is in an oversold territory. This suggests potential for a rebound, as the market might be experiencing bearish exhaustion. However, further analysis and market conditions should be considered before making any investment decisions.

Analysis for DAX (Germany) - April 07, 2025

The DAX index opened at 18,751.75 and closed at 19,783.94, experiencing a points change of -857.78 and a percentage change of -4.16%. The RSI value of 24.49 indicates an oversold condition, while the MACD suggests a negative momentum with a value of -380.99.

Relationship with Key Moving Averages
The DAX is trading below its 50-day, 20-day, and 10-day EMAs, indicating bearish momentum. The RSI of 24.49 suggests that the index is oversold. Additionally, the negative MACD and MACD Signal further confirm a bearish trend.
Moving Averages Trend (MACD)
Based on the stock data for DAX (Germany), the MACD value is negative at -380.9898, which is below the MACD Signal line at -46.6488. This situation suggests a bearish trend, indicating that selling pressure may be strong at present.

RSI Analysis
The RSI value for DAX is 24.49, indicating that the index is in an oversold condition. This suggests that the stock market could be due for a potential rebound or corrective rally, as an RSI below 30 typically signals oversold conditions.

Analysis for S&P 500 (US) - April 07, 2025

The S&P 500 (US) opened and reached a high of 5292.14, but closed lower at 5074.08, marking a significant decrease of -5.97% from the previous close. The relative strength index (RSI) is at a low of 23.25, indicating oversold conditions, while the MACD shows bearish momentum. The volume was notably high at 8.85 billion.

Relationship with Key Moving Averages
The S&P 500 is currently trading below its 50-day EMA (5760.16), 200-day EMA (5692.93), 20-day EMA (5616.04), and 10-day EMA (5516.88), indicating a bearish trend. With the RSI at 23.25, the index appears to be oversold.
Moving Averages Trend (MACD)
The MACD value for S&P 500 is -114.99, which is below the MACD Signal of -79.04, suggesting a continued bearish trend. The negative MACD indicates that the stock is experiencing downward momentum, and investors may consider this a sell signal.

RSI Analysis
The Relative Strength Index (RSI) for the S&P 500 is at 23.25, indicating that the index is currently in an oversold condition. Typically, an RSI below 30 suggests that an asset may be undervalued and could be a potential buying opportunity.

Analysis for Hang Seng Index (Hong Kong) - April 07, 2025

The Hang Seng Index (Hong Kong) experienced a significant decline with a closing level of 19,828.30, down from the previous close of 22,849.81, representing a percentage change of -13.22%. The RSI is at 23.55, indicating oversold conditions, while the current MACD level suggests a bearish trend continuation.

Relationship with Key Moving Averages
The Hang Seng Index is trading below key moving averages, with its current close at 19,828.30, significantly under the 50 EMA (22,600.59) and the 200 EMA (20,444.53), indicating a bearish trend. Additionally, the 10 EMA and 20 EMA are also above the current price, reinforcing downward momentum.
Moving Averages Trend (MACD)
Hang Seng Index (Hong Kong) MACD Analysis: The MACD value of -216.33 is below the signal line value of 180.98, indicating a bearish momentum. The index is likely experiencing downward pressure, suggesting a potential downtrend continuation.

RSI Analysis
The Hang Seng Index has an RSI of 23.55, indicating that it is currently in an oversold condition. This suggests that the index may be undervalued, and there could be a potential for a price reversal or buying opportunity.

Analysis for IBEX 35 (Spain) - April 07, 2025

The IBEX 35 experienced a negative performance, closing at 11,882.20, down significantly by 539.80 points or 4.35%. The Relative Strength Index (RSI) indicates an oversold condition at 25.64, and the Moving Average Convergence Divergence (MACD) is notably below the signal line, suggesting a bearish trend.

Relationship with Key Moving Averages
The IBEX 35 is trading below its 50-day EMA of 12,877.74, indicating a potential bearish sentiment. It's also slightly below its 200-day EMA of 11,991.60, suggesting weakened momentum over a longer period. Additionally, the index has closed below its 10-day and 20-day EMAs, reinforcing a short-term downtrend.
Moving Averages Trend (MACD)
The MACD for the IBEX 35 shows a bearish trend, as the MACD line is significantly below the signal line, with a value of -81.94 compared to the signal at 67.44. This indicates potential continued downward momentum.

RSI Analysis
The IBEX 35's current RSI is 25.64, indicating that the index is in the oversold territory. This suggests that the market may be experiencing a phase of heavy selling pressure and could potentially be undervalued at present levels.

Analysis for NASDAQ Composite (US) - April 07, 2025

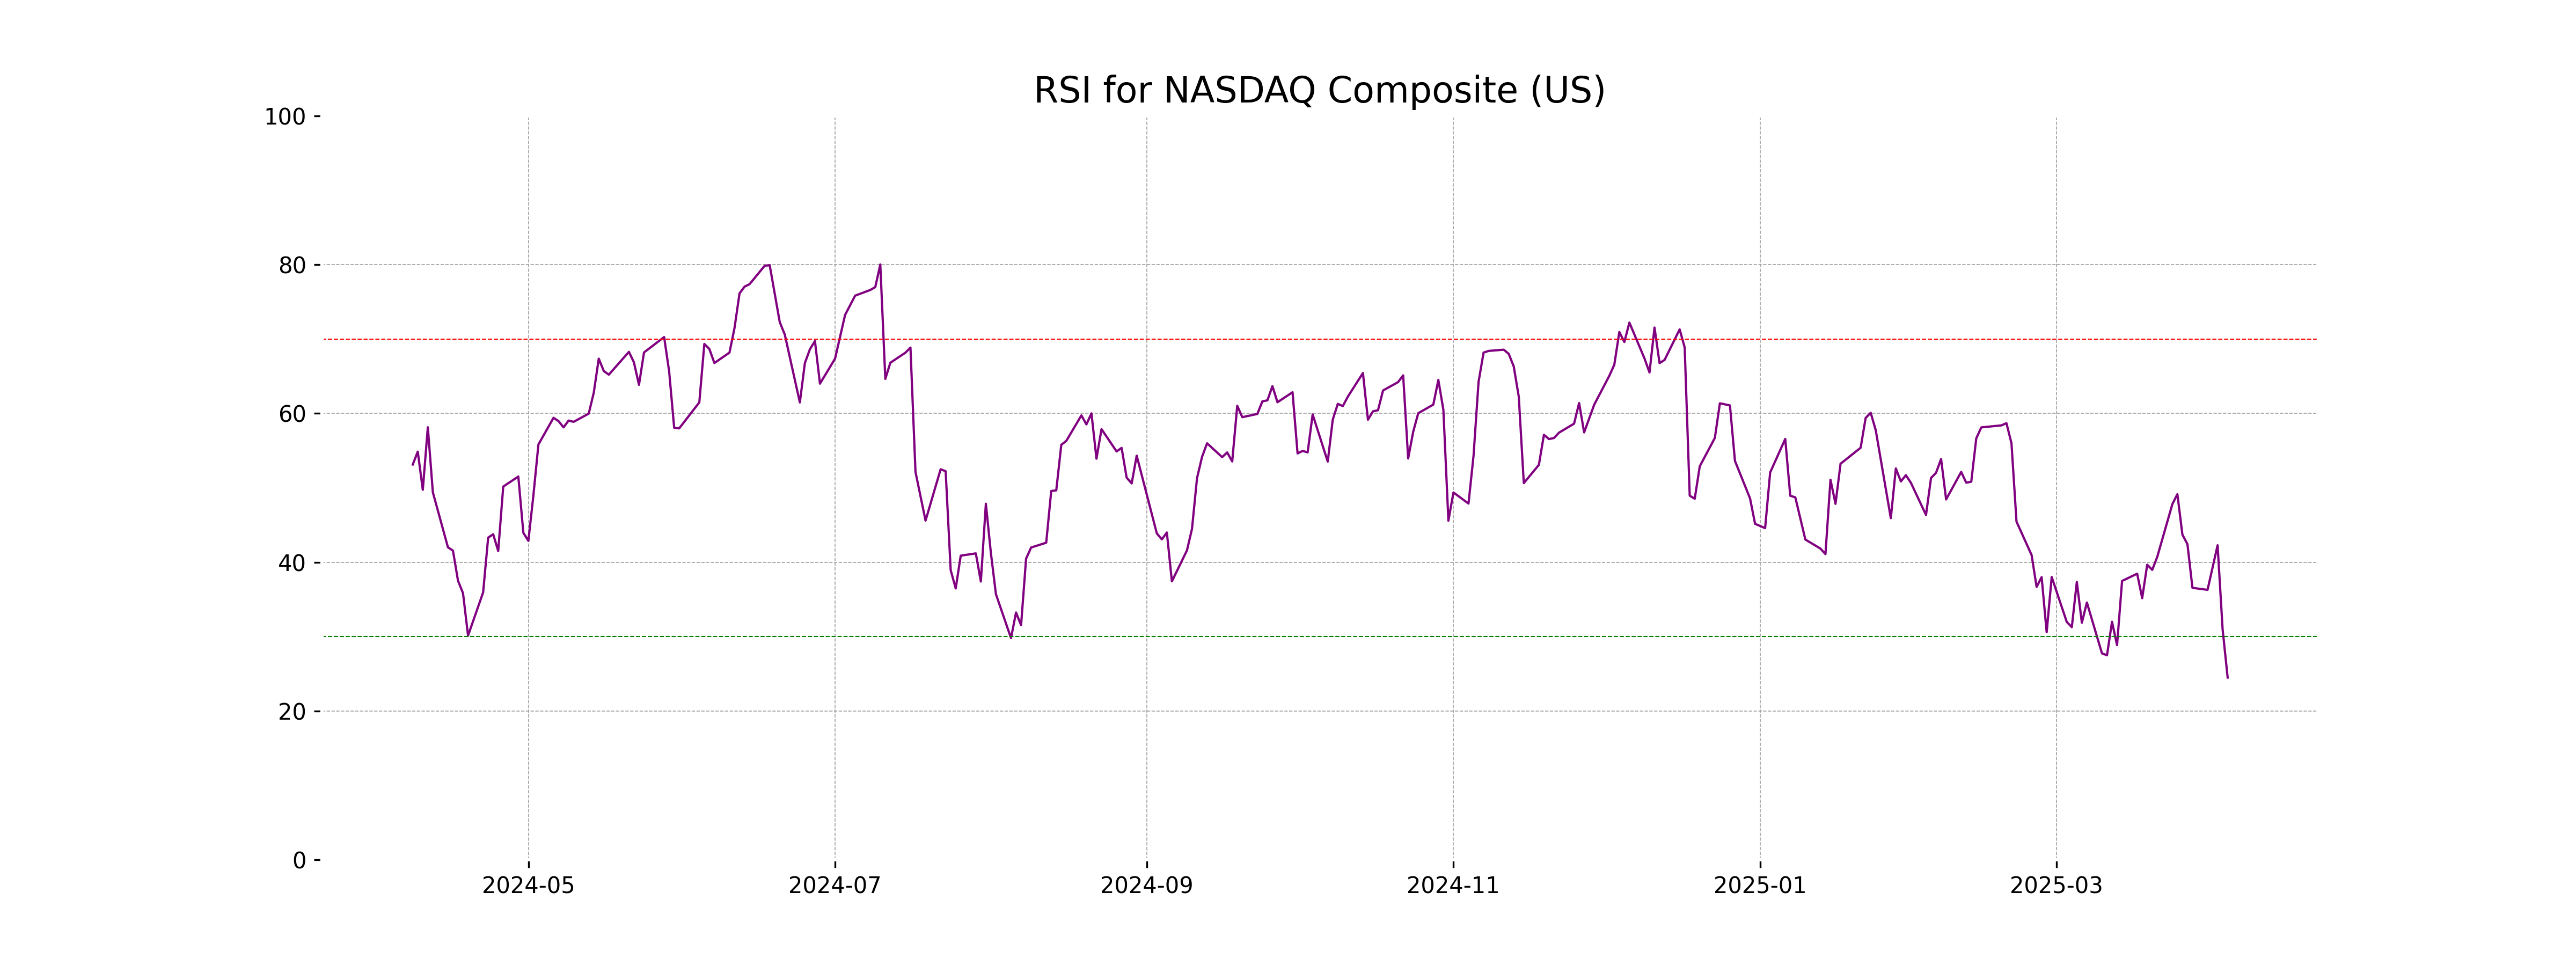
The NASDAQ Composite (US) experienced a sharp decline with a close at 15,587.79, marking a 5.82% decrease from the previous close. The index saw significant volatility, with a trading range between a high of 16,128.16 and a low of 15,575.68. Technical indicators suggest bearish momentum; RSI is at 24.49, indicating oversold conditions, and the MACD stands at -520.85, below its signal line.

Relationship with Key Moving Averages
The NASDAQ Composite is trading below its key moving averages, with the closing price significantly under its 50-day EMA, 200-day EMA, 10-day EMA, and 20-day EMA, indicating a bearish trend. The RSI is low at 24.49, suggesting that the index might be oversold.
Moving Averages Trend (MACD)
NASDAQ Composite (US) MACD Analysis: The MACD for the NASDAQ Composite is currently at -520.85, which is below the MACD Signal line of -396.65. This indicates a bearish trend, suggesting that the market momentum is negative and further decline in the index is possible.

RSI Analysis
RSI Analysis for NASDAQ Composite (US): The RSI (Relative Strength Index) of 24.49 indicates that NASDAQ Composite is currently in the oversold territory. This suggests that the index may be experiencing a bearish trend, potentially signaling an upcoming reversal or a cautious opportunity for investors to evaluate.
Analysis for Nikkei 225 (Japan) - April 07, 2025

Nikkei 225 (Japan) experienced a significant decline, closing at 31,136.58, a drop of approximately 7.83%, or 2643.998 points from the previous close of 33,780.58. The RSI is notably low at 13.99, indicating potential oversold conditions. The MACD value of -1147.36 suggests strong downward momentum.

Relationship with Key Moving Averages
The Nikkei 225 index closed significantly below its key moving averages, with the closing value of 31,136.58 compared to the 50-day EMA of 37,314.83 and the 200-day EMA of 37,939.42, indicating a bearish trend. Additionally, the RSI is extremely low at 13.99, suggesting oversold conditions.
Moving Averages Trend (MACD)
The Nikkei 225 shows a bearish signal, as the MACD of -1147.36 is significantly below the MACD Signal of -628.96. This indicates a strong negative momentum in the current market trend.

RSI Analysis
The RSI for Nikkei 225 (Japan) is 13.99, indicating that the index is currently in an oversold condition. This suggests that there may be limited selling pressure and potential for a price reversal or short-term rally.

Analysis for Nifty Bank - April 07, 2025

Nifty Bank opened at 49,336.10 and closed at 49,860.10, experiencing a decline of 3.19% compared to the previous close of 51,502.70. The sector's RSI indicates a slightly bearish sentiment at 47.20, with the current price trading below both the 50-EMA and 200-EMA, suggesting downward pressure.

Relationship with Key Moving Averages
Nifty Bank closed at 49,860.10, which is below the 50 EMA (49,973.46) and 200 EMA (50,038.32), indicating bearish momentum in the short to medium term. The close is also below the 10 EMA (50,847.81) and 20 EMA (50,396.89), further confirming weak short-term momentum.
Moving Averages Trend (MACD)
The MACD value for Nifty Bank is 550.71, which is above the MACD Signal of 530.78, indicating a bullish momentum. However, considering the negative % change and the RSI of 47.20, traders should be cautious of potential volatility.

RSI Analysis
The Relative Strength Index (RSI) for Nifty Bank is 47.2, indicating a neutral market condition. An RSI of 47.2 suggests that the stock is neither overbought nor oversold, providing no clear directional bias at the moment.

Analysis for Nifty 50 - April 07, 2025

Nifty 50 opened at 21,758 and closed at 22,161, witnessing a decline of -3.24% with a points change of -742.85 from the previous close of 22,904. The relative strength index (RSI) is at 33.73, indicating the index is nearing an oversold condition. The closing price is significantly below the 50-day and 200-day exponential moving averages, suggesting a bearish trend.

Relationship with Key Moving Averages
The current close of Nifty 50 at 22,161.60 is below its 10 EMA (23,020.13), 20 EMA (23,016.31), and 50 EMA (23,084.60), indicating a short-term bearish trend. The relative position below these key moving averages, along with a negative RSI of 33.73, suggests potential downward momentum.
Moving Averages Trend (MACD)
The MACD for Nifty 50 is currently at 26.25, which is below the MACD Signal line of 94.99. This suggests a bearish momentum, indicating that the recent trend might continue to remain weak or potentially decline further.

RSI Analysis
The RSI for Nifty 50 is 33.73, which suggests that it is nearing the oversold territory, typically below 30. This indicates potential undervaluation or selling pressure, and the index may be approaching a point of consolidation or reversal. Investors should be cautious and consider other indicators before making decisions.
