Global stock market indices: How the world markets performed today - 13 March 2025
The international stock market indices showed varied performances on March 13, 2025, reflecting the economic sentiment across different regions.
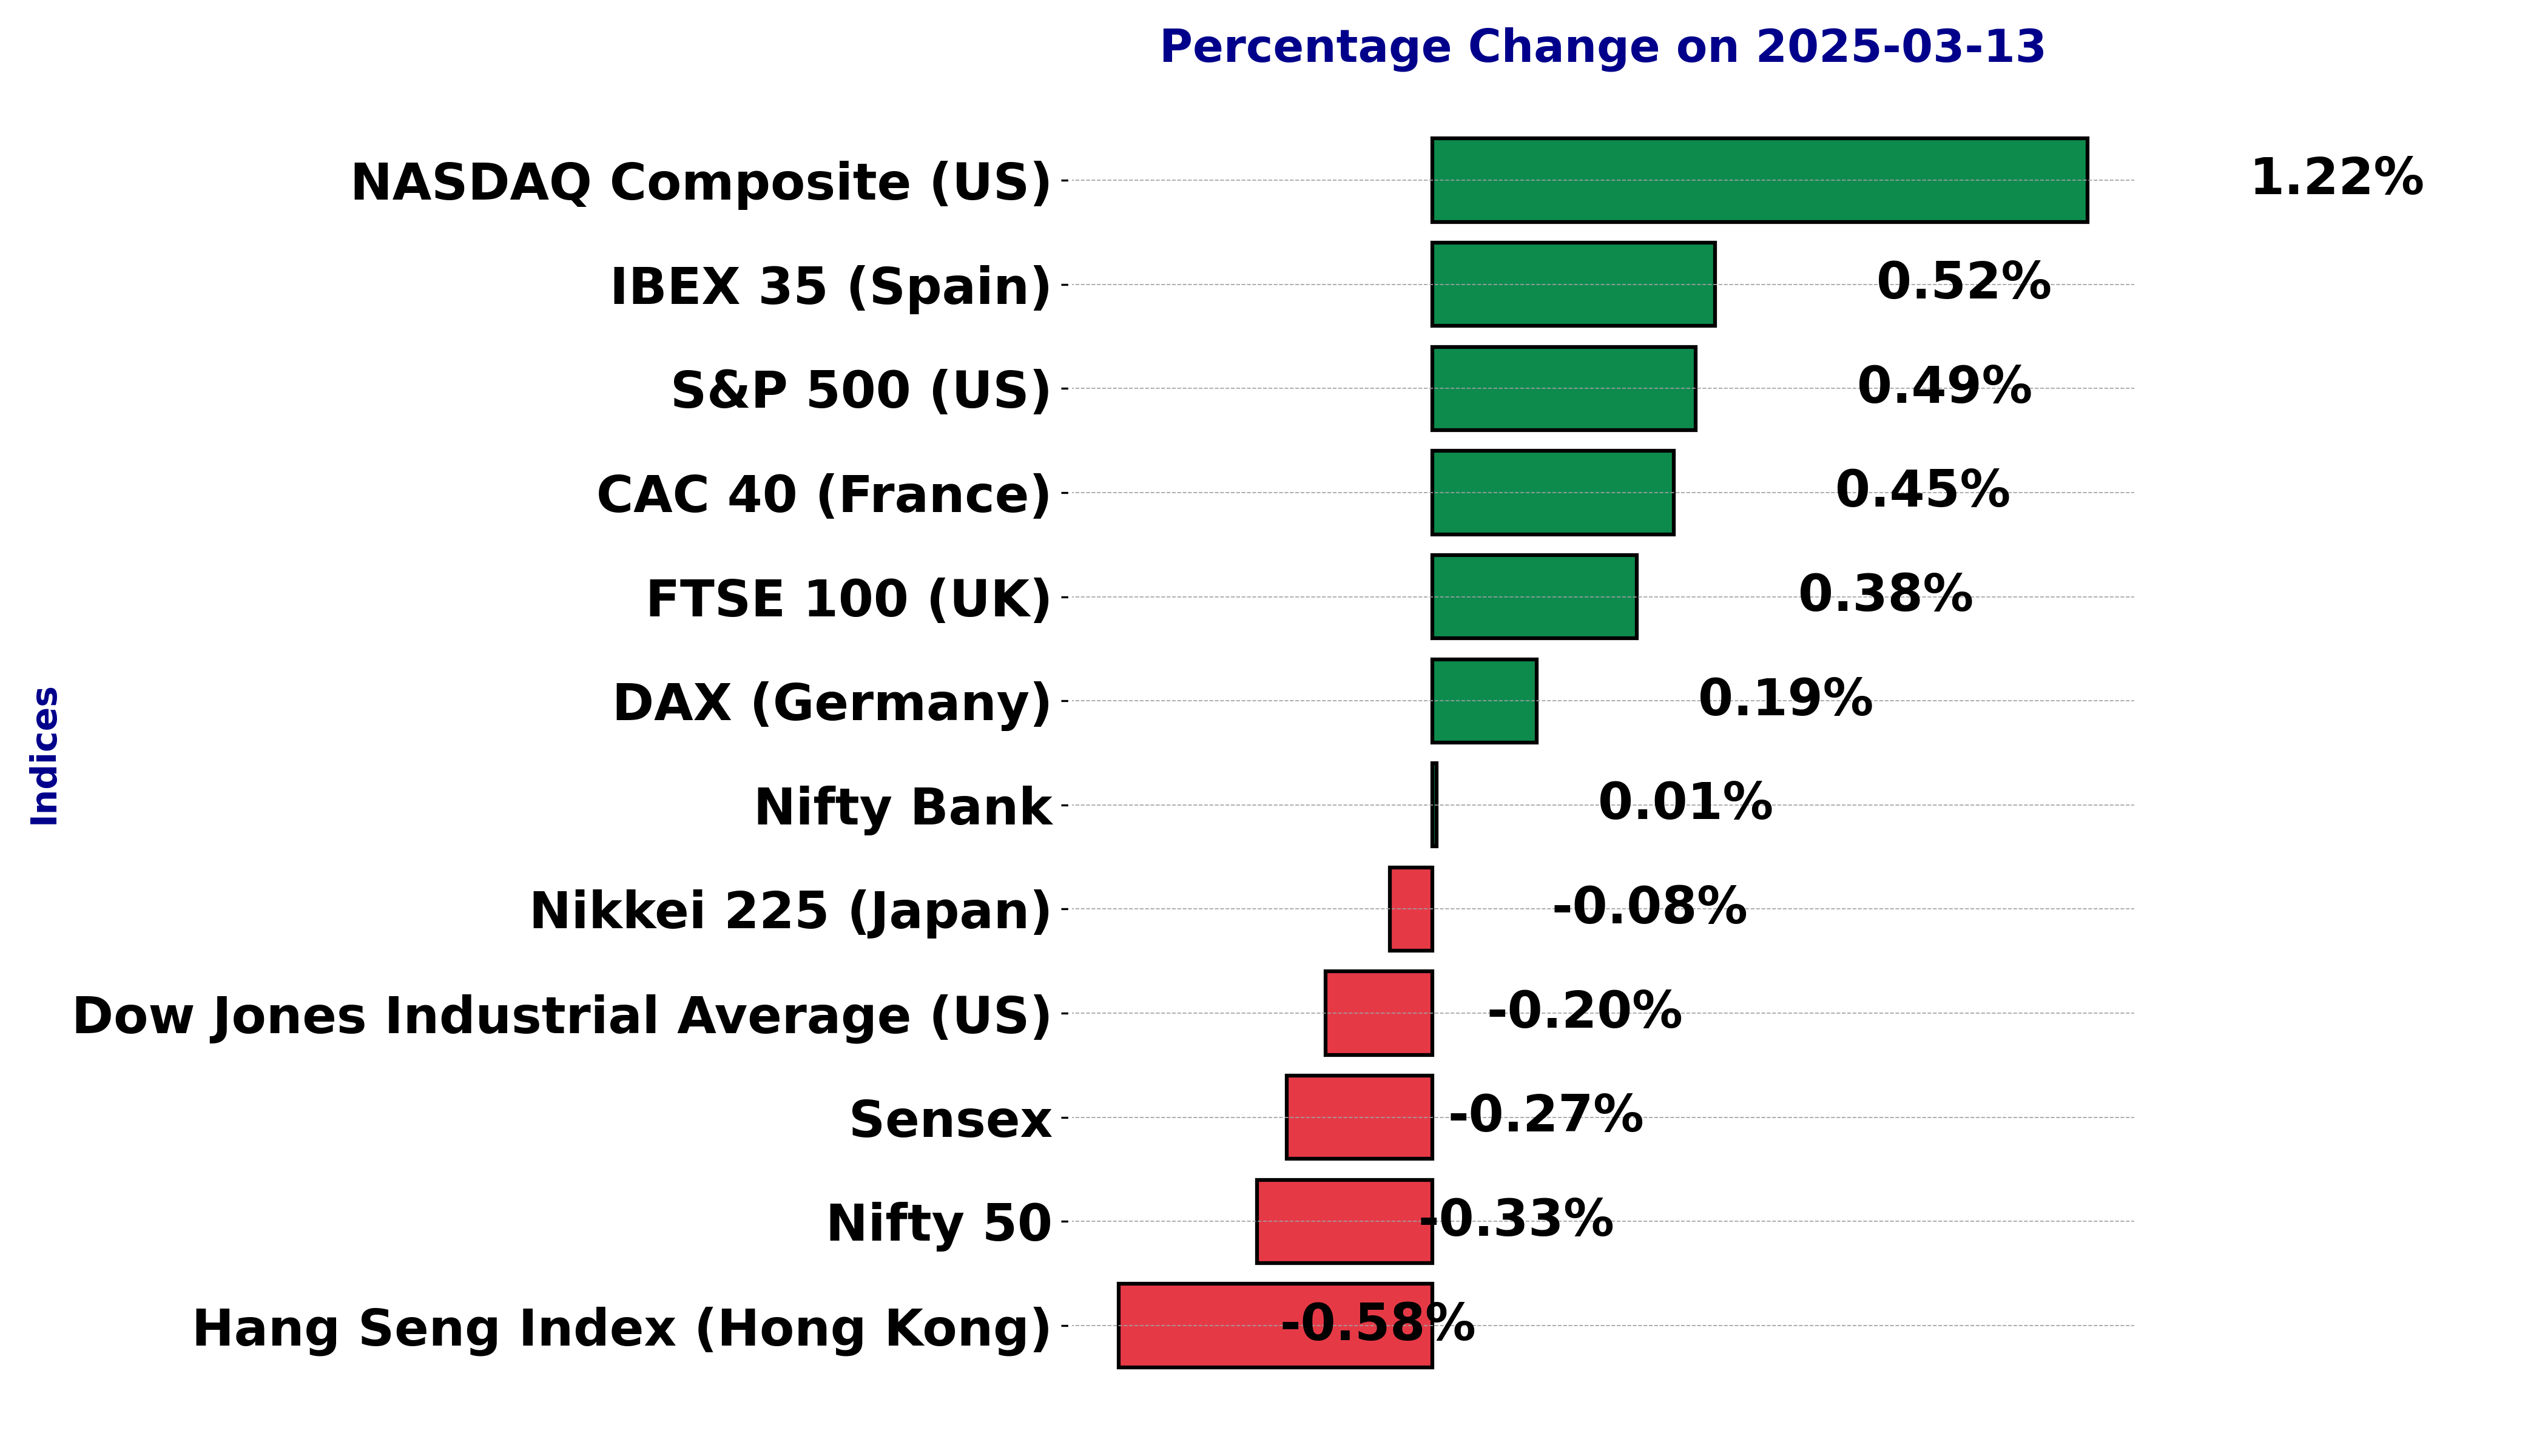
In this article, we analyze the performance of key global indices including the S&P 500, Dow Jones Industrial Average, NASDAQ Composite, FTSE 100, DAX, CAC 40, IBEX 35, Nikkei 225, Hang Seng, Nifty 50, and BSE Sensex.
Analysis for Sensex - March 13, 2025
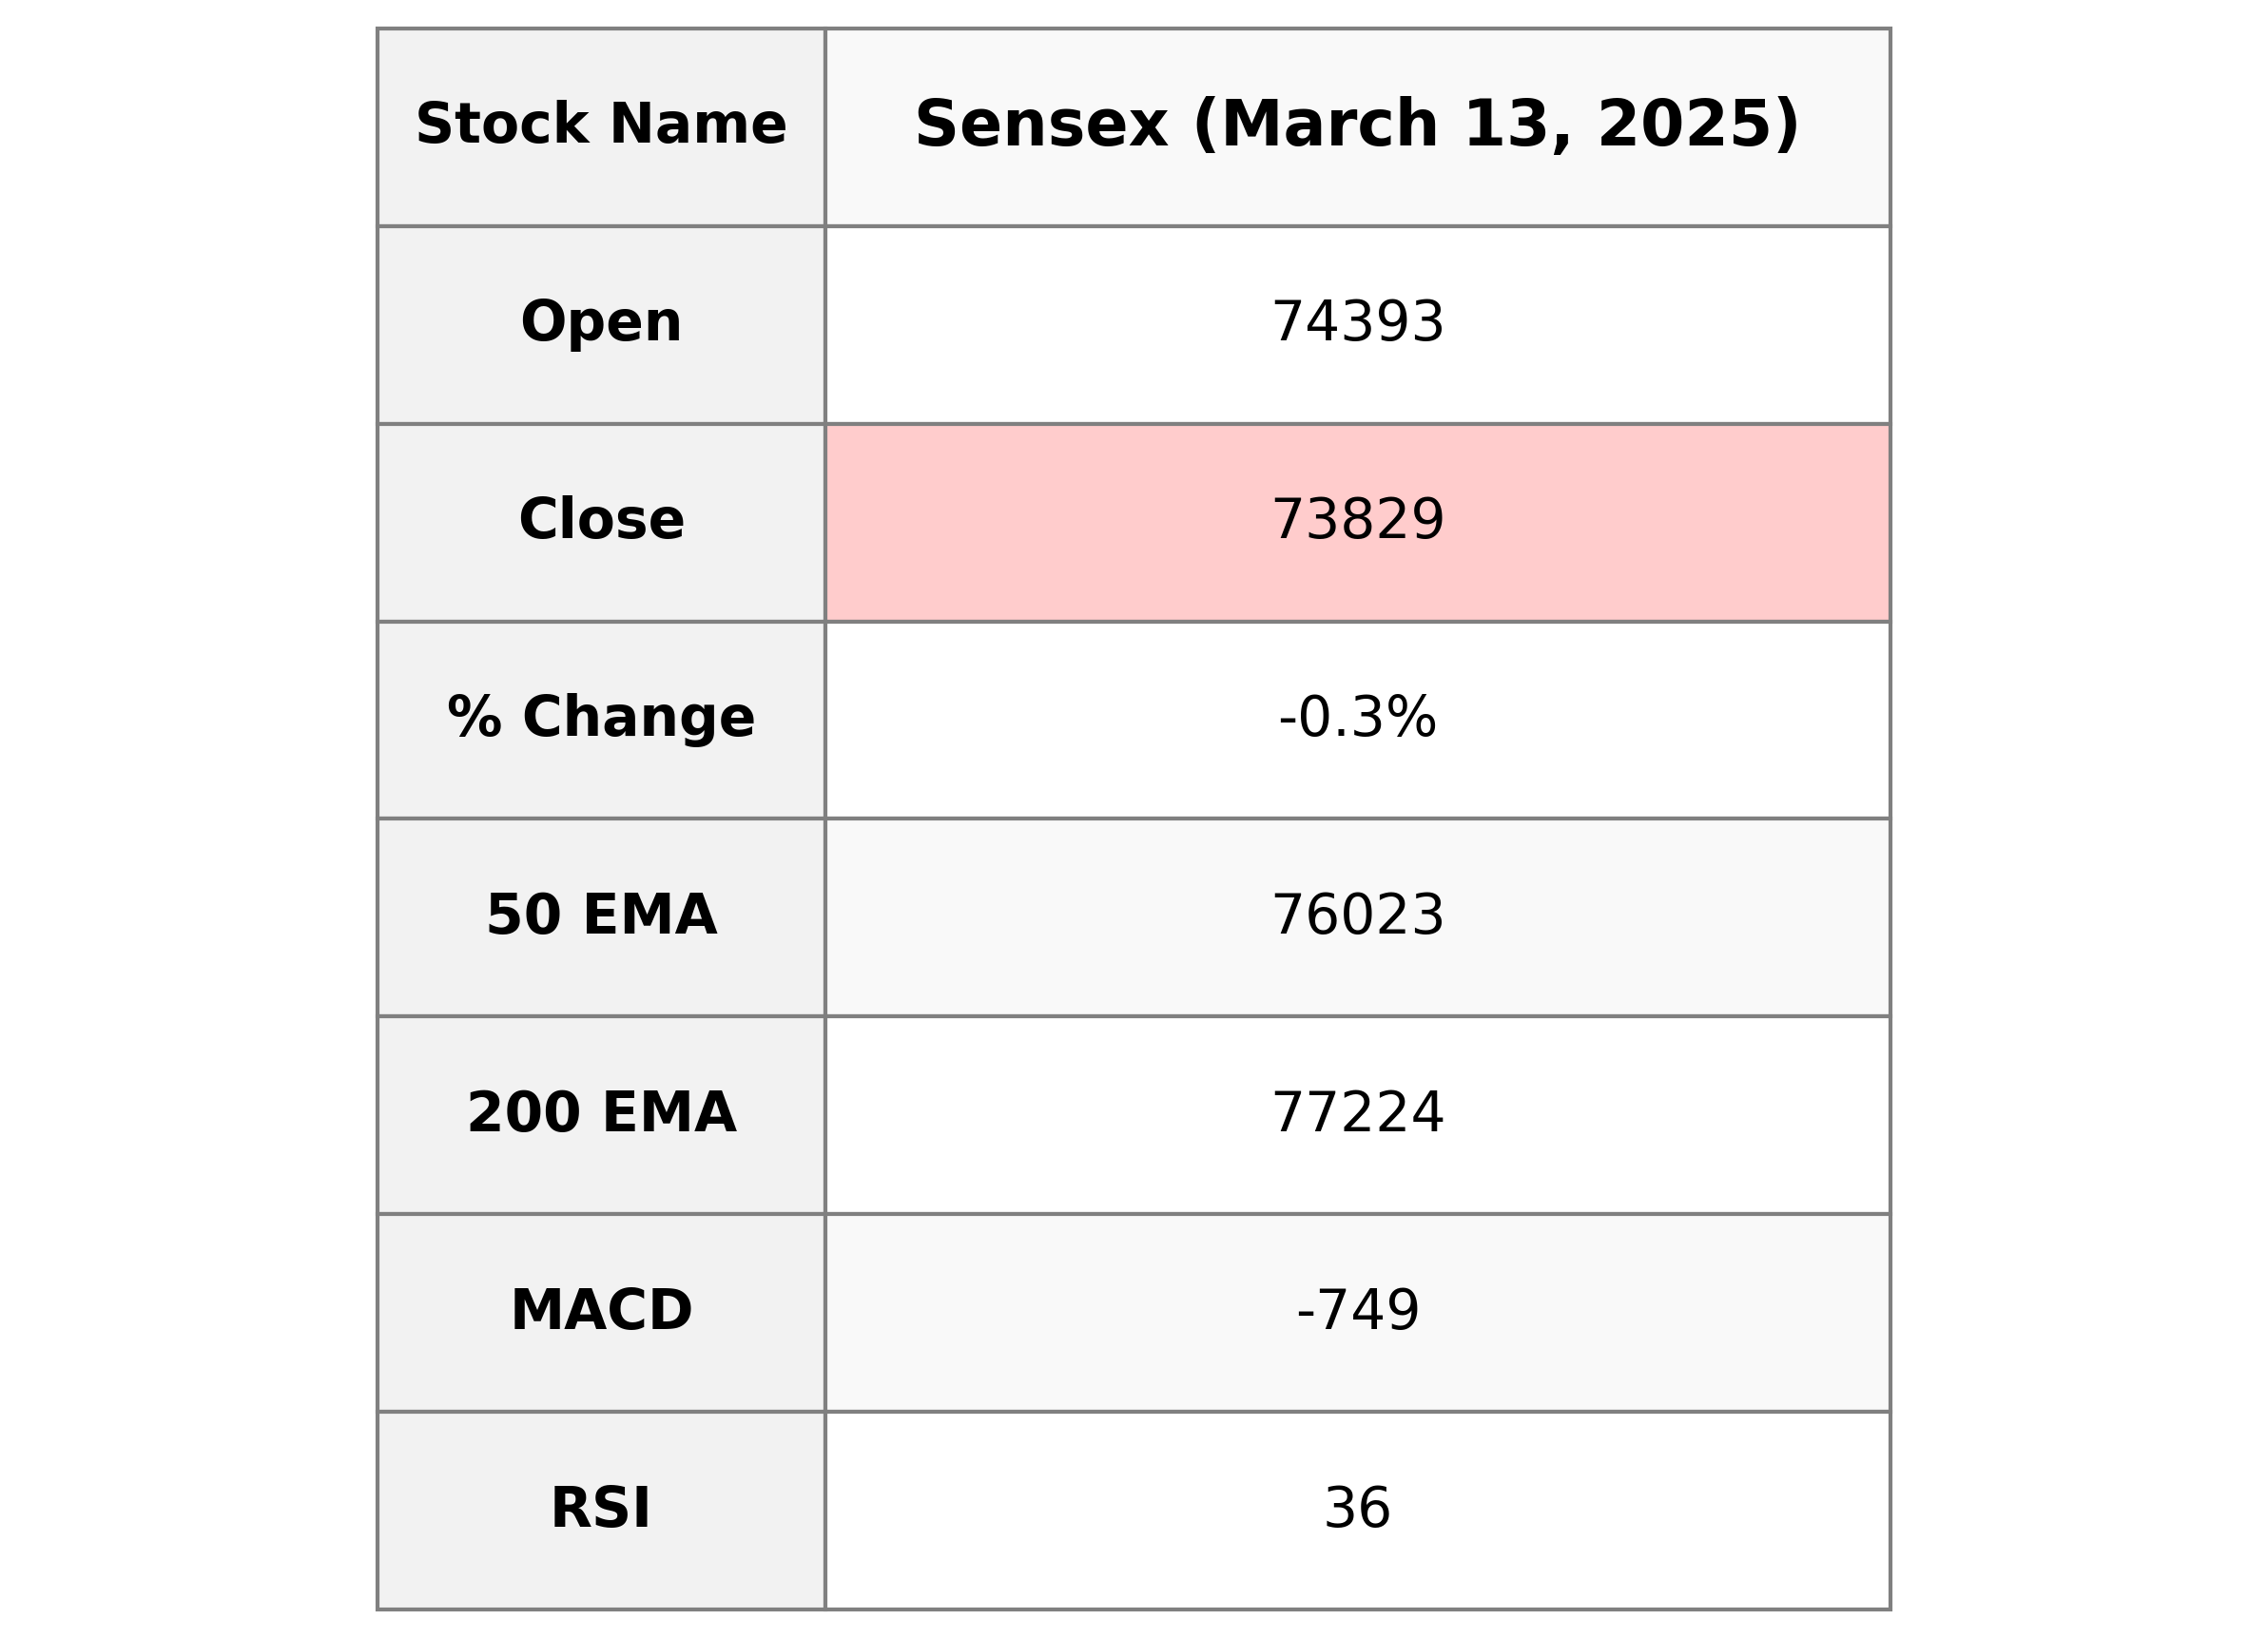
The Sensex opened at 74,392.54 and closed at 73,828.91, experiencing a decline of approximately 0.27%, equivalent to a points change of -200.85. The RSI value is 36.10, indicating potential oversold conditions, while the MACD shows a bearish trend compared to its signal line. The trading volume was notably low at 0.0.

Relationship with Key Moving Averages
The close price of Sensex (73828.91) is currently below the 10 EMA (74118.13), 20 EMA (74644.07), 50 EMA (76023.13), and 200 EMA (77224.35), indicating a bearish trend. The RSI value of 36.10 suggests that the index might be approaching the oversold territory.
Moving Averages Trend (MACD)
The MACD for Sensex is -748.52, indicating a bearish trend as it is below the signal line, which is -805.89. This suggests that the market momentum is weakening as the MACD line is above the signal line, showing potential for a further downtrend.

RSI Analysis
Based on the provided stock data for Sensex, the RSI is at 36.1, which suggests that the index might be approaching oversold conditions. Generally, an RSI below 30 indicates that the stock could be undervalued or oversold, while an RSI above 70 indicates overbought conditions. The current RSI suggests caution, as the index is nearing oversold territory but is not quite there yet.

Analysis for Dow Jones Industrial Average (US) - March 13, 2025

The Dow Jones Industrial Average (US) opened at 41,577.5 and closed at 41,350.93, reflecting a decrease of 0.20% or a drop of 82.55 points. The index experienced a high of 41,721.36 and a low of 41,010.24, with a significant trading volume of 712,360,000. The RSI indicates oversold conditions at 29.93.

Relationship with Key Moving Averages
The Dow Jones Industrial Average is currently trading below its key moving averages, with the most significant gap between the 50-day EMA at 43416.15 and its closing price of 41350.93, indicating a bearish trend. Additionally, the 20-day and 10-day EMAs are also above the current closing price, suggesting downward momentum in the short to medium term.
Moving Averages Trend (MACD)
The Dow Jones Industrial Average shows a bearish signal as the MACD value of -600.9671 is below the MACD Signal value of -351.3673. This suggests downward momentum in the index. Additionally, the RSI value of 29.93 indicates that the market might be oversold.

RSI Analysis
The RSI for the Dow Jones Industrial Average is 29.93, which suggests that the market is nearing oversold conditions. An RSI below 30 typically indicates that the market could be undervalued, presenting potential buying opportunities if other indicators align.

Analysis for CAC 40 (France) - March 13, 2025

CAC 40 (France) Performance: On the latest trading day, the index opened at 7983.57 and closed higher at 8024.79, marking a percentage change of 0.45% with a points increase of 35.83. Despite a lack of trading volume data, the index's RSI is at 49.56, indicating a neutral momentum, while its MACD is below the MACD Signal, suggesting a slight bearish trend.

Relationship with Key Moving Averages
CAC 40 (France) is trading above its 50 EMA, indicating short-term bullish momentum, but it is below both the 10 EMA and 20 EMA, suggesting potential short-term weakness. The index is significantly above the 200 EMA, highlighting a longer-term uptrend.
Moving Averages Trend (MACD)
The CAC 40 (France) closed higher, with a MACD of 28.65 which is below its MACD Signal line of 62.21, indicating a bearish signal in the short term. Despite this bearish divergence, the index experienced a modest increase of 0.45%, showing resilience in current market conditions.

RSI Analysis
The RSI value for the CAC 40 is 49.56, indicating a neutral momentum state, as it sits close to the midpoint of the typical RSI range. This suggests that the index is neither overbought nor oversold at the moment, showing a balanced market sentiment.

Analysis for FTSE 100 (UK) - March 13, 2025

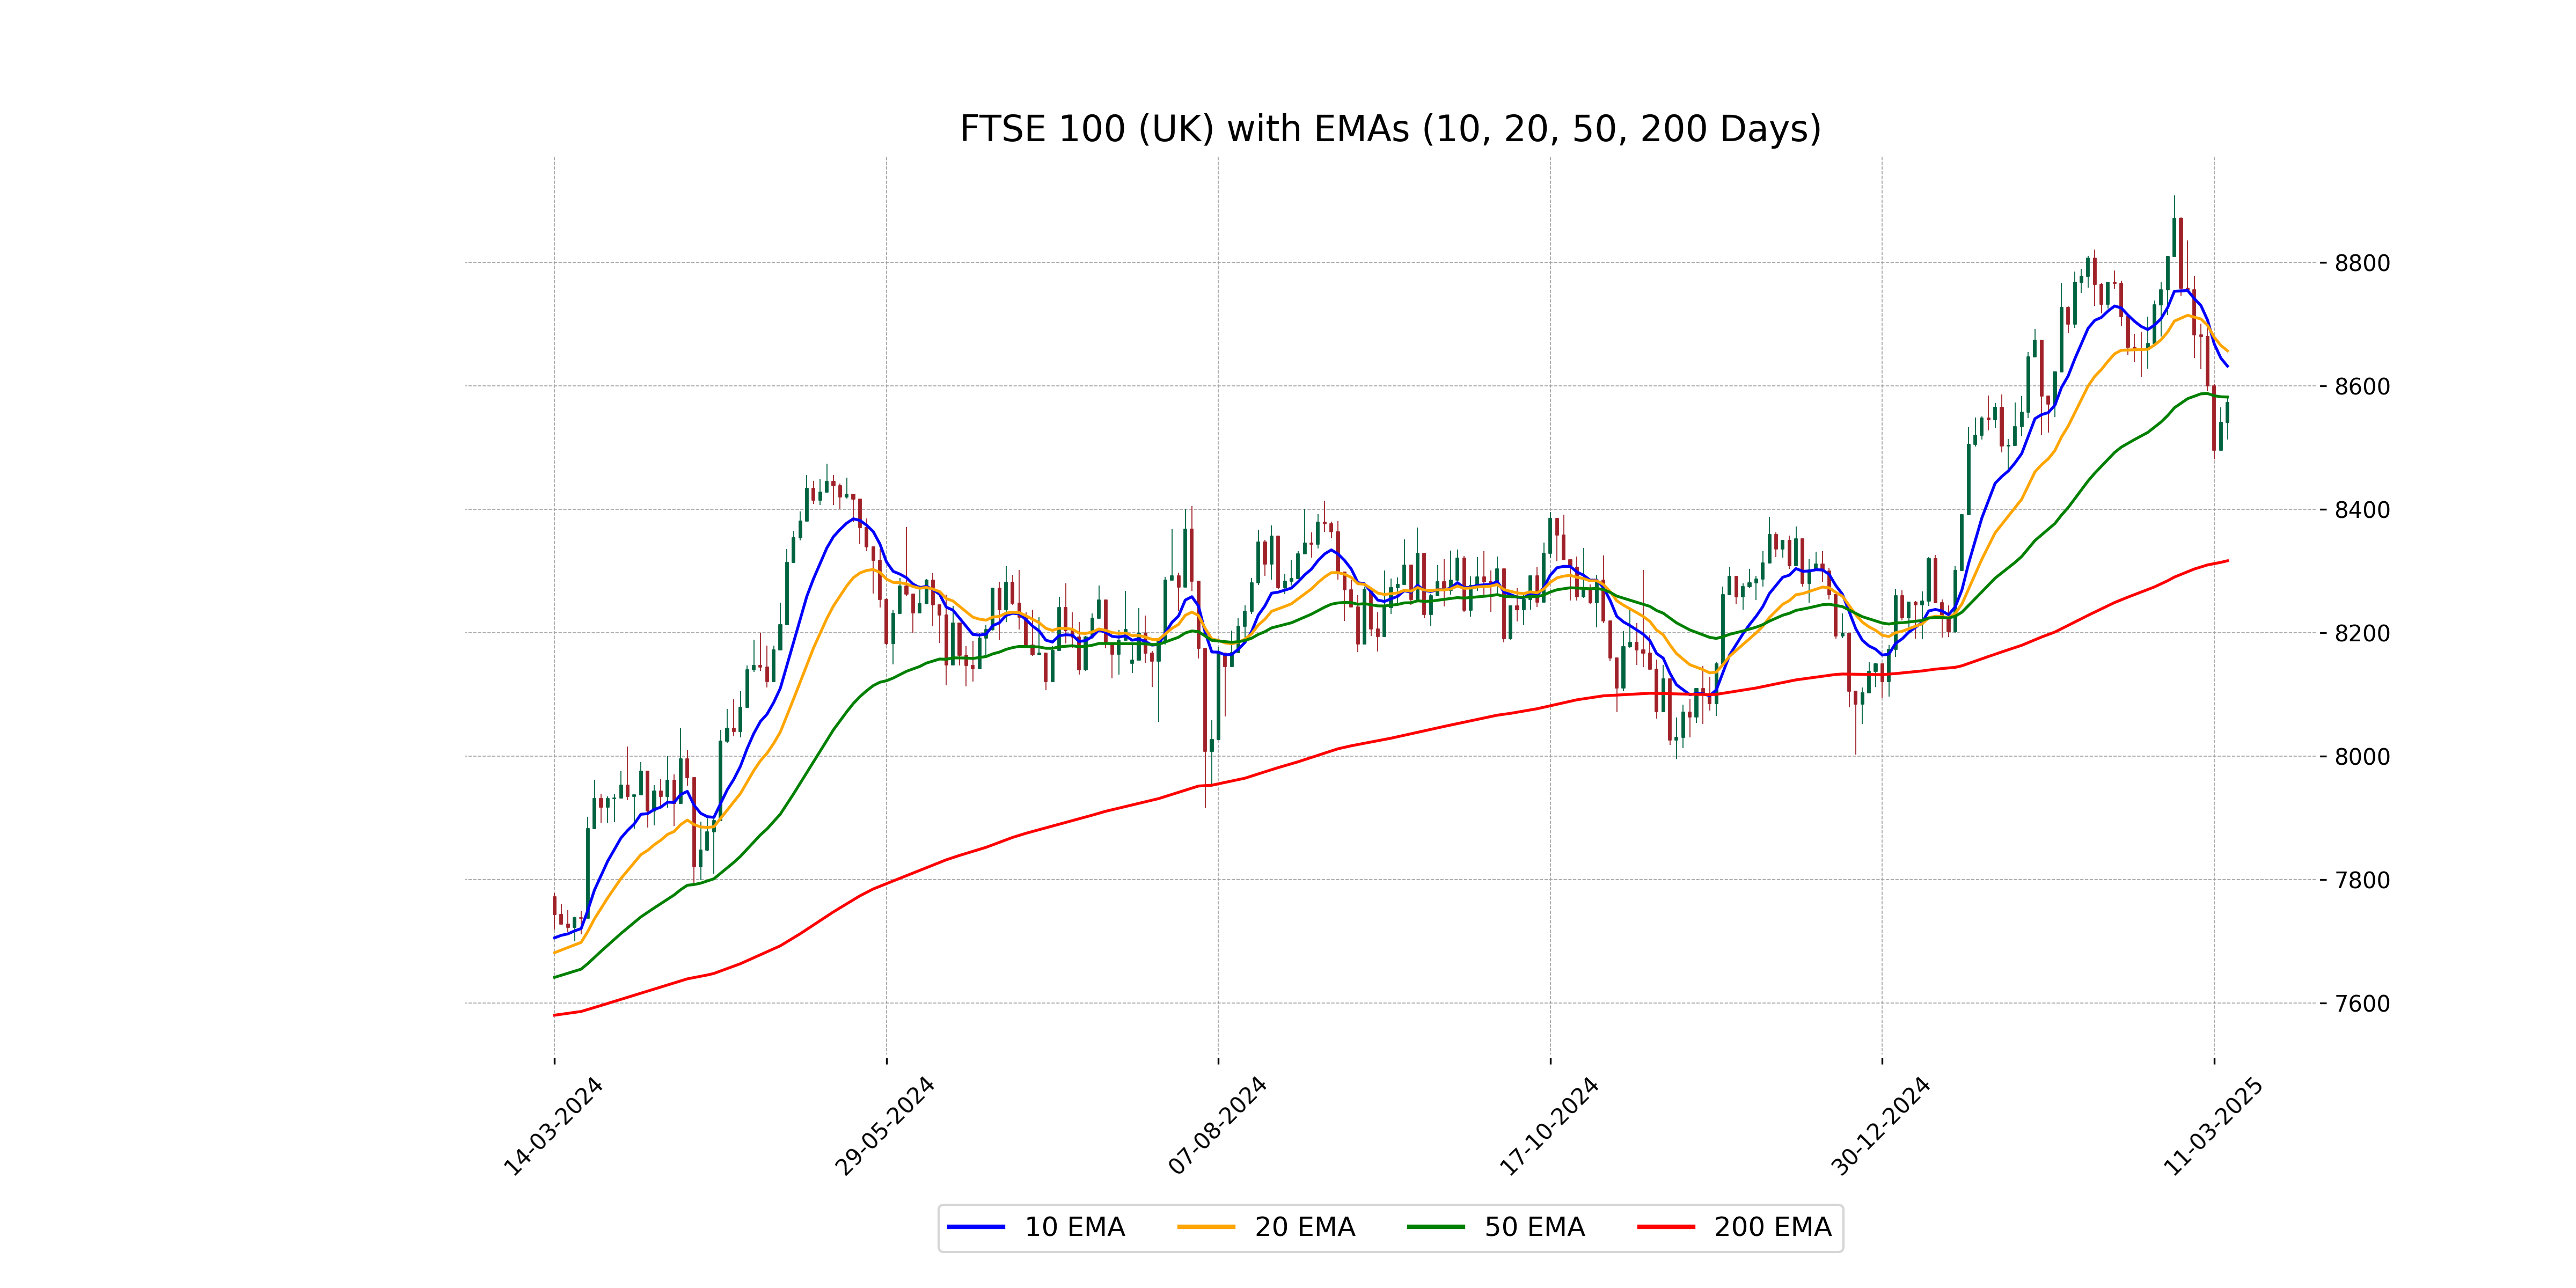
FTSE 100 (UK) opened at 8540.97 and closed slightly higher at 8573.47, marking a 0.38% increase from the previous close. Despite this gain, the index remains below its 10-day and 20-day EMAs, hinting at possible short-term weakness. The RSI value of 43.78 suggests the index is neither overbought nor oversold.
Relationship with Key Moving Averages
The FTSE 100 closed below both its 10-day EMA (8632.24) and 50-day EMA (8582.20), indicating a bearish momentum in the shorter term. However, it remains above its 200-day EMA (8316.72), suggesting a long-term uptrend is still intact.
Moving Averages Trend (MACD)
MACD Analysis for FTSE 100 (UK): The MACD value of -6.929 indicates a bearish momentum, as it is below the MACD Signal value of 28.3447. This suggests a potential downtrend or consolidation phase, with further monitoring needed for trend confirmation.

RSI Analysis
FTSE 100's Relative Strength Index (RSI) is at 43.78, indicating that the index is approaching the oversold territory but is currently in a neutral zone. An RSI below 30 generally suggests that the asset is oversold, while an RSI above 70 indicates it might be overbought. Therefore, the current RSI suggests a balanced market condition with a potential for future buy opportunities if the RSI decreases further.

Analysis for DAX (Germany) - March 13, 2025

The DAX opened at 22,578.10 and closed higher at 22,720.45, with a net gain of 44.04 points and a percentage change of approximately 0.19%. The index showed a moderate RSI of 54.49, indicating a neutral momentum, while the MACD value of 266.08 suggests that the market has potential bullish tendencies. The trading volume was zero, and no data was available for market capitalization, PE ratio, EPS, sector, industry, or country.

Relationship with Key Moving Averages
The DAX (Germany) closed at 22,720.45, which is above its 10-day, 20-day, and 50-day EMAs, indicating a recent bullish trend. However, it still remains significantly higher than its 200-day EMA, suggesting strong long-term performance.
Moving Averages Trend (MACD)
MACD Analysis for DAX (Germany): The MACD value for DAX is 266.08, which is below the MACD signal line of 340.95. This suggests a potential bearish momentum, indicating that the stock may be experiencing some downward pressure. However, it's important to observe if the MACD and signal line converge or diverge for future trend predictions.

RSI Analysis
RSI Analysis for DAX (Germany): The Relative Strength Index (RSI) for DAX is 54.49, indicating a neutral strength where it is not currently overbought or oversold. The RSI value suggests moderate momentum and does not signal any immediate divergent movements or trend reversals.

Analysis for S&P 500 (US) - March 13, 2025

The S&P 500 (US) opened at 5624.84 and closed at 5599.30, experiencing a slight increase with a 0.49% change or 27.23 points rise from the previous close. The index had a trading range with a high of 5642.19 and a low of 5546.09. Key technical indicators show an RSI of 30.85, suggesting potential oversold conditions, with a negative MACD, indicating bearish momentum.

Relationship with Key Moving Averages
The S&P 500 is trading below its 50-day, 200-day, 10-day, and 20-day Exponential Moving Averages, indicating a potential bearish momentum. The low RSI of 30.85 suggests the index may be oversold. The negative MACD value also reinforces the bearish sentiment.
Moving Averages Trend (MACD)
The MACD for the S&P 500 is -105.34, which is below its signal line of -63.95. This indicates a potential bearish signal, suggesting that the downward momentum might continue.

RSI Analysis
RSI Analysis for S&P 500 (US): The RSI value of 30.85 suggests that the index is approaching oversold territory. This may indicate potential upward pressure if buying interest increases at these levels.

Analysis for Hang Seng Index (Hong Kong) - March 13, 2025
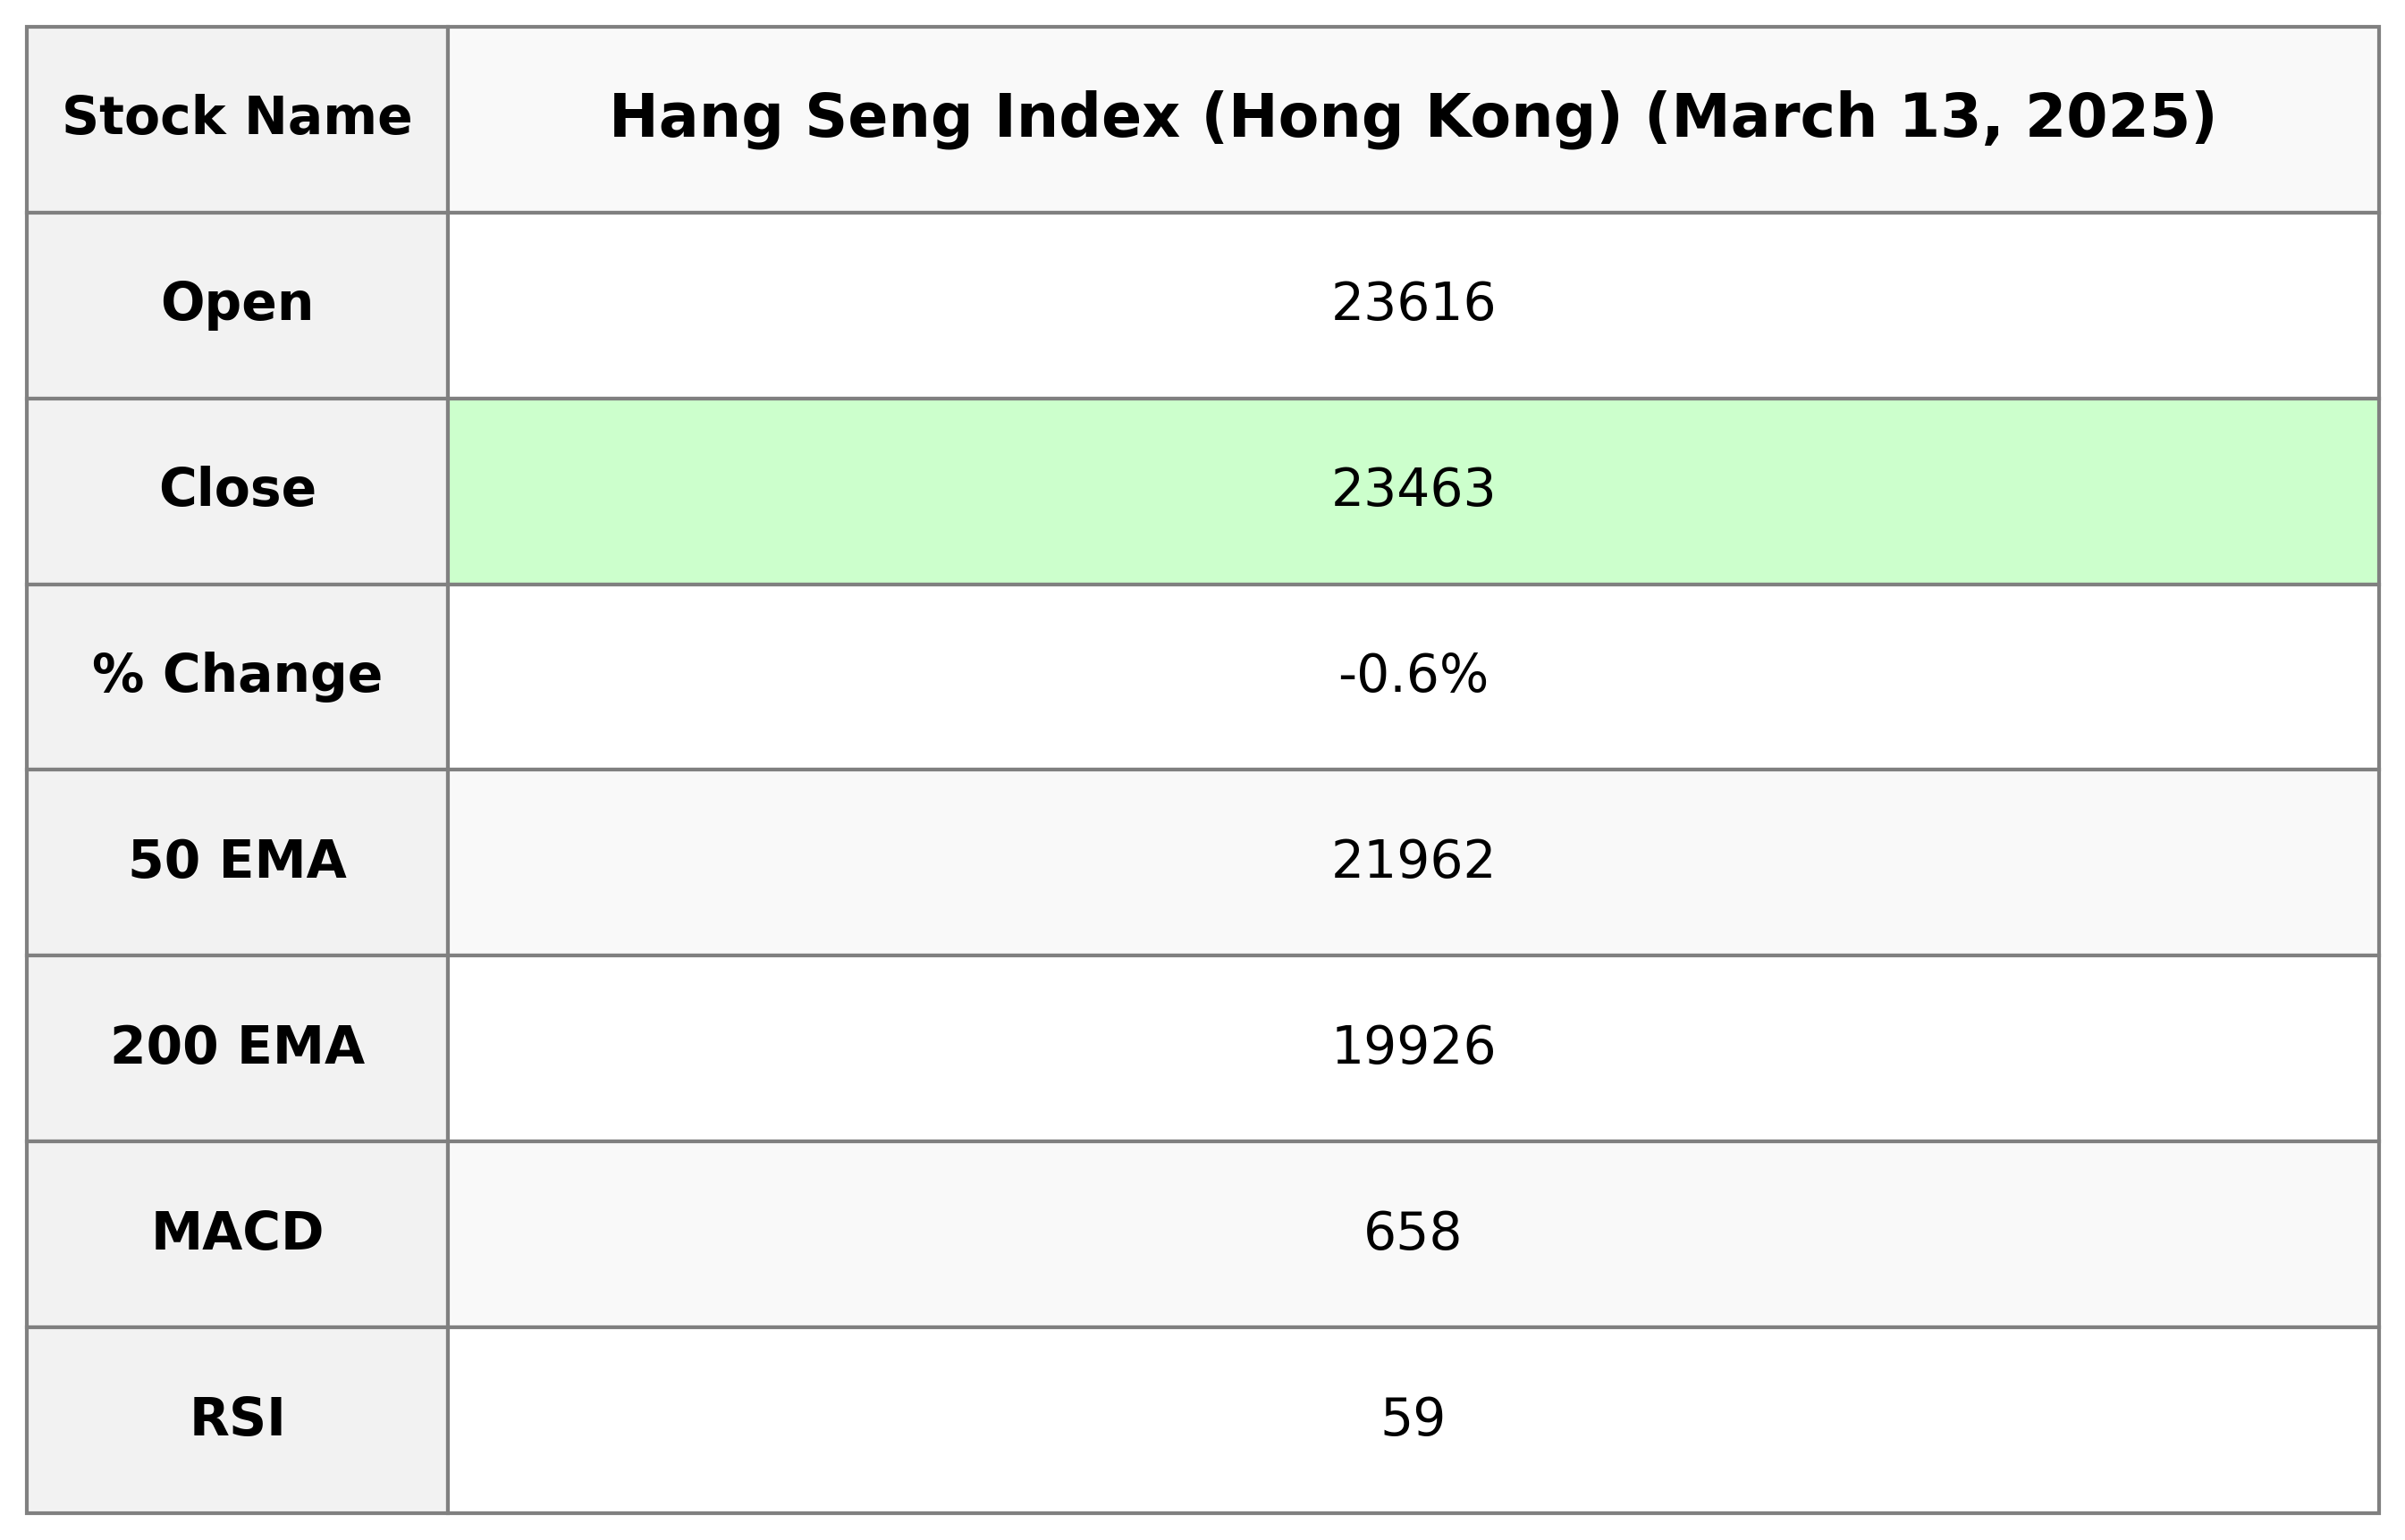
Hang Seng Index (Hong Kong) opened at 23,616.33 and closed at 23,462.65, resulting in a decrease of 0.58% with a points change of -137.66. The index experienced a high of 23,712.61 and a low of 23,198.73. The current RSI is 58.53, suggesting moderate momentum, while the MACD indicates a bearish signal as it is below the MACD Signal.

Relationship with Key Moving Averages
The Hang Seng Index is trading below its 10-day EMA and slightly above its 50-day and 200-day EMAs, indicating a short-term bearish trend but a longer-term bullish outlook. The RSI of 58.53 suggests it's in a moderate position without being overbought or oversold.
Moving Averages Trend (MACD)
The MACD for the Hang Seng Index (Hong Kong) is currently at 658.05, which is below the MACD Signal line at 748.32. This indicates a potential bearish momentum as the MACD is trending below its signal line.

RSI Analysis
Hang Seng Index (Hong Kong) RSI Analysis: The Relative Strength Index (RSI) for the Hang Seng Index is currently at 58.53, indicating a neutral trend. This value, being below 70, suggests that the index is neither overbought nor oversold.

Analysis for IBEX 35 (Spain) - March 13, 2025
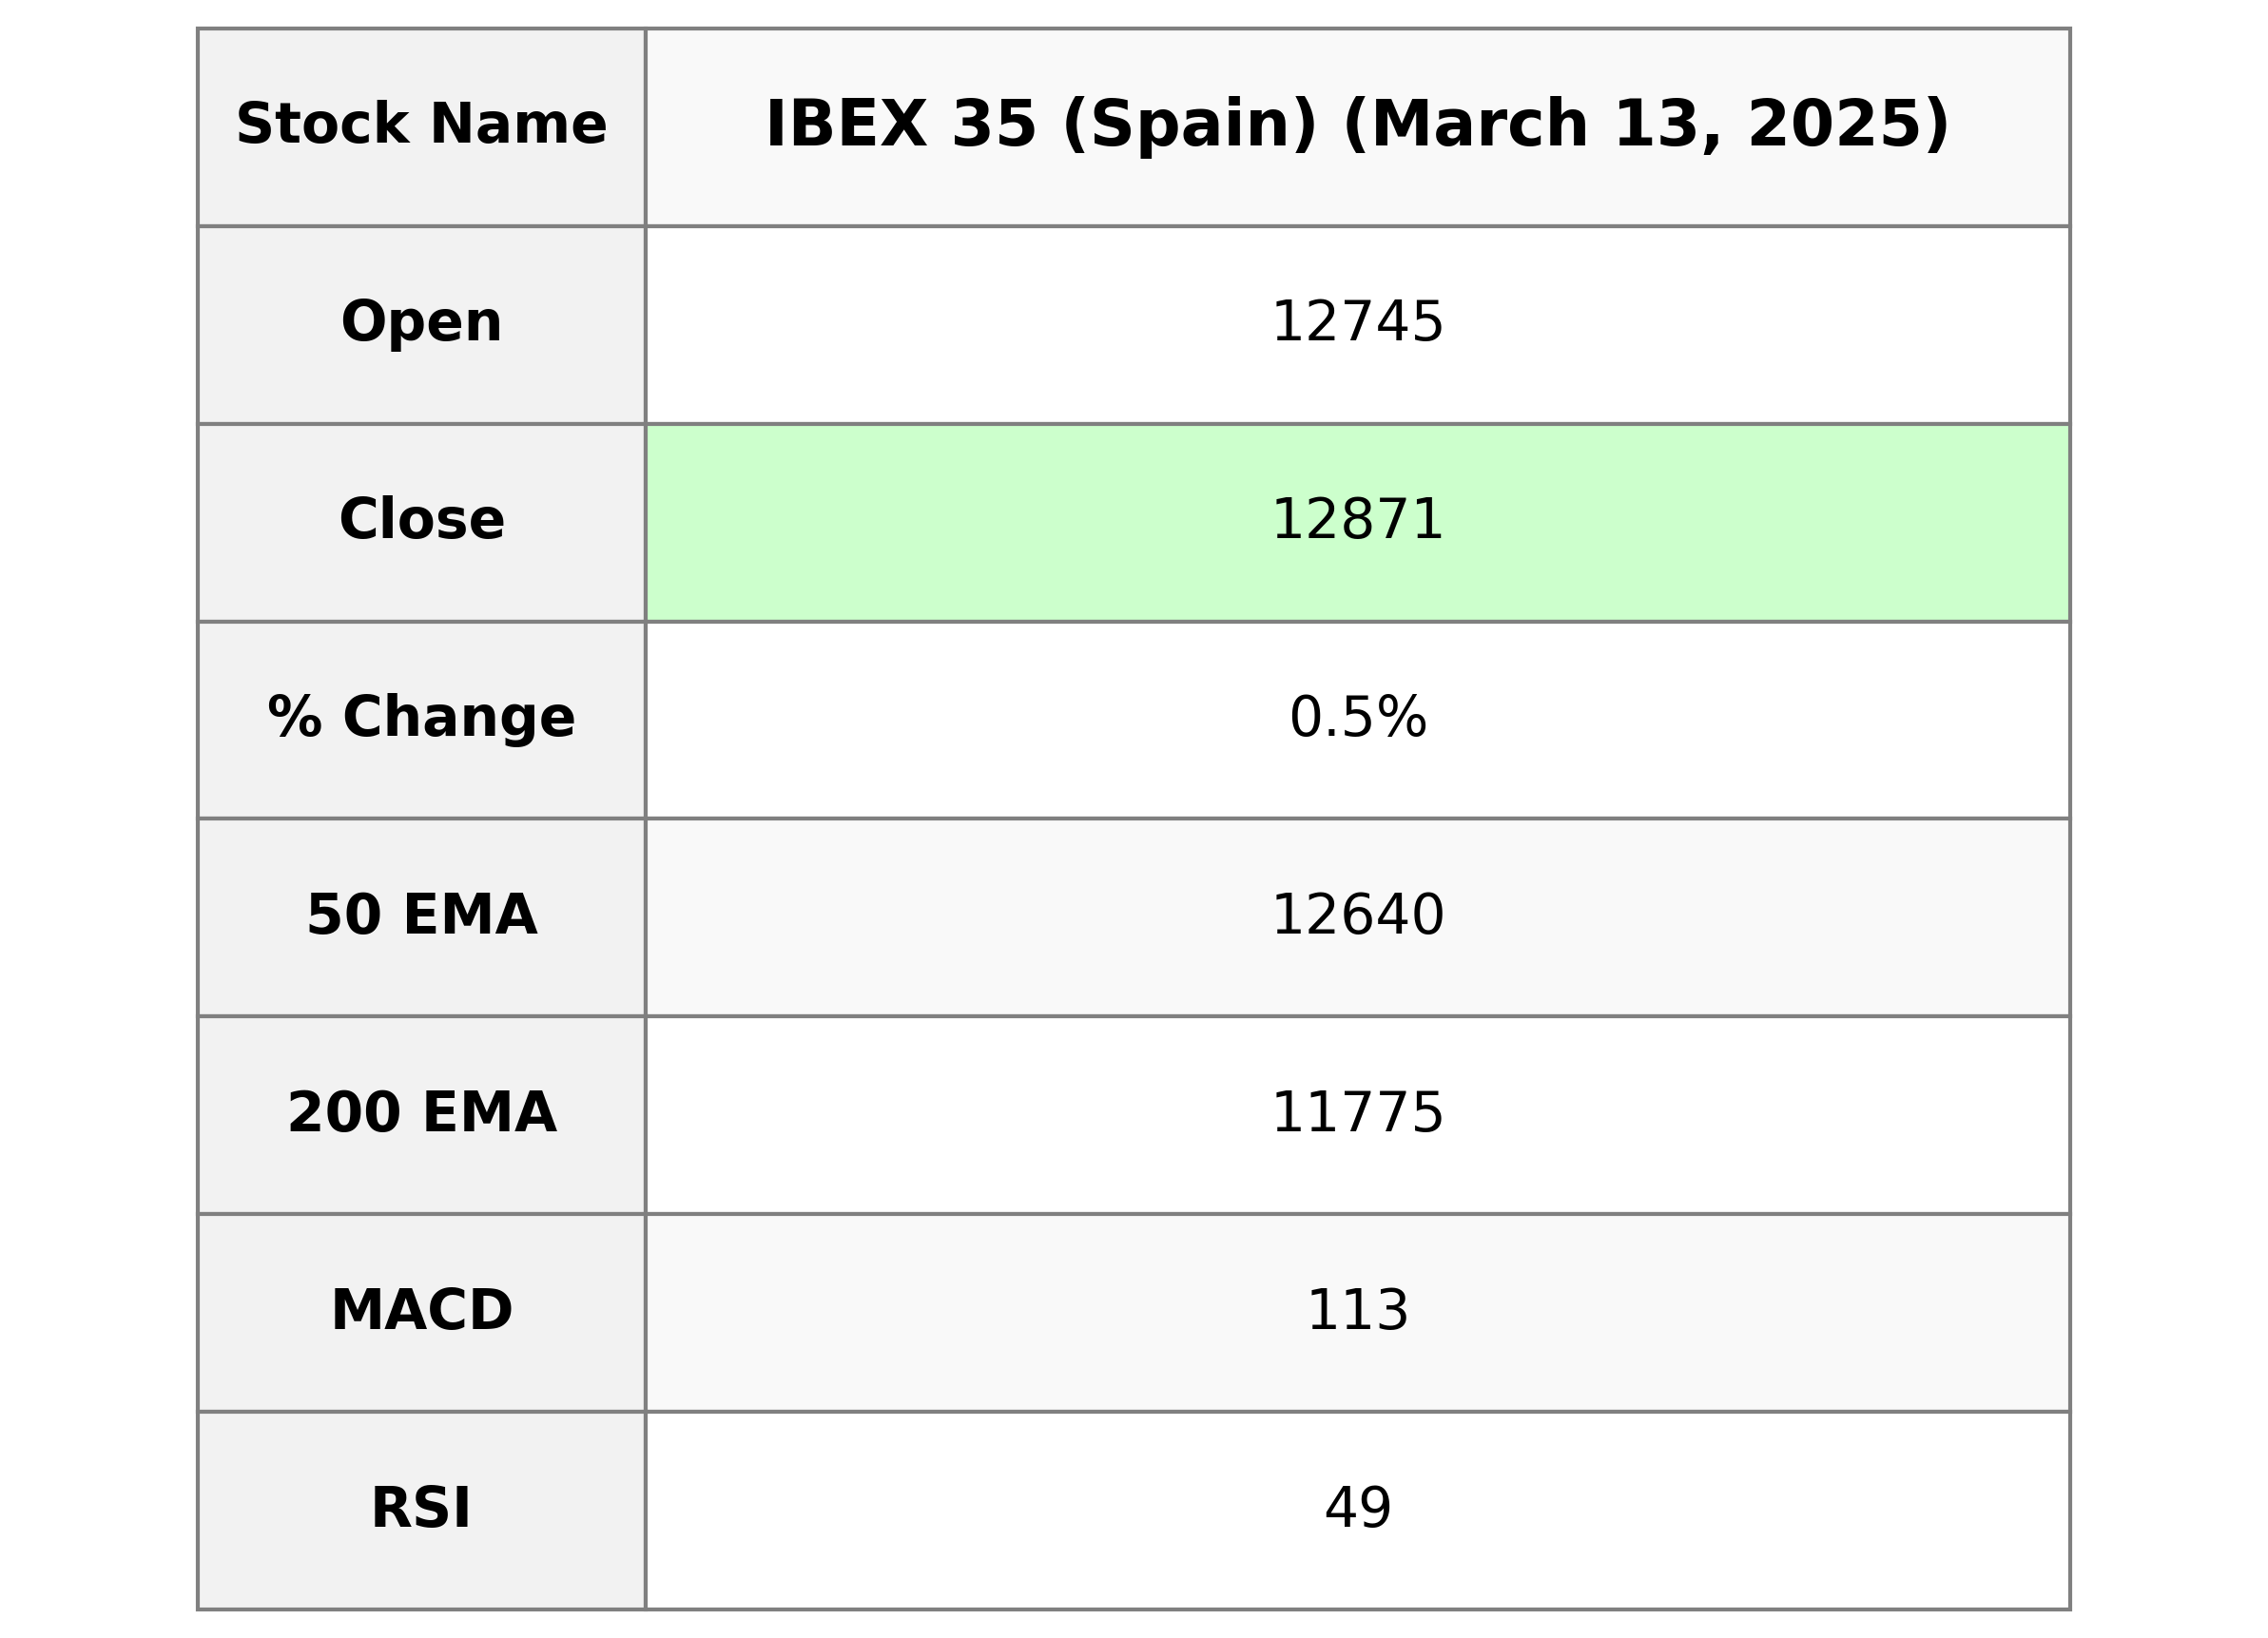
The IBEX 35 index opened at 12,745.20 and closed higher at 12,871.20, marking a daily gain of 67.20 points or 0.52%. The index's price movement had a high of 12,894.70 and a low of 12,729.00. The RSI stands at 48.79, suggesting the market is near the lower end of a neutral trend.

Relationship with Key Moving Averages
The IBEX 35 index closed at 12871.2, which is above its 50-day EMA of 12640.41 and significantly above its 200-day EMA of 11775.46, indicating a potential short to medium-term bullish trend. However, it remains below the 10-day EMA of 13022.85 and 20-day EMA of 12983.29, suggesting recent downward pressure.
Moving Averages Trend (MACD)
The MACD for IBEX 35 shows a value of 112.70, while the MACD Signal is higher at 195.09. This indicates a potential bearish trend, as the MACD line is below the signal line, suggesting weakening momentum.

RSI Analysis
The RSI (Relative Strength Index) for IBEX 35 is approximately 48.79, indicating a neutral momentum. This value suggests that the index is neither overbought nor oversold, implying potential stability in market sentiment without a clear trend direction.

Analysis for NASDAQ Composite (US) - March 13, 2025

The NASDAQ Composite had a positive session with a 1.22% increase, closing at 17,648.45. The index saw fluctuations with a high of 17,800.10 and a low of 17,436.27. Despite this rise, technical indicators like the RSI at 31.99 suggest bearish momentum, and the MACD indicates a negative trend.

Relationship with Key Moving Averages
Based on the provided data for NASDAQ Composite, the closing price of 17,648.45 is below all the key moving averages: the 50 EMA at 19,053.85, the 20 EMA at 18,600.46, the 10 EMA at 18,129.18, and the 200 EMA at 18,300.83. This indicates a bearish trend as the current price is below these significant averages.
Moving Averages Trend (MACD)
NASDAQ Composite (US) MACD Analysis: The MACD for NASDAQ Composite is currently negative at -520.63, indicating bearish momentum. It is below the MACD Signal line of -361.40, suggesting a continuing downtrend.

RSI Analysis
The RSI for NASDAQ Composite is 31.99, indicating that the index is approaching oversold conditions. This suggests potential buying opportunities might be on the horizon if the RSI dips below 30. However, it's important to consider other indicators and market conditions before making investment decisions.

Analysis for Nikkei 225 (Japan) - March 13, 2025

Nikkei 225 (Japan) opened at 37,081.64 and closed at 36,790.03, marking a slight decrease of -0.08% with a points change of -29.06. The RSI value of 34.53 suggests the index is approaching oversold territory, and the MACD indicates a bearish trend with the current value below the signal line.
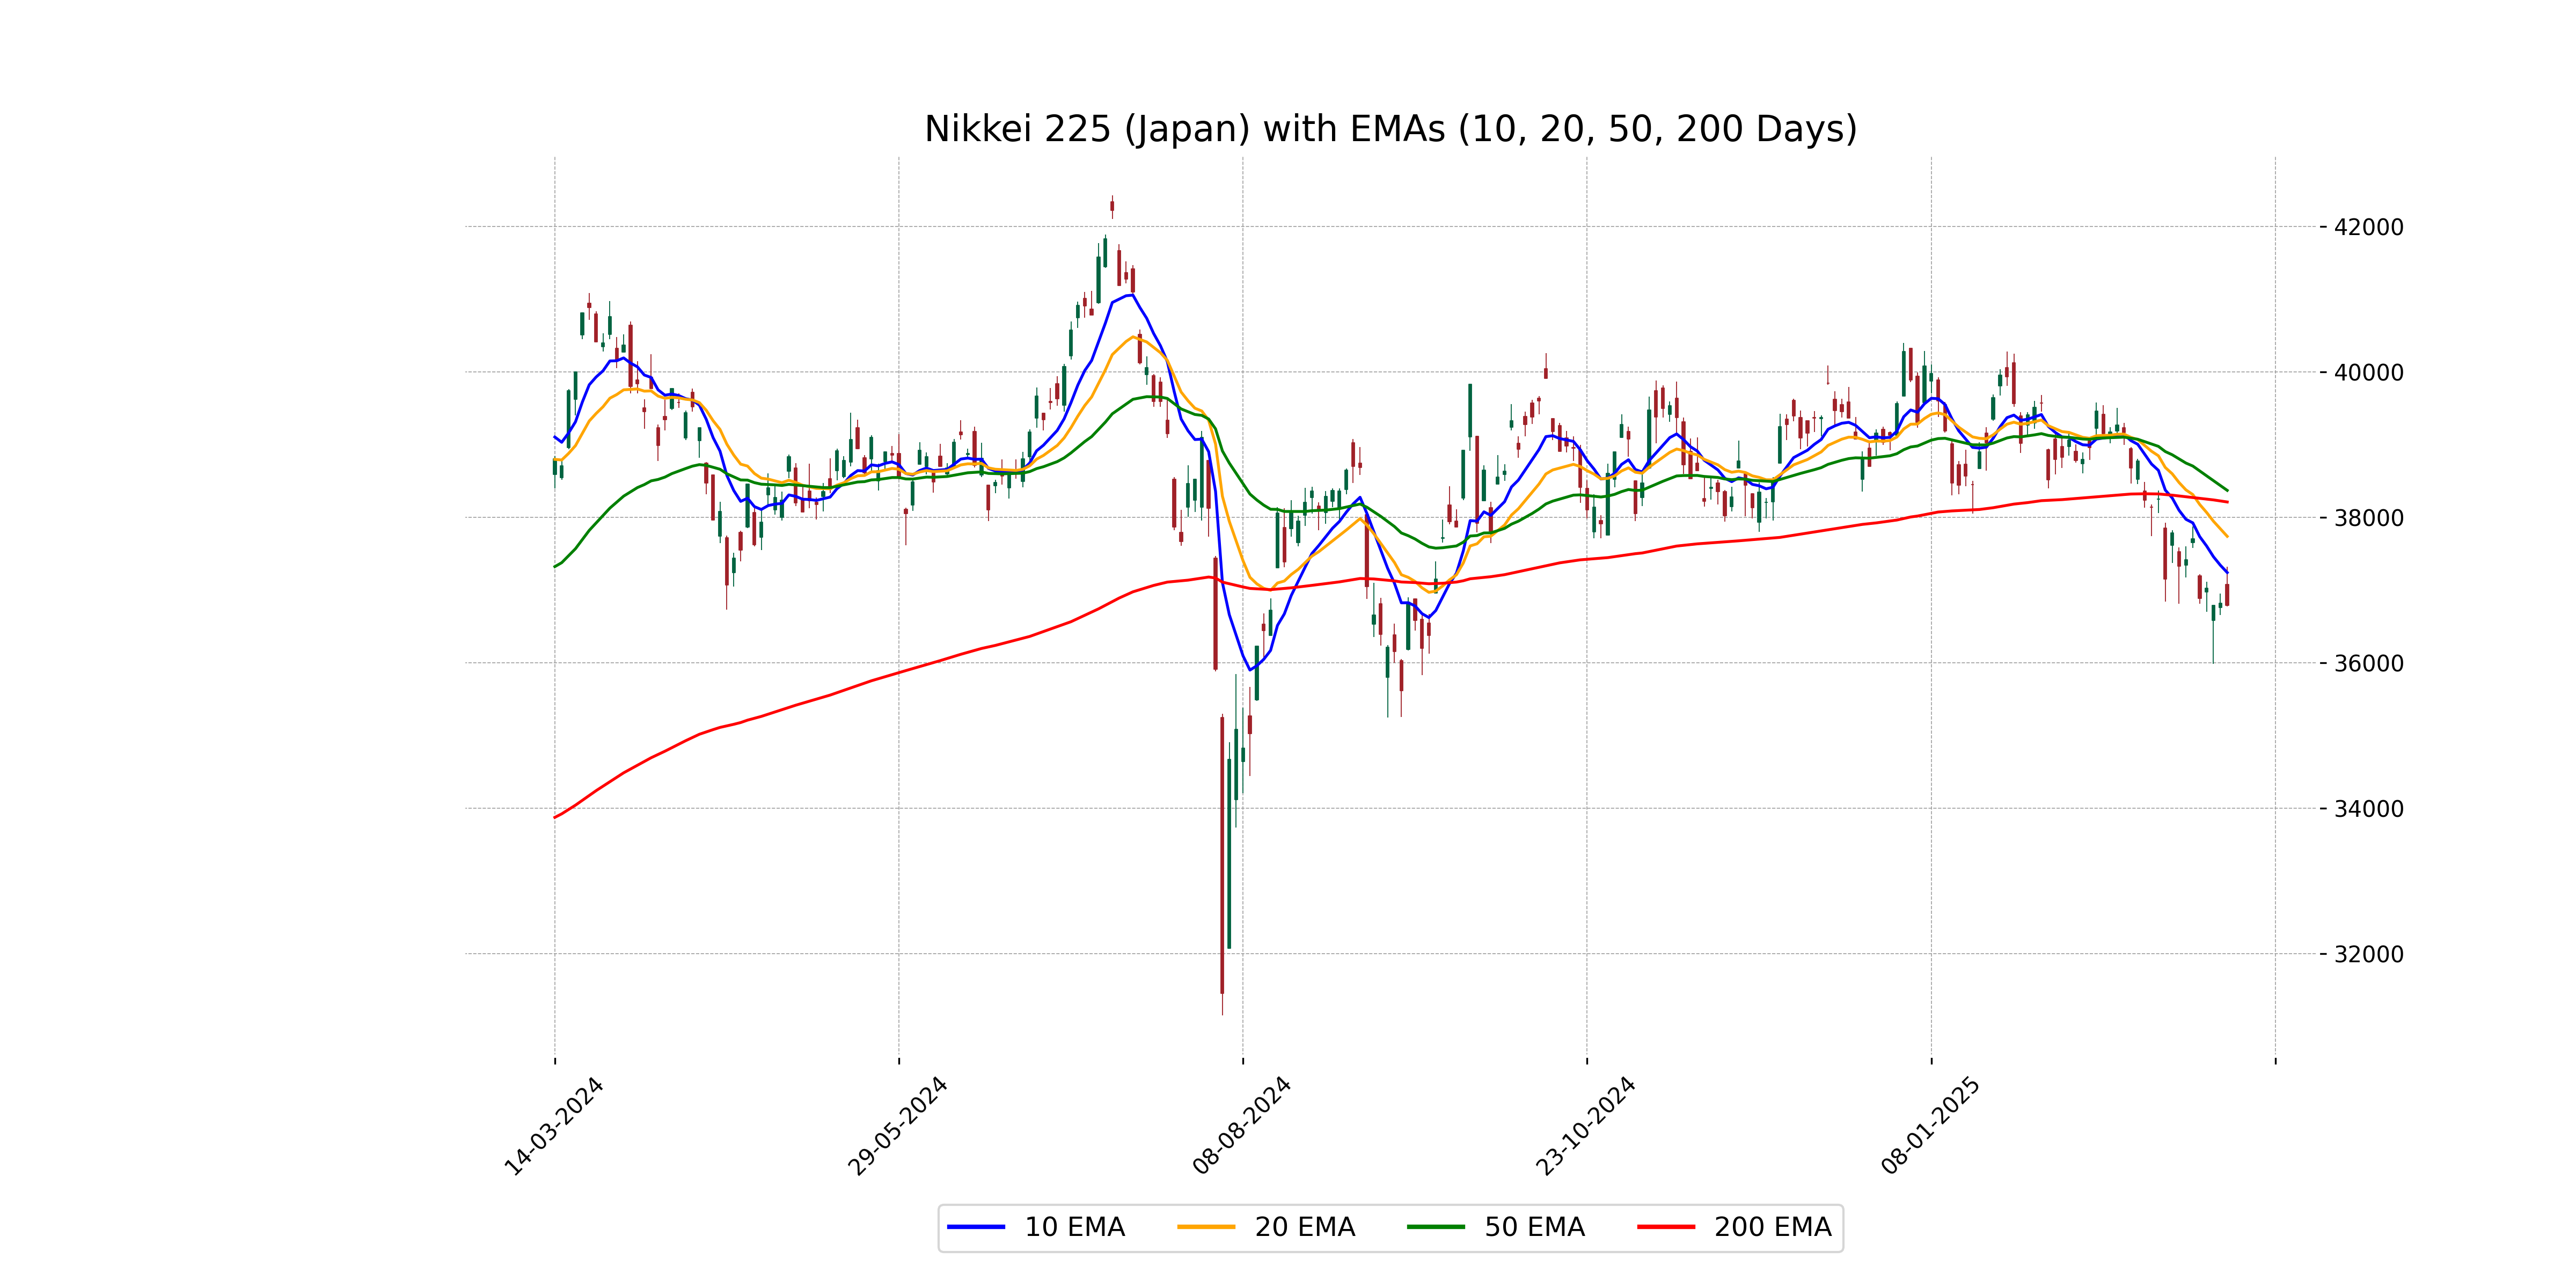
Relationship with Key Moving Averages
The current close of Nikkei 225 is 36,790.03125, which is below the 10 EMA (37,242.7725), 20 EMA (37,740.2735), 50 EMA (38,372.3956), and 200 EMA (38,213.0025). This indicates a potentially bearish trend as the price is trading below key moving averages.
Moving Averages Trend (MACD)
Nikkei 225's MACD is currently at -586.18, indicating a bearish momentum as it is below the MACD Signal line of -473.07. This negative divergence suggests a potential continuation of downward trends in the market.

RSI Analysis
The RSI for Nikkei 225 is 34.53, which indicates that the index is approaching oversold conditions. RSI values below 30 generally suggest that the asset is undervalued, hence close monitoring is needed to identify potential buying opportunities as it nears this threshold.

Analysis for Nifty Bank - March 13, 2025

The Nifty Bank index closed slightly higher with a minimal percentage change of 0.0078%, ending at 48,060.40, just above the previous close of 48,056.65. Despite the positive close, the index struggled to maintain momentum, evidenced by a low RSI of 39.00, suggesting potential oversold conditions. Additionally, the MACD indicator is in negative territory at -378.69, which further suggests bearish momentum in the short term.

Relationship with Key Moving Averages
Nifty Bank closed at 48060.40, which is below its 10-day EMA of 48297.03, 20-day EMA of 48590.44, 50-day EMA of 49281.52, and 200-day EMA of 49919.90. This suggests a bearish trend as it is trading below these key moving averages.
Moving Averages Trend (MACD)
The MACD for Nifty Bank is currently at -378.69, which is below the MACD Signal line of -340.55. This indicates a bearish trend as the MACD line is below the signal line, suggesting potential downward momentum in the price movement.

RSI Analysis
The RSI value for Nifty Bank is 39.00, indicating that the index is approaching the oversold territory but not yet quite there. An RSI below 30 would typically be considered oversold, signaling a potential buying opportunity if other indicators align.

Analysis for Nifty 50 - March 13, 2025

Nifty 50 opened at 22541.5 and closed slightly lower at 22397.2, indicating a decrease of 73.30 points or -0.33% from the previous close of 22470.5. The Relative Strength Index (RSI) stands at 38.18, suggesting it is approaching oversold territory. Key moving averages such as the 10 EMA and 20 EMA show figures slightly above the closing price, reflecting current bearish tendencies.

Relationship with Key Moving Averages
The close price of Nifty 50 is below the 10 EMA, 20 EMA, 50 EMA, and 200 EMA, indicating a bearish trend. The RSI is also below 50, suggesting weaker momentum, and the MACD is below the MACD Signal, reinforcing the bearish sentiment.
Moving Averages Trend (MACD)
The MACD for Nifty 50 is -209.73, with a MACD Signal of -235.88. This indicates a potential bullish reversal as the MACD is higher than the signal line, suggesting the downward momentum might be slowing. However, considering other indicators like the RSI, which is at 38.18, the market might still be experiencing bearish sentiment.

RSI Analysis
The RSI for Nifty 50 is 38.18, indicating that the index is nearing the oversold territory, as levels below 30 often suggest this. Traders should watch for any potential reversals or continuations in the current trend, as an RSI near 30 can hint at a possible buying opportunity if the downward momentum exhausts.
