Global stock market indices: How the world markets performed today - 17 March 2025
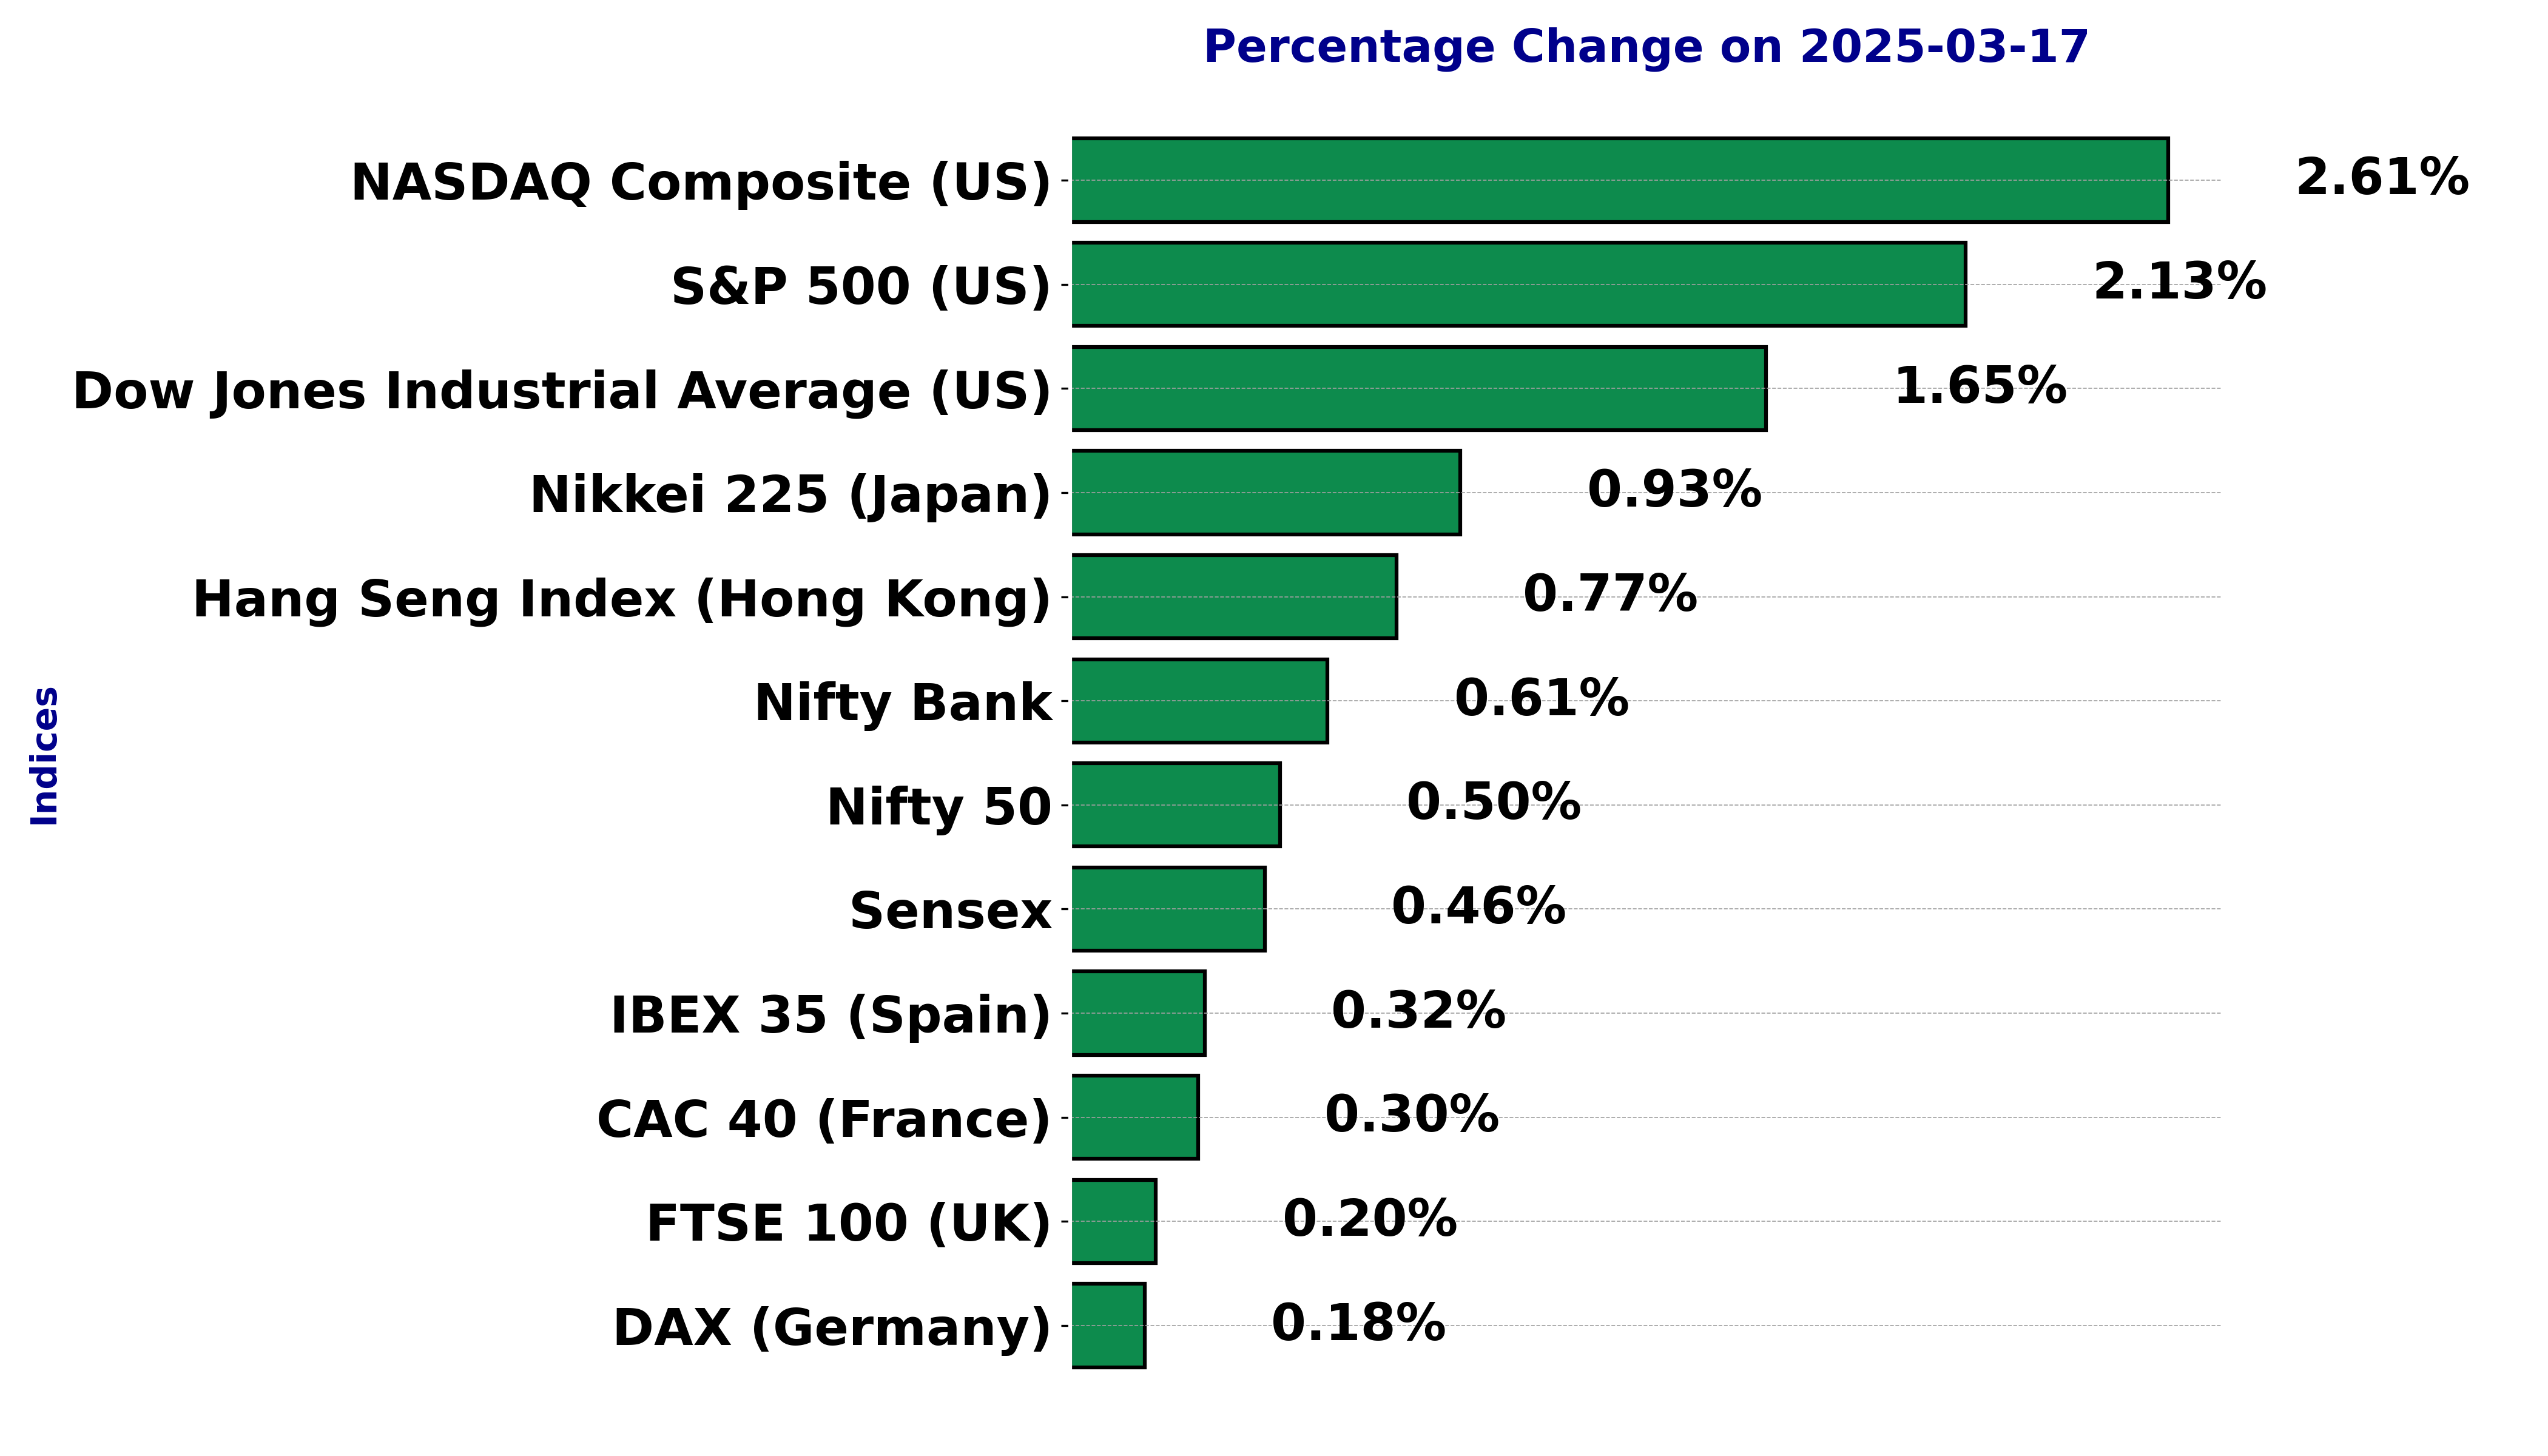
The international stock market indices showed varied performances on March 17, 2025, reflecting the economic sentiment across different regions.
In this article, we analyze the performance of key global indices including the S&P 500, Dow Jones Industrial Average, NASDAQ Composite, FTSE 100, DAX, CAC 40, IBEX 35, Nikkei 225, Hang Seng, Nifty 50, and BSE Sensex.
Analysis for Sensex - March 17, 2025

The Sensex opened at 73,830.03 and closed at 74,169.95, with a percentage change of 0.46% and a points change of 341.05. Despite a positive close, the RSI stands at 40.84, suggesting it is not yet in overbought territory. The MACD is negative at -696.43, indicating recent bearish momentum.

Relationship with Key Moving Averages
The Sensex closed at 74169.95, which is below its 50-day and 200-day EMAs of 75950.45 and 77194.52, indicating potential bearish sentiment. However, it is slightly above the 10-day EMA of 74127.55, suggesting short-term support.
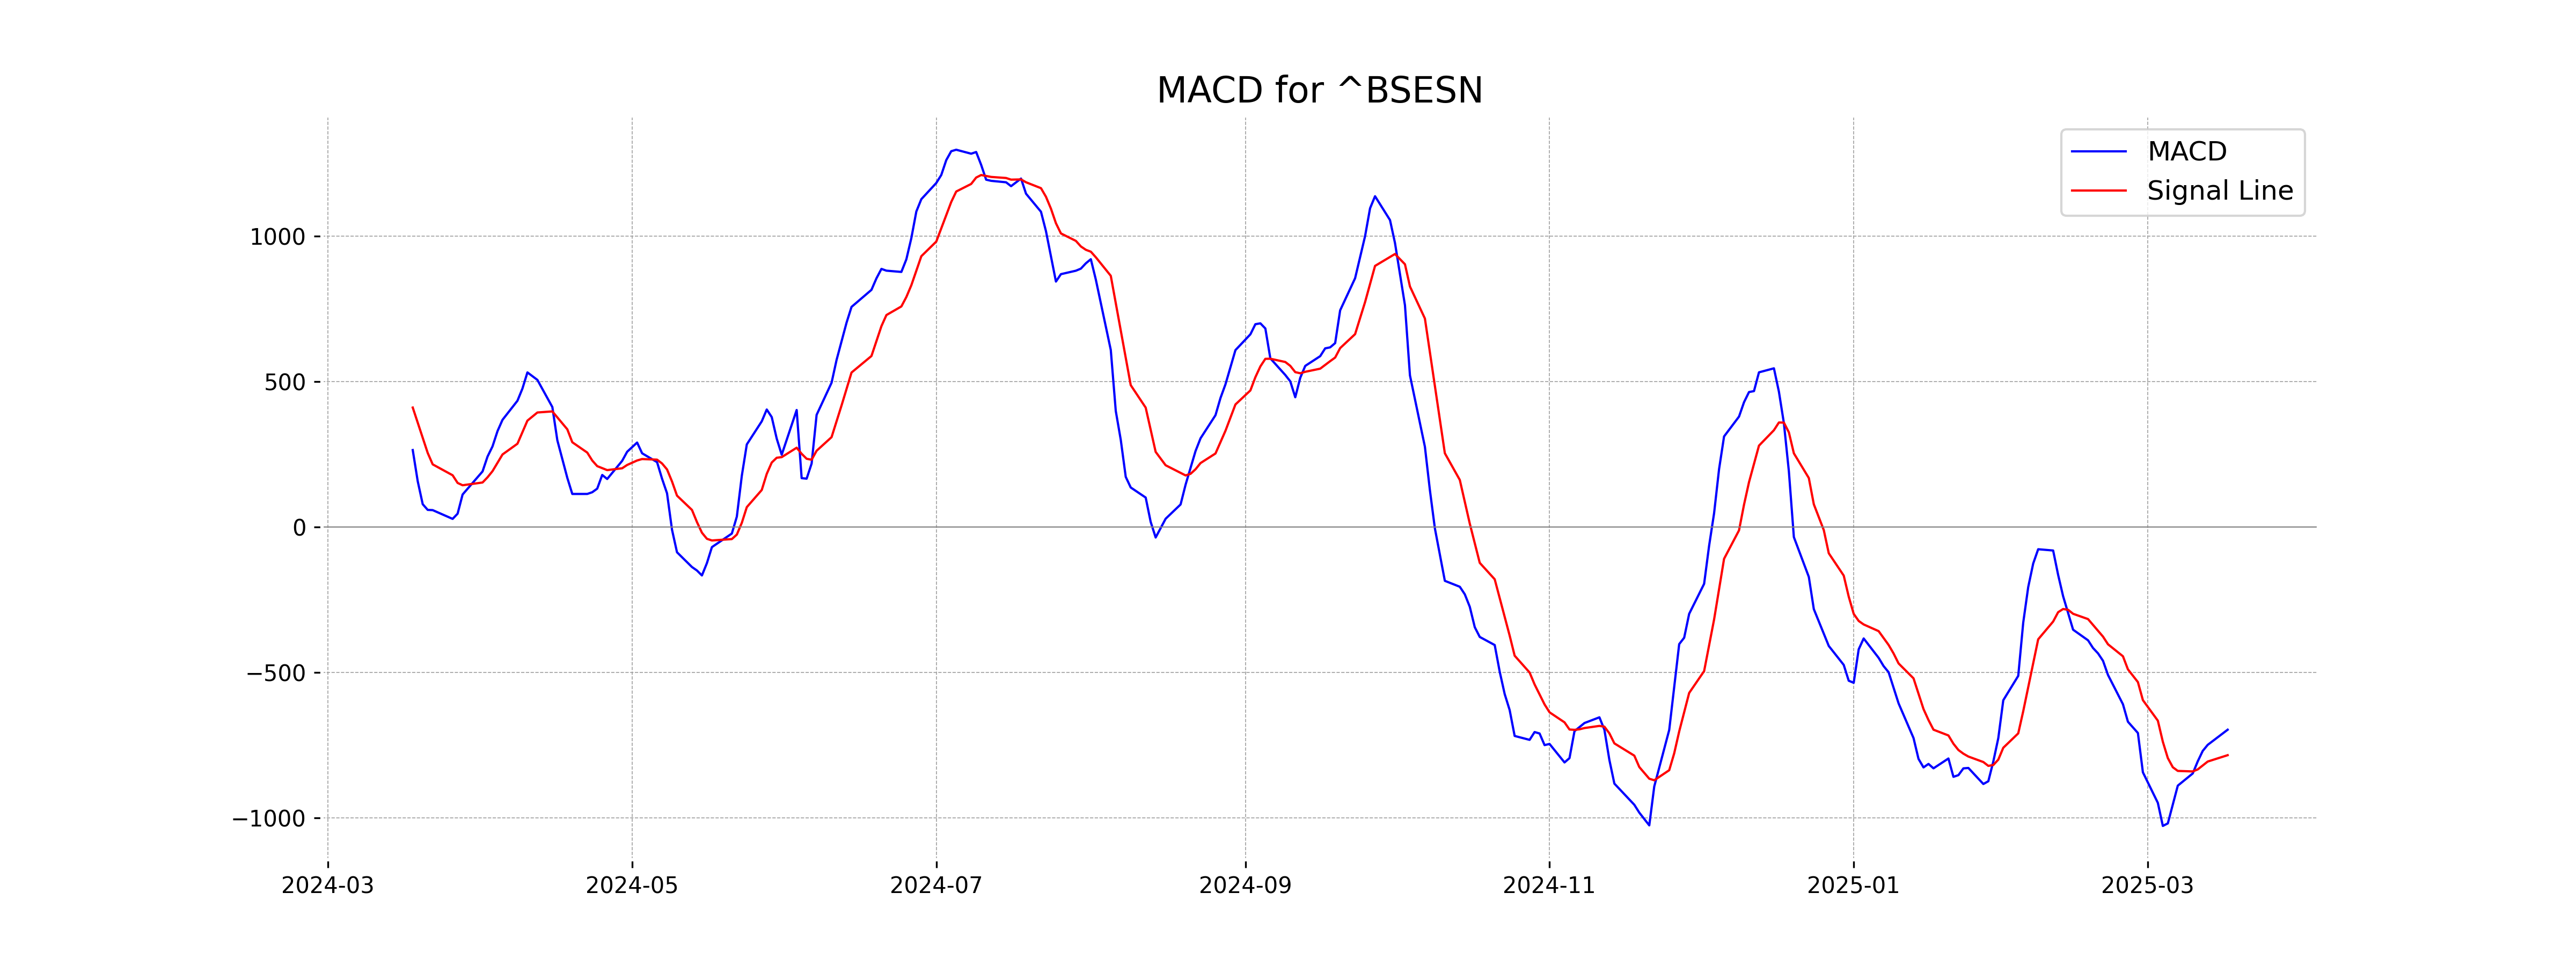
Moving Averages Trend (MACD)
The MACD for Sensex is -696.43, which is higher than its MACD Signal at -784.00. This indicates potential bullish momentum as the MACD line is moving towards crossing above the signal line. However, because both values are in the negative range, it's essential to monitor for a confirmed crossover and further market signals.
RSI Analysis
The RSI for Sensex is 40.84, which indicates a neutral to slightly oversold condition. This level is below the typical midpoint of 50, suggesting there may be more selling pressure than buying pressure, but it is not in the oversold territory below 30. Market participants might look for additional indicators to gauge potential reversals or continuation of current trends.

Analysis for Dow Jones Industrial Average (US) - March 17, 2025

The Dow Jones Industrial Average opened at 41,057.57 and closed at 41,488.19, experiencing a rise of 674.62 points, which translates to a 1.65% increase. Despite this gain, technical indicators such as the RSI at 35.85 suggest that the market is still in a bearish zone. The MACD is below the signal line, indicating bearish momentum, with the index remaining under its 50-, 200-, 10-, and 20-day EMAs.

Relationship with Key Moving Averages
The Dow Jones Industrial Average closed at 41,488.19, which is below its 50-day EMA of 43,242.48 and 200-day EMA of 42,006.07, but above the 10-day EMA of 42,016.21 and 20-day EMA of 42,671.57. This indicates it is currently trading in a short-term uptrend but remains in a broader downtrend.
Moving Averages Trend (MACD)
MACD Analysis for Dow Jones Industrial Average (US): The MACD value of -711.42, which is lower than the MACD Signal of -478.76, suggests a bearish momentum. This indicates that the recent downward trend may continue, and traders might consider being cautious with long positions.

RSI Analysis
The RSI value for the Dow Jones Industrial Average is 35.85, indicating that it is approaching the oversold region, as RSI values below 30 typically suggest oversold conditions. This might suggest a potential buying opportunity if other indicators also support this perspective.

Analysis for CAC 40 (France) - March 17, 2025

CAC 40 (France) opened at 8034.23 and closed at 8052.62, marking a 0.30% increase from the previous close of 8028.28. The high for the day was 8059.88, and the low was 8010.71, with no trading volume reported. The Relative Strength Index (RSI) stands at 51.58, indicating a fairly neutral market momentum.

Relationship with Key Moving Averages
The CAC 40 index closed at 8052.62, which is above the 50-EMA of 7923.65 and the 200-EMA of 7674.60, indicating a positive trend. However, it is just above the 10-EMA of 8043.19 and slightly below the 20-EMA of 8048.65, suggesting short-term mixed signals.
Moving Averages Trend (MACD)
The MACD analysis for CAC 40 (France) indicates a bearish trend as the MACD value of 17.29 is below the MACD Signal of 45.31. This suggests that the momentum could be slowing down, and traders might be cautious about potential further declines.

RSI Analysis
The Relative Strength Index (RSI) for the CAC 40 is currently at 51.58, indicating a neutral market condition. An RSI around this level suggests a balance between buying and selling pressures, with no significant overbought or oversold signals.

Analysis for FTSE 100 (UK) - March 17, 2025

The FTSE 100 index opened at 8632.33, reaching a high of 8657.97 and a low of 8625.04, ultimately closing at 8649.87. This marked a percentage change of 0.20% from the previous close, with a points increase of 17.57. The Relative Strength Index (RSI) is at 50.41, indicating a neutral market sentiment.

Relationship with Key Moving Averages
FTSE 100 is trading above its 50-day EMA of 8585.63, indicating a bullish short-term trend. However, it is trading below its 20-day EMA of 8651.86, suggesting some recent weakness. The position relative to the 200-day EMA of 8322.88 shows a longer-term bullish trend.
Moving Averages Trend (MACD)
The MACD for FTSE 100 is -7.48, which is below the MACD Signal of 14.86. This suggests a bearish trend as the MACD line is below the Signal line, indicating potential downward momentum in the market.

RSI Analysis
The current RSI for the FTSE 100 is 50.41, which suggests a neutral market sentiment. An RSI around this level indicates that the market is neither overbought nor oversold, and there might be potential for either buying or selling pressure to develop.

Analysis for DAX (Germany) - March 17, 2025

DAX (Germany) opened at 22,998.53 and closed at 23,027.55 with a small percentage change of 0.18% and gained 40.73 points from the previous close. The market momentum indicates a balanced RSI of 57.80, while the MACD suggests the index is below its signal line, showing moderate momentum.

Relationship with Key Moving Averages
DAX (Germany) is trading above its 10 EMA (22,785.57), 20 EMA (22,622.78), 50 EMA (21,951.42), and 200 EMA (20,013.16), indicating a strong upward momentum. The close price of 23,027.55 suggests a bullish trend as it is higher than all the significant moving averages.
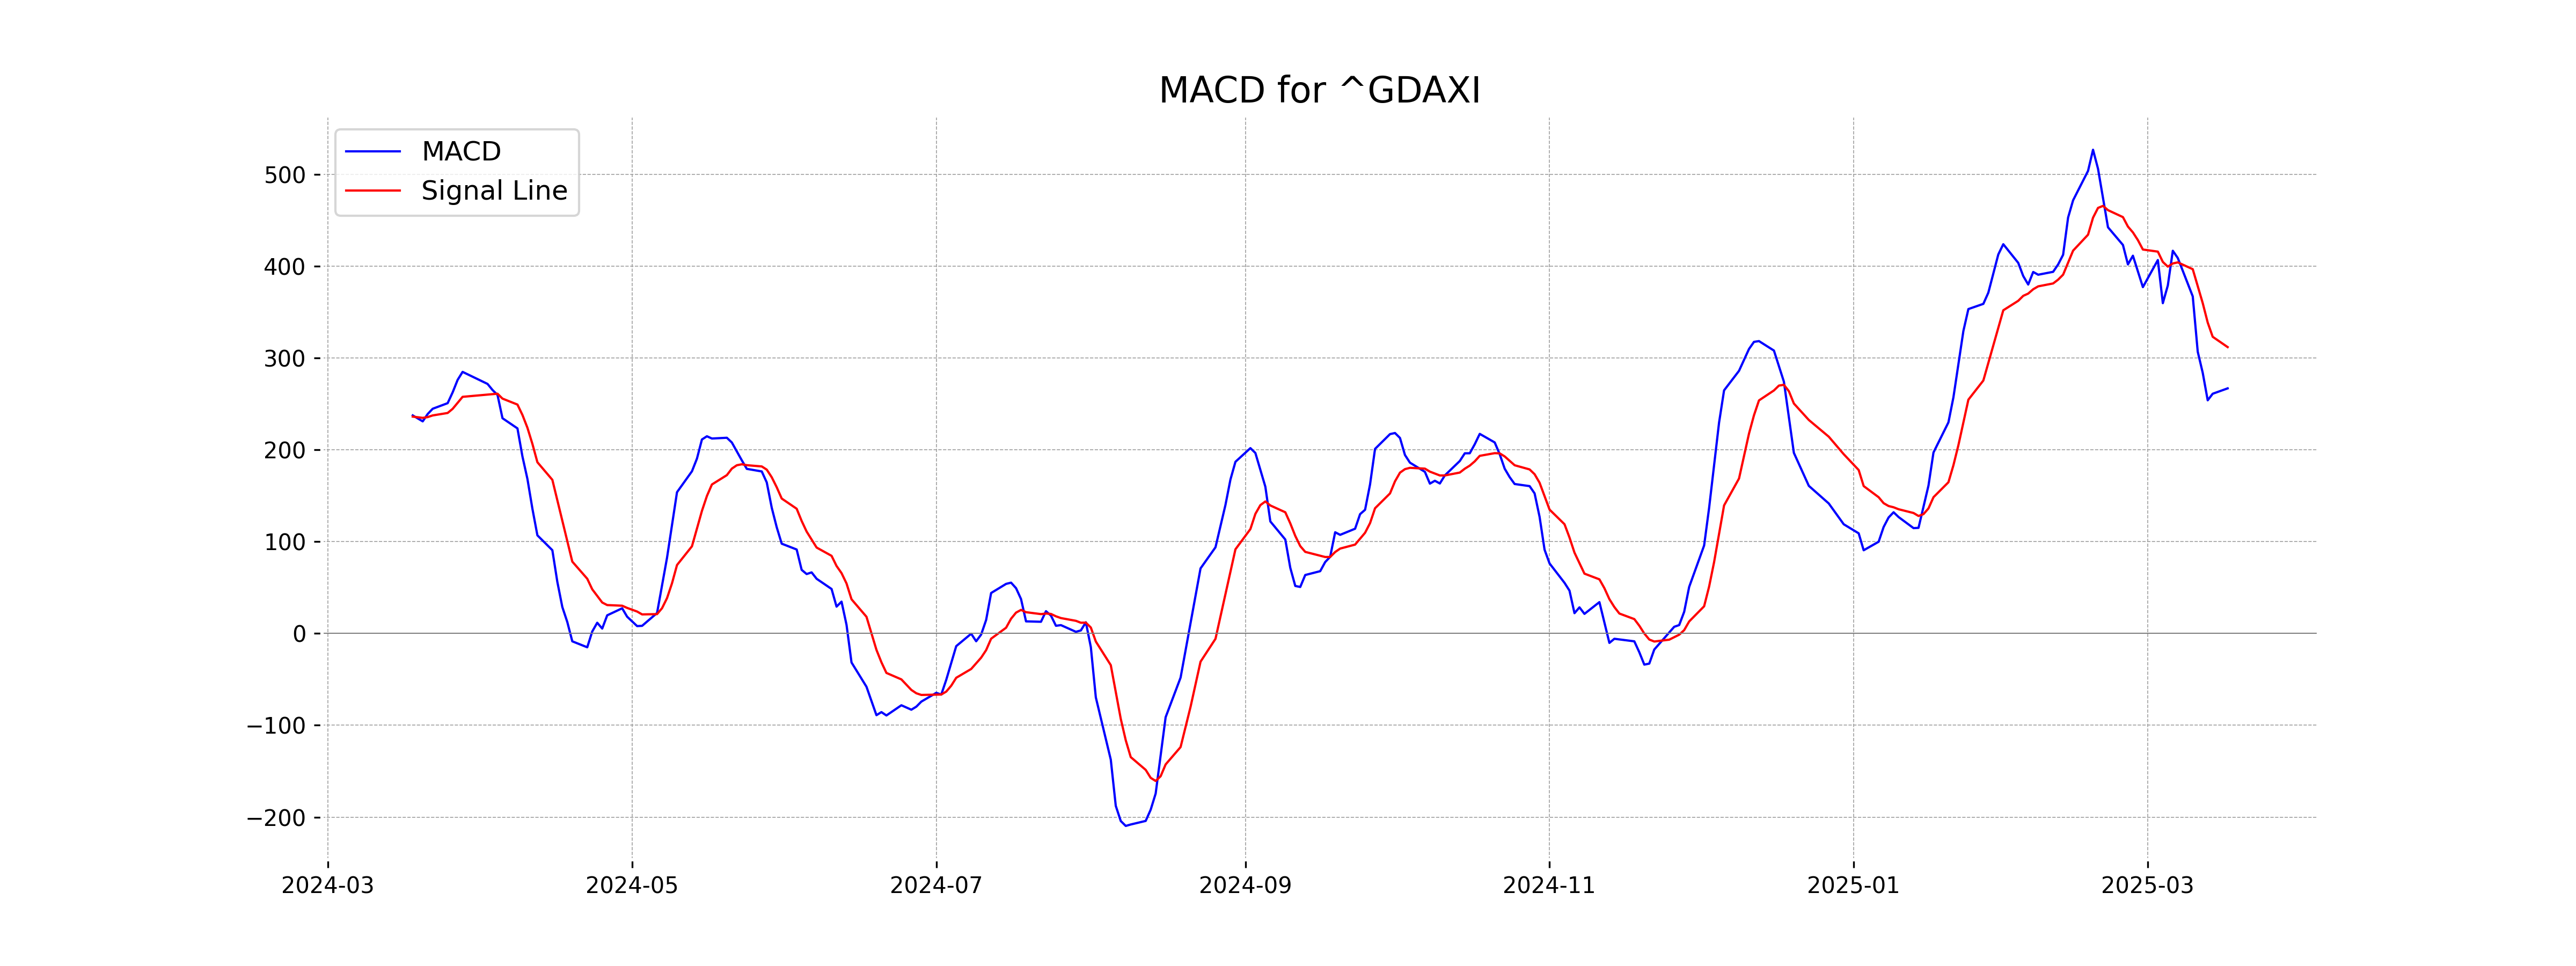
Moving Averages Trend (MACD)
The MACD for DAX is 266.84, which is below the MACD Signal value of 311.77. This suggests a potential bearish signal as the MACD line is below the signal line. The current RSI is 57.80, indicating a relatively neutral momentum at this point.
RSI Analysis
The Relative Strength Index (RSI) for DAX (Germany) stands at 57.80, indicating a neutral stance as it is between the typical overbought (>70) and oversold (<30) thresholds. This suggests that the index is neither overvalued nor undervalued currently, showing balanced market conditions.

Analysis for S&P 500 (US) - March 17, 2025

The S&P 500 (US) opened at 5563.85 and closed at 5638.94, with a notable positive change of 2.13%. The index experienced a high of 5645.27 and low of 5563.85, while the volume was recorded at 4.86 billion. Despite the positive daily performance, the S&P 500 remains below key moving averages, indicating a potential bearish trend with an RSI around 37.67, and MACD reflecting continued bearish momentum.

Relationship with Key Moving Averages
The S&P 500 closed at 5638.94, which is below its 50-day EMA of 5895.05, indicating a potential bearish trend. Additionally, it is below both the 10-day EMA (5689.87) and the 200-day EMA (5706.09), suggesting that the index is underperforming relative to its short-term and long-term historical averages.
Moving Averages Trend (MACD)
MACD Analysis for S&P 500 (US): The MACD value of -115.74 compared to the signal line of -82.82 indicates a bearish trend, suggesting potential downward momentum. This means the moving average convergence divergence is below its signal line, which may reflect a continued selling pressure.

RSI Analysis
The Relative Strength Index (RSI) for S&P 500 is 37.67, indicating that the index is approaching oversold territory. Typically, an RSI below 30 suggests that the stock is oversold, potentially signaling a buying opportunity; however, a reading of 37.67 may suggest a period of cautious observation.

Analysis for Hang Seng Index (Hong Kong) - March 17, 2025

The Hang Seng Index opened at 24,226.0 and closed higher at 24,145.57, marking a positive change of 0.77% or an increase of 185.59 points. Despite this rise, the index showed no trading volume for the day, and its RSI stands relatively strong at 64.79, suggesting market strength.

Relationship with Key Moving Averages
The Hang Seng Index is trading above its 50-day and 200-day EMAs, indicating a positive medium to long-term trend. However, it is also above the 10-day and 20-day EMAs, suggesting short-term bullish momentum. The RSI indicates a slightly overbought condition.
Moving Averages Trend (MACD)
The MACD for the Hang Seng Index indicates a value of 644.33, which is below the MACD Signal of 711.18. This suggests a bearish momentum as the MACD line is below the signal line, signaling potential downward movement in the short term.

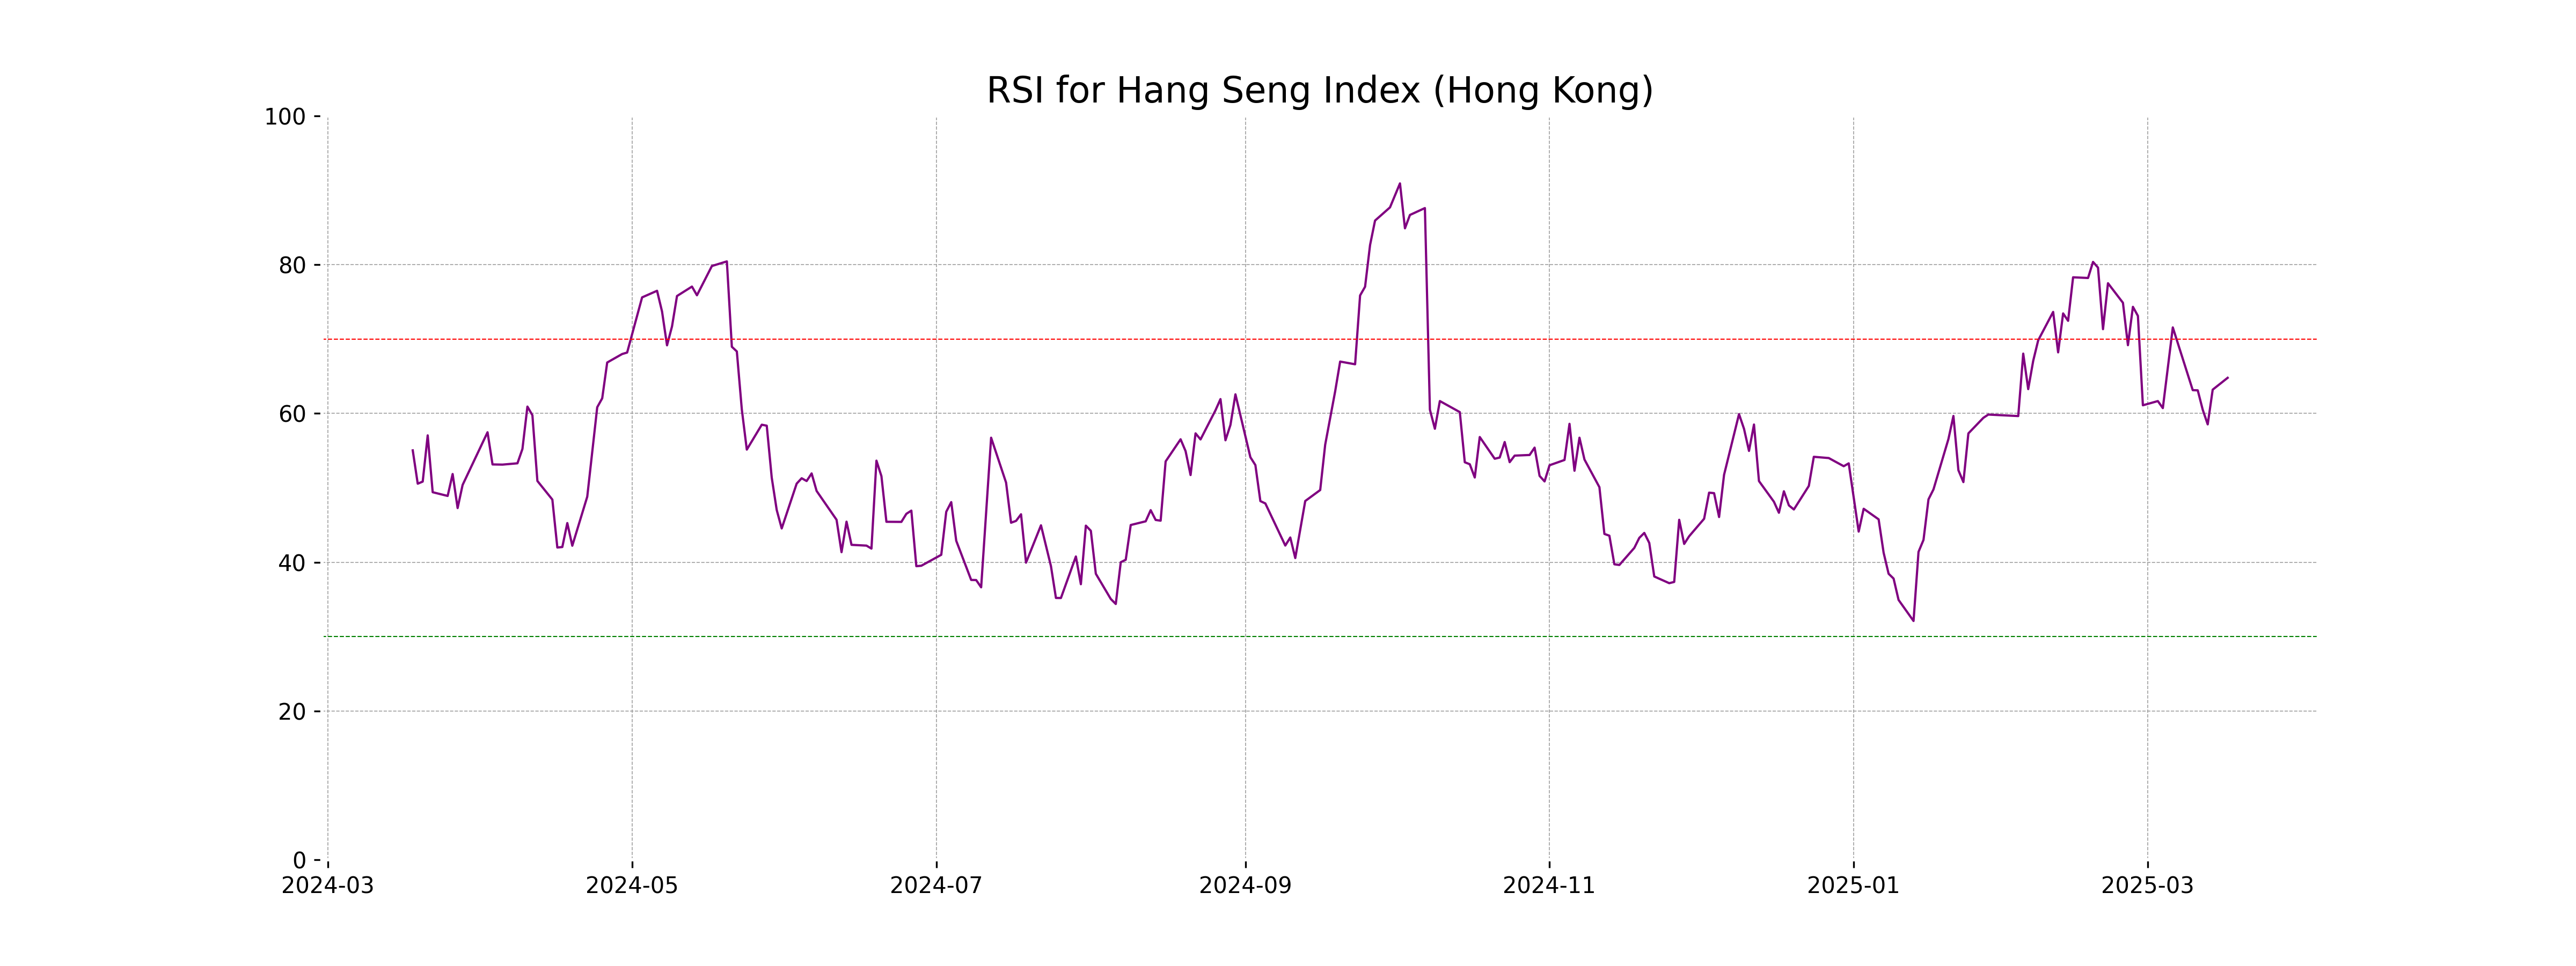
RSI Analysis
The RSI for the Hang Seng Index (Hong Kong) stands at 64.79, indicating that the index is nearing the overbought territory, as RSI values above 70 are typically considered overbought. This suggests that investors should monitor for potential price corrections or a slowdown in the upward momentum.
Analysis for IBEX 35 (Spain) - March 17, 2025
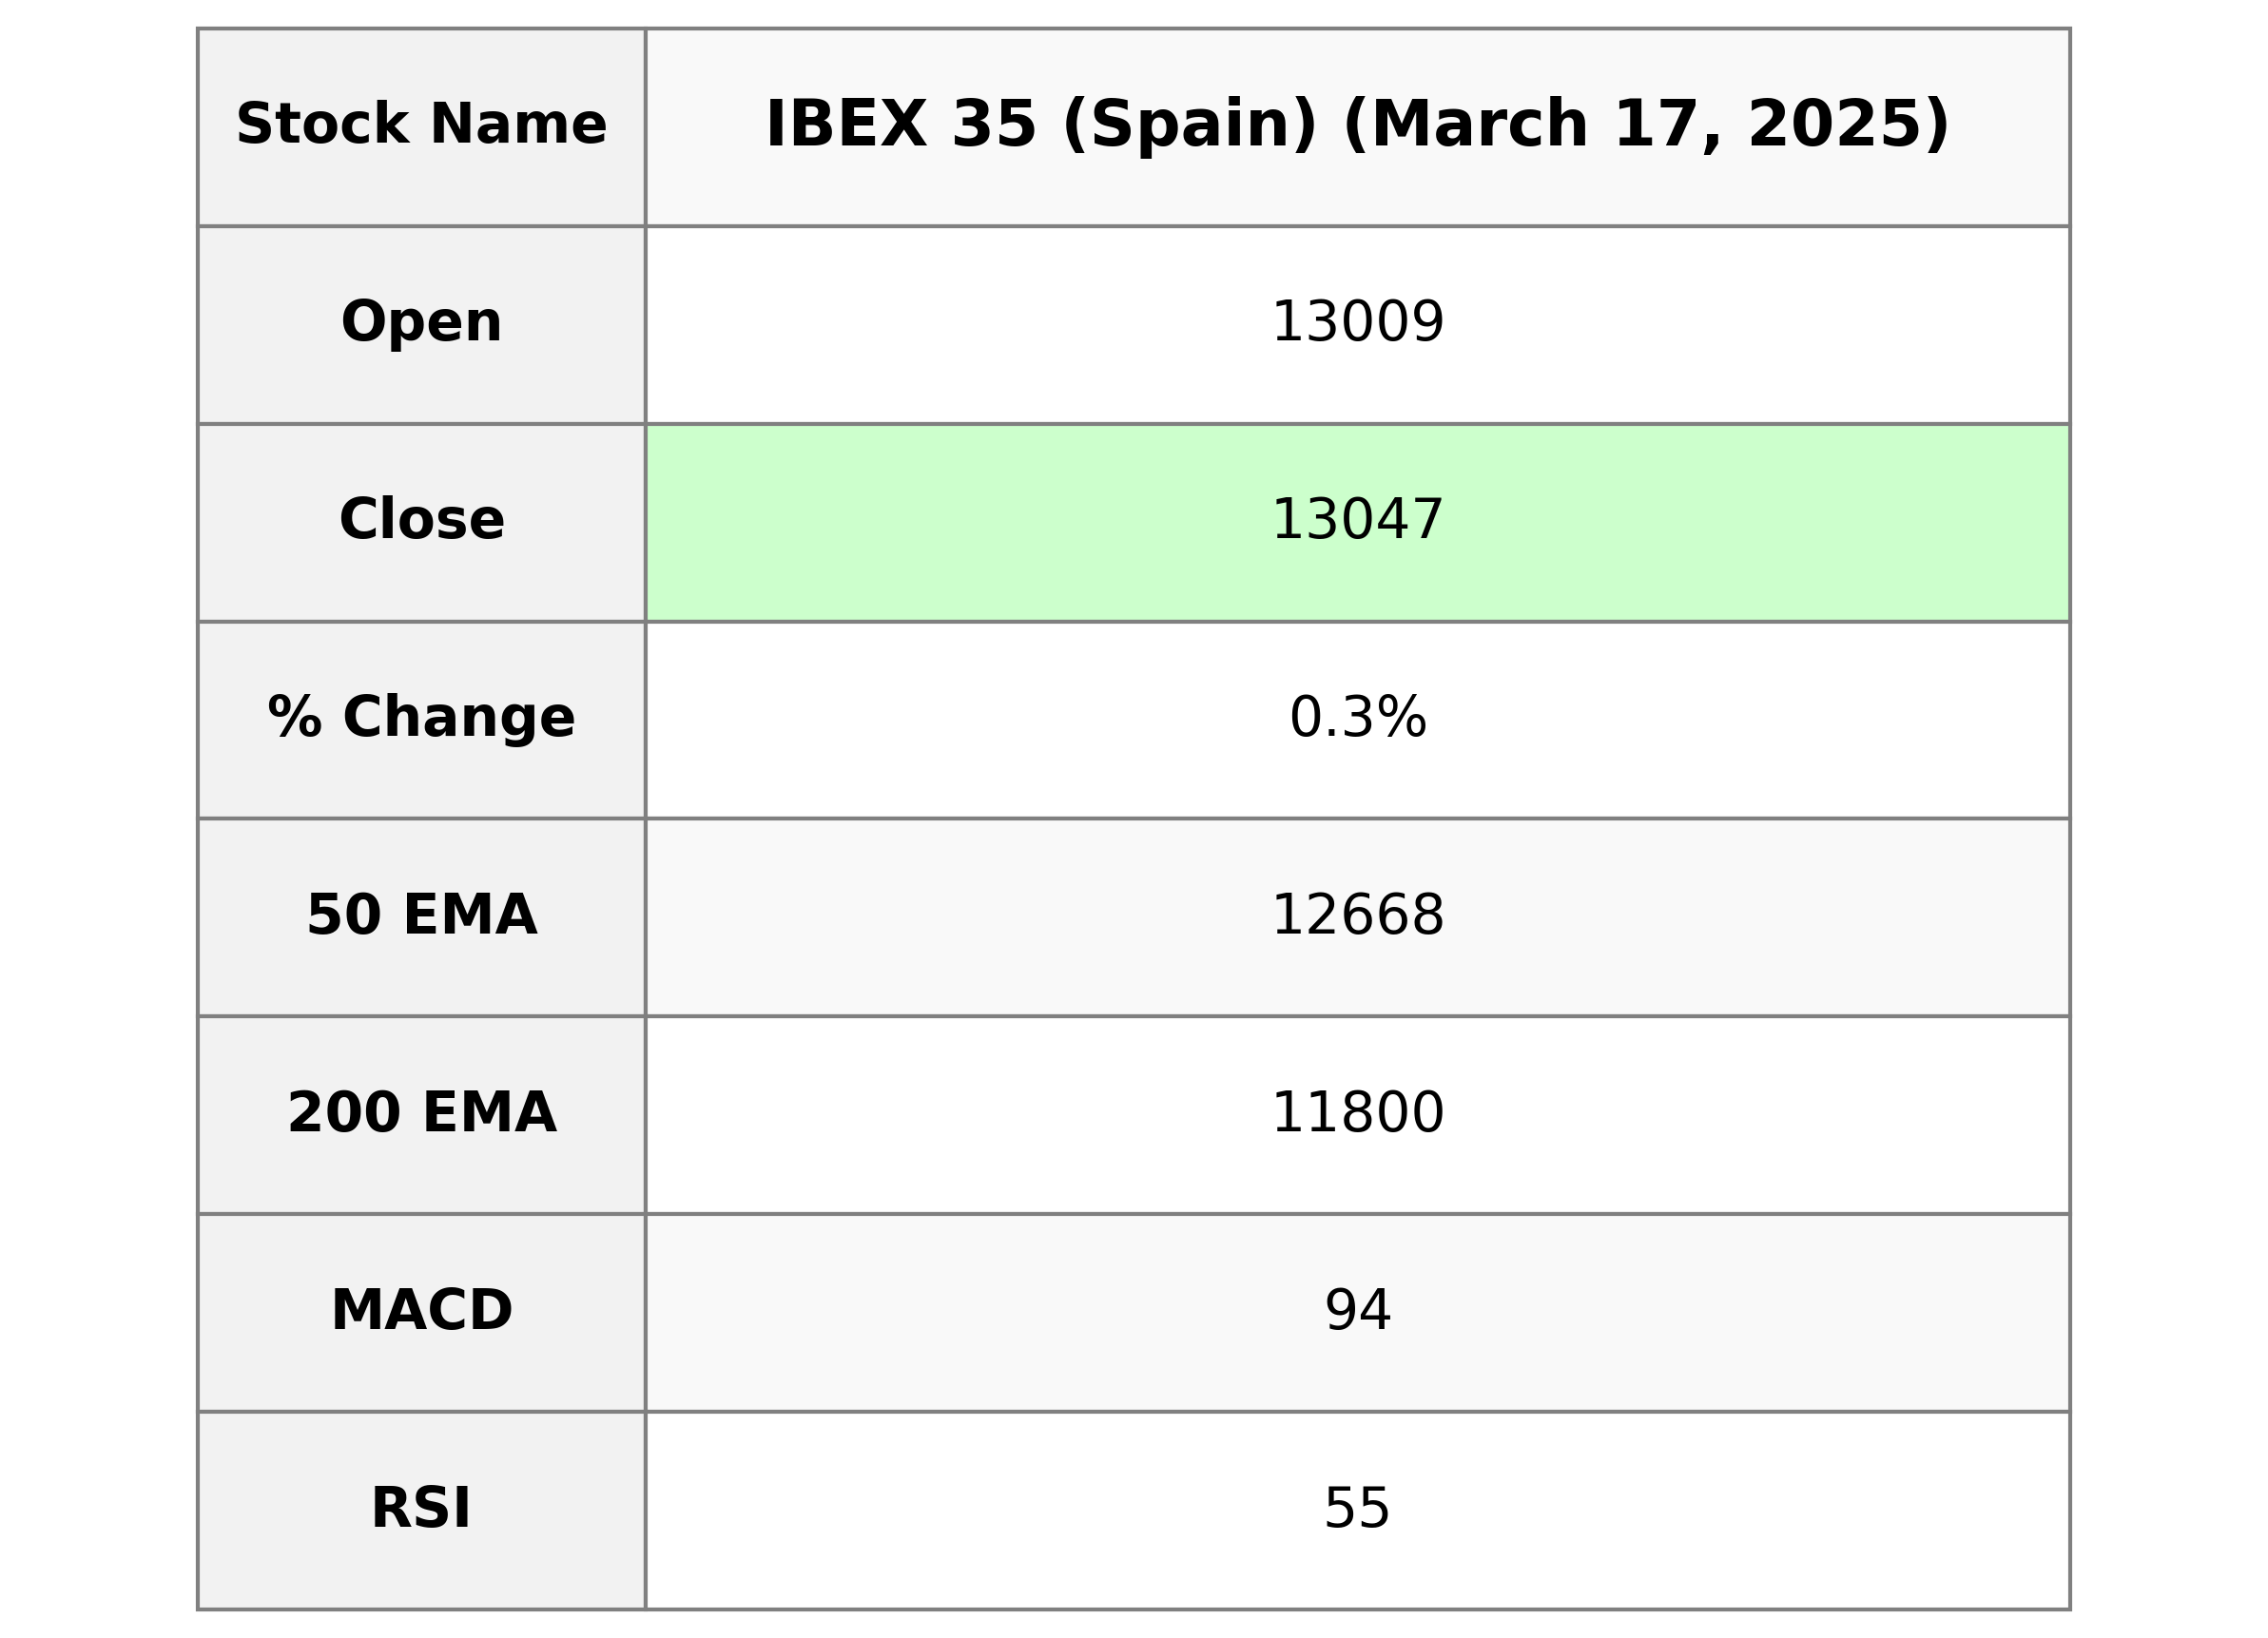
The IBEX 35 (Spain) opened at 13009.40, reached a high of 13073.90, and closed at 13046.70, marking a marginal gain with a 0.32% increase compared to the previous close. The volume of trades stood at 26,926,119, reflecting steady market participation. Key technical indicators such as the RSI and MACD suggest a relatively neutral market sentiment.

Relationship with Key Moving Averages
The closing price of IBEX 35 is above its 50 EMA, 200 EMA, and 10 EMA, indicating a short to mid-term upward trend. The close price is also above the 20 EMA, further reinforcing the bullish sentiment.
Moving Averages Trend (MACD)
The MACD value for IBEX 35 is 94.25, which is below the MACD Signal line of 159.10, indicating a bearish trend. This suggests that the momentum could be shifting to the downside, and traders might anticipate potential declines unless a reversal occurs.

RSI Analysis
The RSI for IBEX 35 (Spain) is 54.84, indicating a neutral position with neither overbought nor oversold conditions. This suggests that the index is currently maintaining a balance between buying and selling pressures.

Analysis for NASDAQ Composite (US) - March 17, 2025

NASDAQ Composite Performance: On the latest trading day, NASDAQ Composite opened at 17,523.30, experienced a high of 17,773.48, and closed at 17,754.09, marking a notable increase of approximately 2.61% with a points change of 451.08 from the previous close. The index displayed significant trading activity with a volume of 7,093,850,000, while technical indicators show a bearish sentiment with a 37.48 RSI and a negative MACD divergence.

Relationship with Key Moving Averages
The NASDAQ Composite is currently trading below its 50-day EMA and 200-day EMA, indicating a bearish trend. However, it is slightly above the 10-day EMA, which may suggest a short-term upward movement or recovery.
Moving Averages Trend (MACD)
MACD Analysis for NASDAQ Composite (US): The MACD value of -544.03, which is lower than the MACD Signal of -429.30, indicates a bearish momentum. This suggests a potential downside or continuation of a downward trend for the index.

RSI Analysis
The NASDAQ Composite's RSI stands at 37.48, indicating it is nearing the oversold territory. Generally, an RSI below 30 is considered oversold, suggesting a potential buying opportunity; however, at 37.48, it may still face downward pressure in the short term.

Analysis for Nikkei 225 (Japan) - March 17, 2025

Nikkei 225 (Japan) opened at 37,453.83 and closed slightly lower at 37,396.52, reflecting a modest daily percentage increase of approximately 0.93% despite closing below its opening. The index is currently below its 50 EMA and 200 EMA, with a MACD indicating a bearish momentum at -518.44 compared to the signal line of -497.20. The RSI is at 43.82, suggesting that the market isn't overbought nor oversold.

Relationship with Key Moving Averages
The Nikkei 225 closed at 37396.52, which is below both the 50-day EMA of 38284.42 and the 200-day EMA of 38193.73, indicating a potential bearish trend. However, it is above the 10-day EMA of 37242.51, suggesting short-term upward movement.
Moving Averages Trend (MACD)
The MACD analysis for Nikkei 225 indicates a bearish trend, as the MACD value of -518.44 is below the MACD Signal line of -497.20. This suggests that selling pressure might be increasing.

RSI Analysis
RSI Analysis for Nikkei 225 (Japan): The Relative Strength Index (RSI) for Nikkei 225 is at 43.82. Being below 50 indicates a bearish or weak momentum, suggesting the index is closer to being oversold rather than overbought in the market.

Analysis for Nifty Bank - March 17, 2025

The Nifty Bank index opened at 48,219.55 and closed at 48,354.15, marking a positive change of 0.61% from the previous close of 48,060.40, gaining 293.75 points. The index had a relatively stable performance, with the highest point at 48,481.35 and the lowest at 48,196.10. Despite the gain, technical indicators such as the RSI of 44.13 and the MACD being below the MACD Signal suggest some bearish momentum in the current market conditions.

Relationship with Key Moving Averages
The Nifty Bank's closing price of 48,354.15 is below its 50 EMA of 49,245.16 and 200 EMA of 49,904.72, indicating a potential bearish trend. However, it is currently above its 10 EMA of 48,307.42 but below its 20 EMA of 48,567.94, suggesting mixed short-term signals.
Moving Averages Trend (MACD)
MACD Analysis for Nifty Bank: The MACD for Nifty Bank is -351.27, which is below the MACD Signal line at -342.70, indicating a bearish trend. This suggests a potential continuation of the downward momentum in the near-term.

RSI Analysis
The Relative Strength Index (RSI) for Nifty Bank stands at 44.13, which suggests that the stock is in a neutral zone, potentially moving towards being oversold if the RSI continues to decrease. An RSI below 30 typically indicates that the stock is oversold, while an RSI above 70 suggests overbought conditions.

Analysis for Nifty 50 - March 17, 2025

The Nifty 50 opened at 22,353.15 and closed at 22,508.75, marking a 0.50% increase with a gain of 111.55 points from the previous close of 22,397.20. The index's RSI is at 42.91, suggesting it is not in overbought territory, while the MACD is -192.80, which indicates a continued bearish trend.

Relationship with Key Moving Averages
Nifty 50's current closing price of 22508.75 is below its 50-day EMA of 23001.04 and 200-day EMA of 23414.55, indicating a bearish short to medium-term trend. However, the price is slightly above the 10-day EMA of 22475.15, suggesting a potential short-term bullish momentum.
Moving Averages Trend (MACD)
Based on the stock data, Nifty 50's MACD is -192.80, which is higher than the MACD Signal of -227.26, indicating a bullish signal as the MACD line is crossing above the signal line. However, the MACD value is negative, suggesting the overall trend is still bearish but may be reversing.

RSI Analysis
RSI Analysis for Nifty 50: Based on the provided data, the RSI (Relative Strength Index) for Nifty 50 is 42.91. This suggests that the index is neither overbought nor oversold. Generally, an RSI below 30 indicates that an asset might be undervalued (oversold), while an RSI above 70 suggests it might be overvalued (overbought). Hence, Nifty 50 is currently in a neutral zone, implying a balanced momentum.
