Indian stock market sector-wise performance today - March 28, 2025
The stock market performance on Friday (March 28, 2025) highlighted several key sectors and indices with notable changes.
The BSE Sensex opened at 77,690.69 and closed slightly lower at 77,414.92, experiencing a modest decline of 0.25%.
The Nifty Auto index saw a more significant downturn, opening at 21,570.20 and closing at 21,295.50, resulting in a decrease of 1.03%.
Similarly, Nifty Energy also faced a decrease, closing at 33,571.60 from an open of 33,771.45, marking a decline of 0.33%.
On a brighter note, Nifty FMCG provided a positive contribution by increasing 0.59%, closing at 53,589.80. This upswing was somewhat isolated, with many other sectors showing downward trends.
Nifty Infrastructure saw a small decrease of 0.28%, and Nifty IT faced a substantial drop of 1.76%, closing at 36,886.15, indicating a significant shift in the technology sector.
Furthermore, Nifty Metal declined by 0.73%, with its closing at 9,092.50, driven by softer performances within the metal commodities, likely due to external market pressures.
The Nifty Bank remained relatively stable, with a minimal decrease of 0.02%, closing at 51,564.85. Lastly, the aggregate performance of Nifty 50 reflected a slight downturn of 0.31%, closing at 23,519.35.
The most affected sector this time was the technology sector, as represented by Nifty IT. This sector faced pressure due to various potential factors, such as investor sensitivities toward valuations and global headwinds impacting technology industries.
Concerns over interest rate hikes and macroeconomic uncertainties also might have contributed to the selling pressure in IT stocks.
The overall investor sentiment showed caution and some profit-taking, considering the previously strong rallies in these stocks. The outlined dynamics suggest an investor focus on rebalancing portfolios, with particular attention to global events influencing the technology and auto sectors.
This varied performance across different sectors indicates a broader market search for stability amid changing economic conditions.

Analysis for Sensex - March 28, 2025

Sensex Performance Description: The Sensex opened at 77,690.69 and closed at 77,414.92, reflecting a decline of 191.51 points, which is a percentage change of -0.25%. The 50-day EMA is at 76,268.15, while the 200-day EMA is 77,175.37, indicating a short-term bullish trend. The RSI is at 62.94, suggesting the market is nearing overbought territory, and the MACD is above the signal line, reinforcing the current upward momentum.

Relationship with Key Moving Averages
The Sensex closed at 77,414.92, which is above the 50-day EMA of 76,268.15, suggesting a short-term bullish trend. It's also above the 10-day EMA of 76,737.22 but slightly above the 200-day EMA of 77,175.37, indicating a potential long-term bullish momentum.
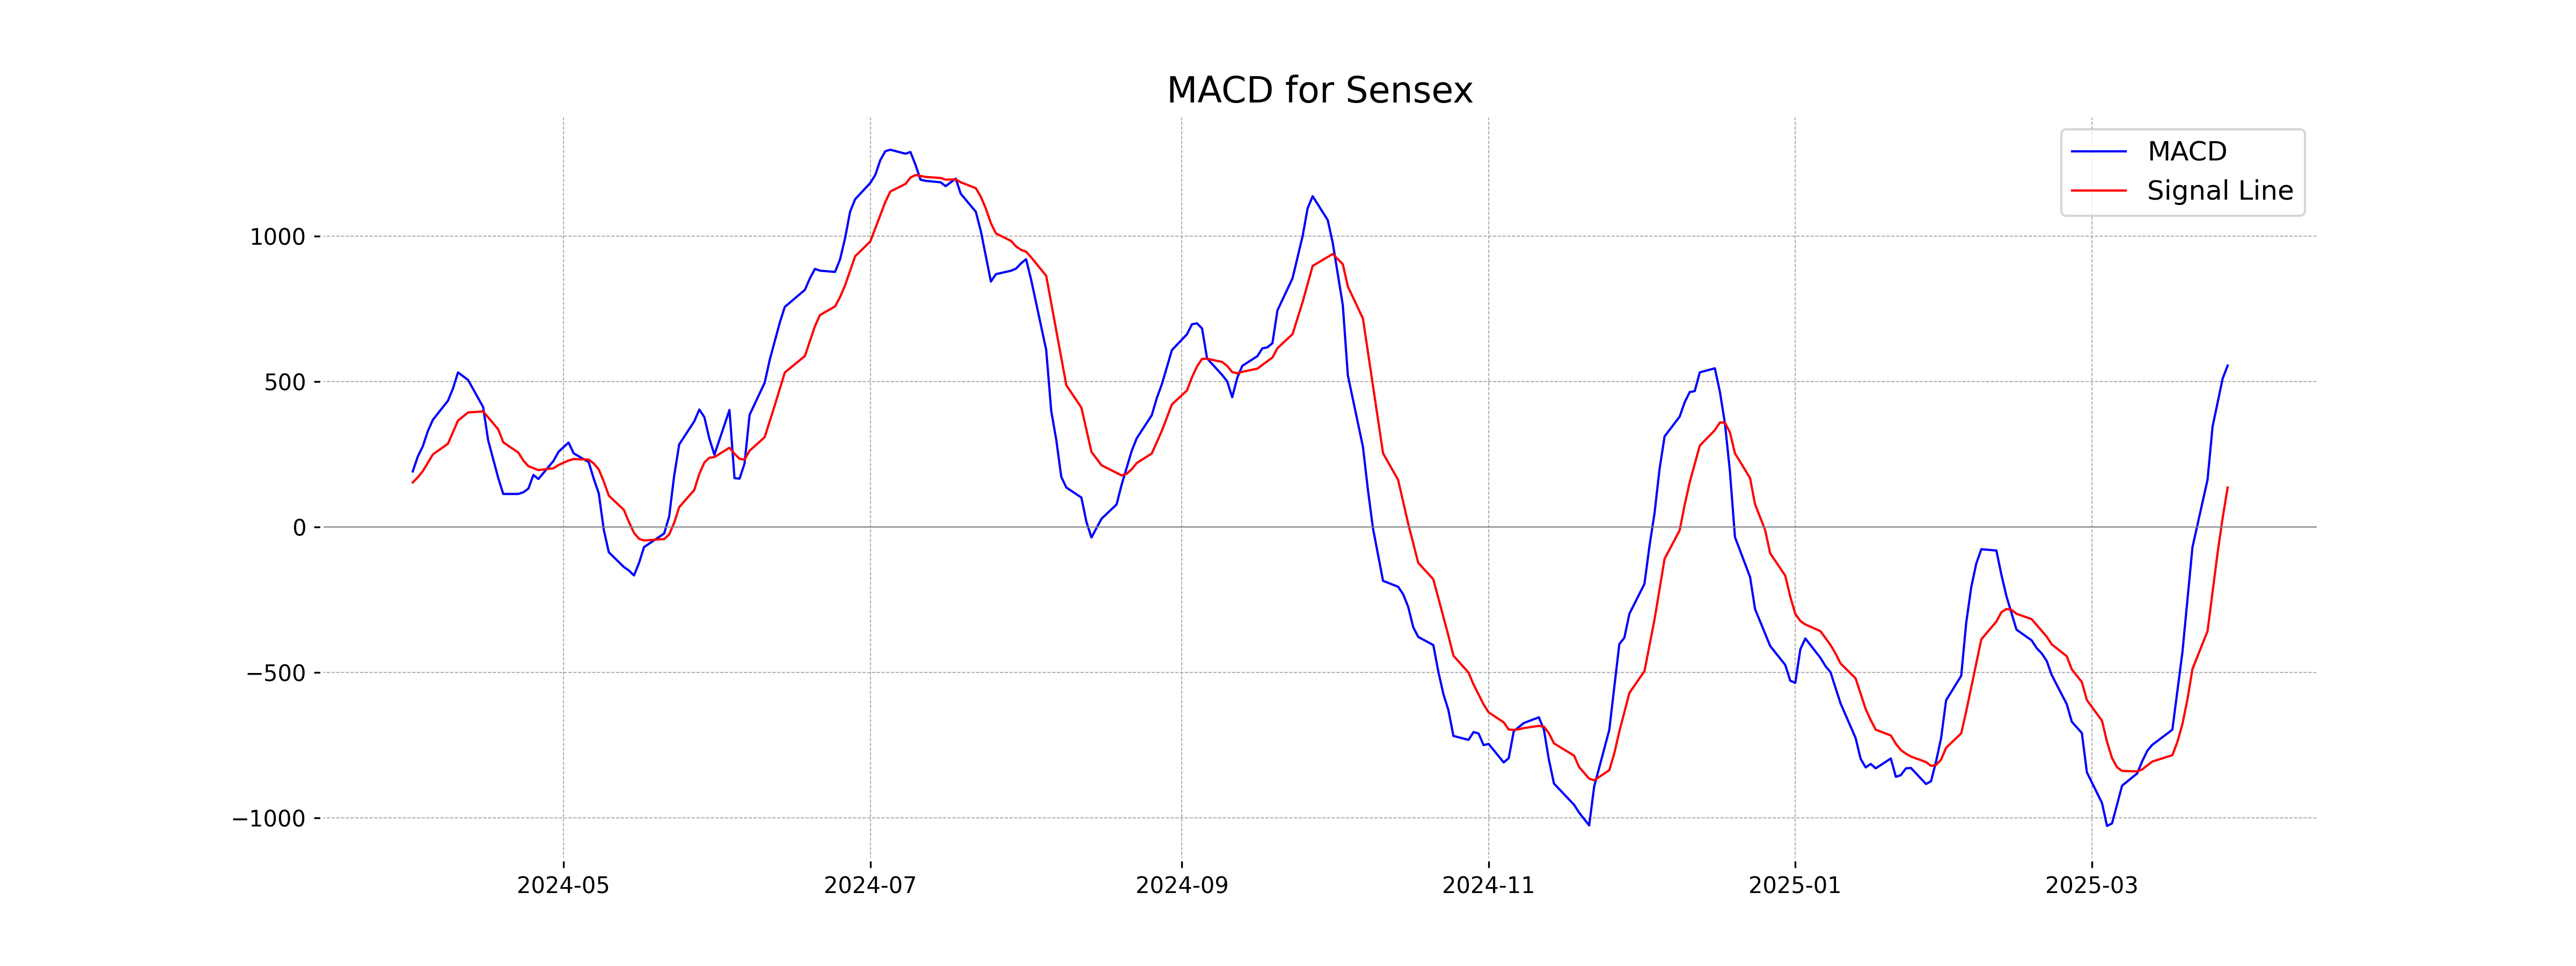
Moving Averages Trend (MACD)
Sensex MACD Analysis: The MACD value for Sensex is 555.44, which is above the MACD Signal value of 136.41. This indicates a bullish momentum in the stock market index, suggesting potential upward movement if the trend continues.
RSI Analysis
The RSI (Relative Strength Index) for the Sensex is 62.94, indicating that the index is nearing an overbought zone. While it's not yet overbought, investors should monitor it closely as it approaches the 70 level, which may suggest a potential pullback.

Analysis for Nifty Auto - March 28, 2025

Nifty Auto Performance: Nifty Auto opened at 21,570.20, reached a high of 21,577.20, and closed at 21,295.50, indicating a decrease of 1.03% from the previous close of 21,516.75. The MACD of -56.02 and RSI of 46.36 suggest a bearish trend, while the close is below the 10-day, 20-day, and 50-day EMAs.
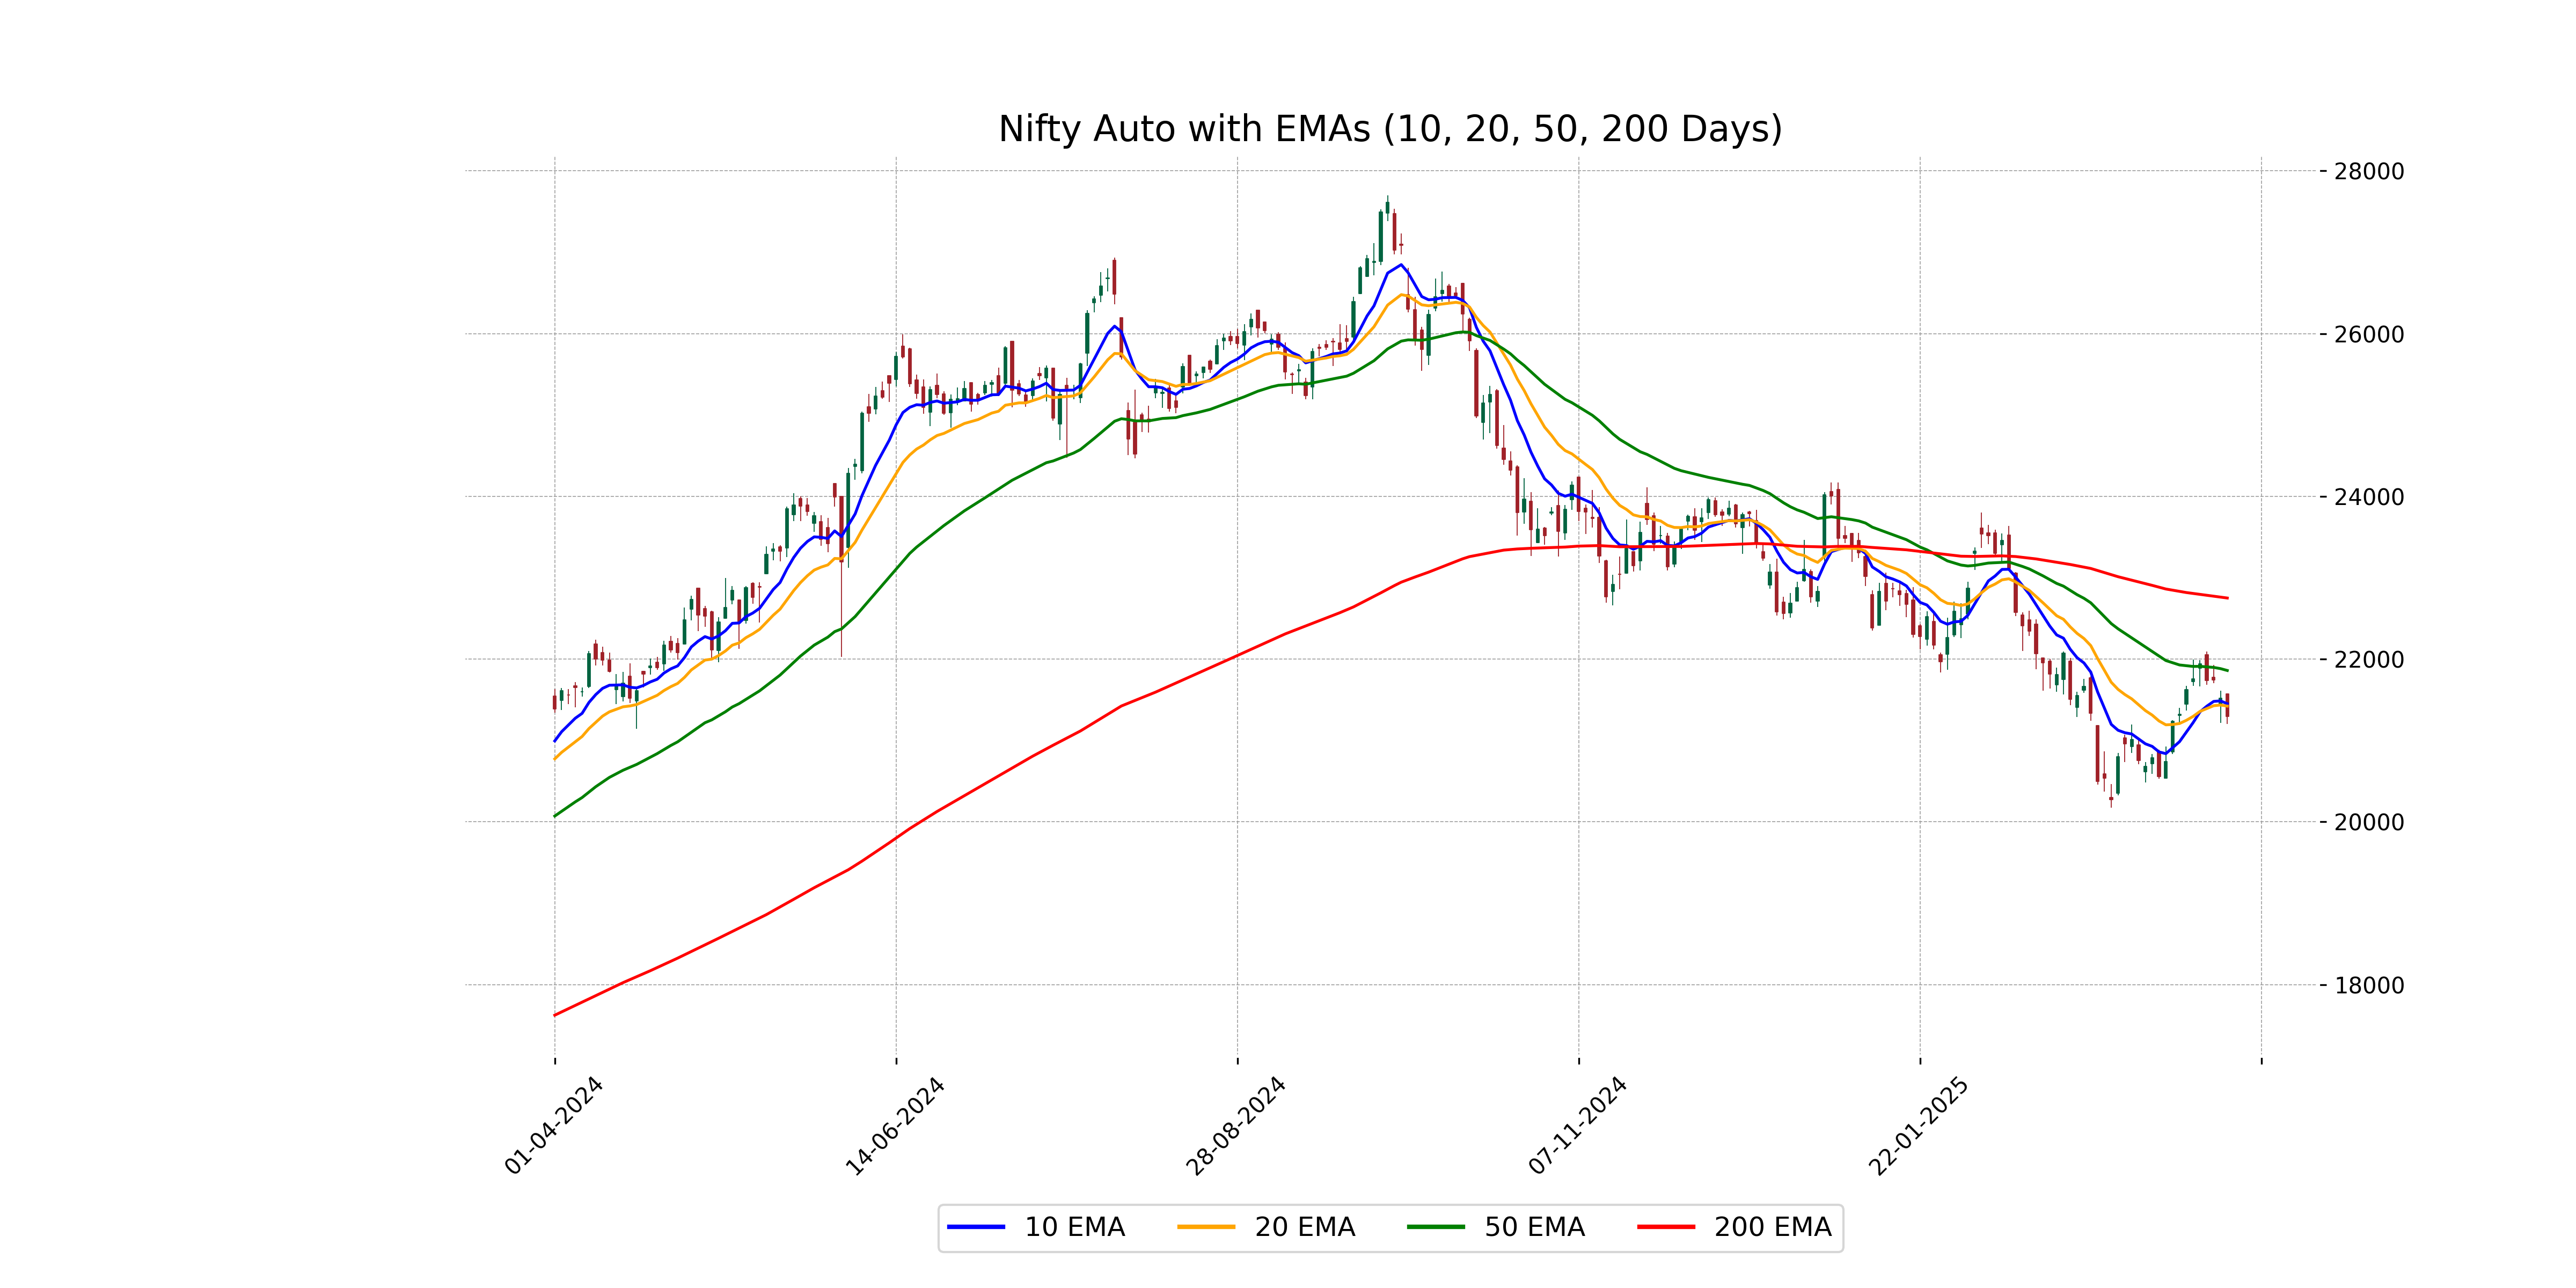
Relationship with Key Moving Averages
The Nifty Auto index closed at 21295.5, which is below its 10-day EMA of 21451.47, 20-day EMA of 21421.74, and significantly below the 50-day and 200-day EMAs of 21859.41 and 22750.02, respectively. This suggests a bearish trend as the index price is below key short-term and long-term moving averages.
Moving Averages Trend (MACD)
MACD Analysis for Nifty Auto: The MACD value of -56.02 suggests that Nifty Auto is in a bearish trend, as it is below the MACD Signal of -170.92. This indicates that there might be more selling pressure in the short term.

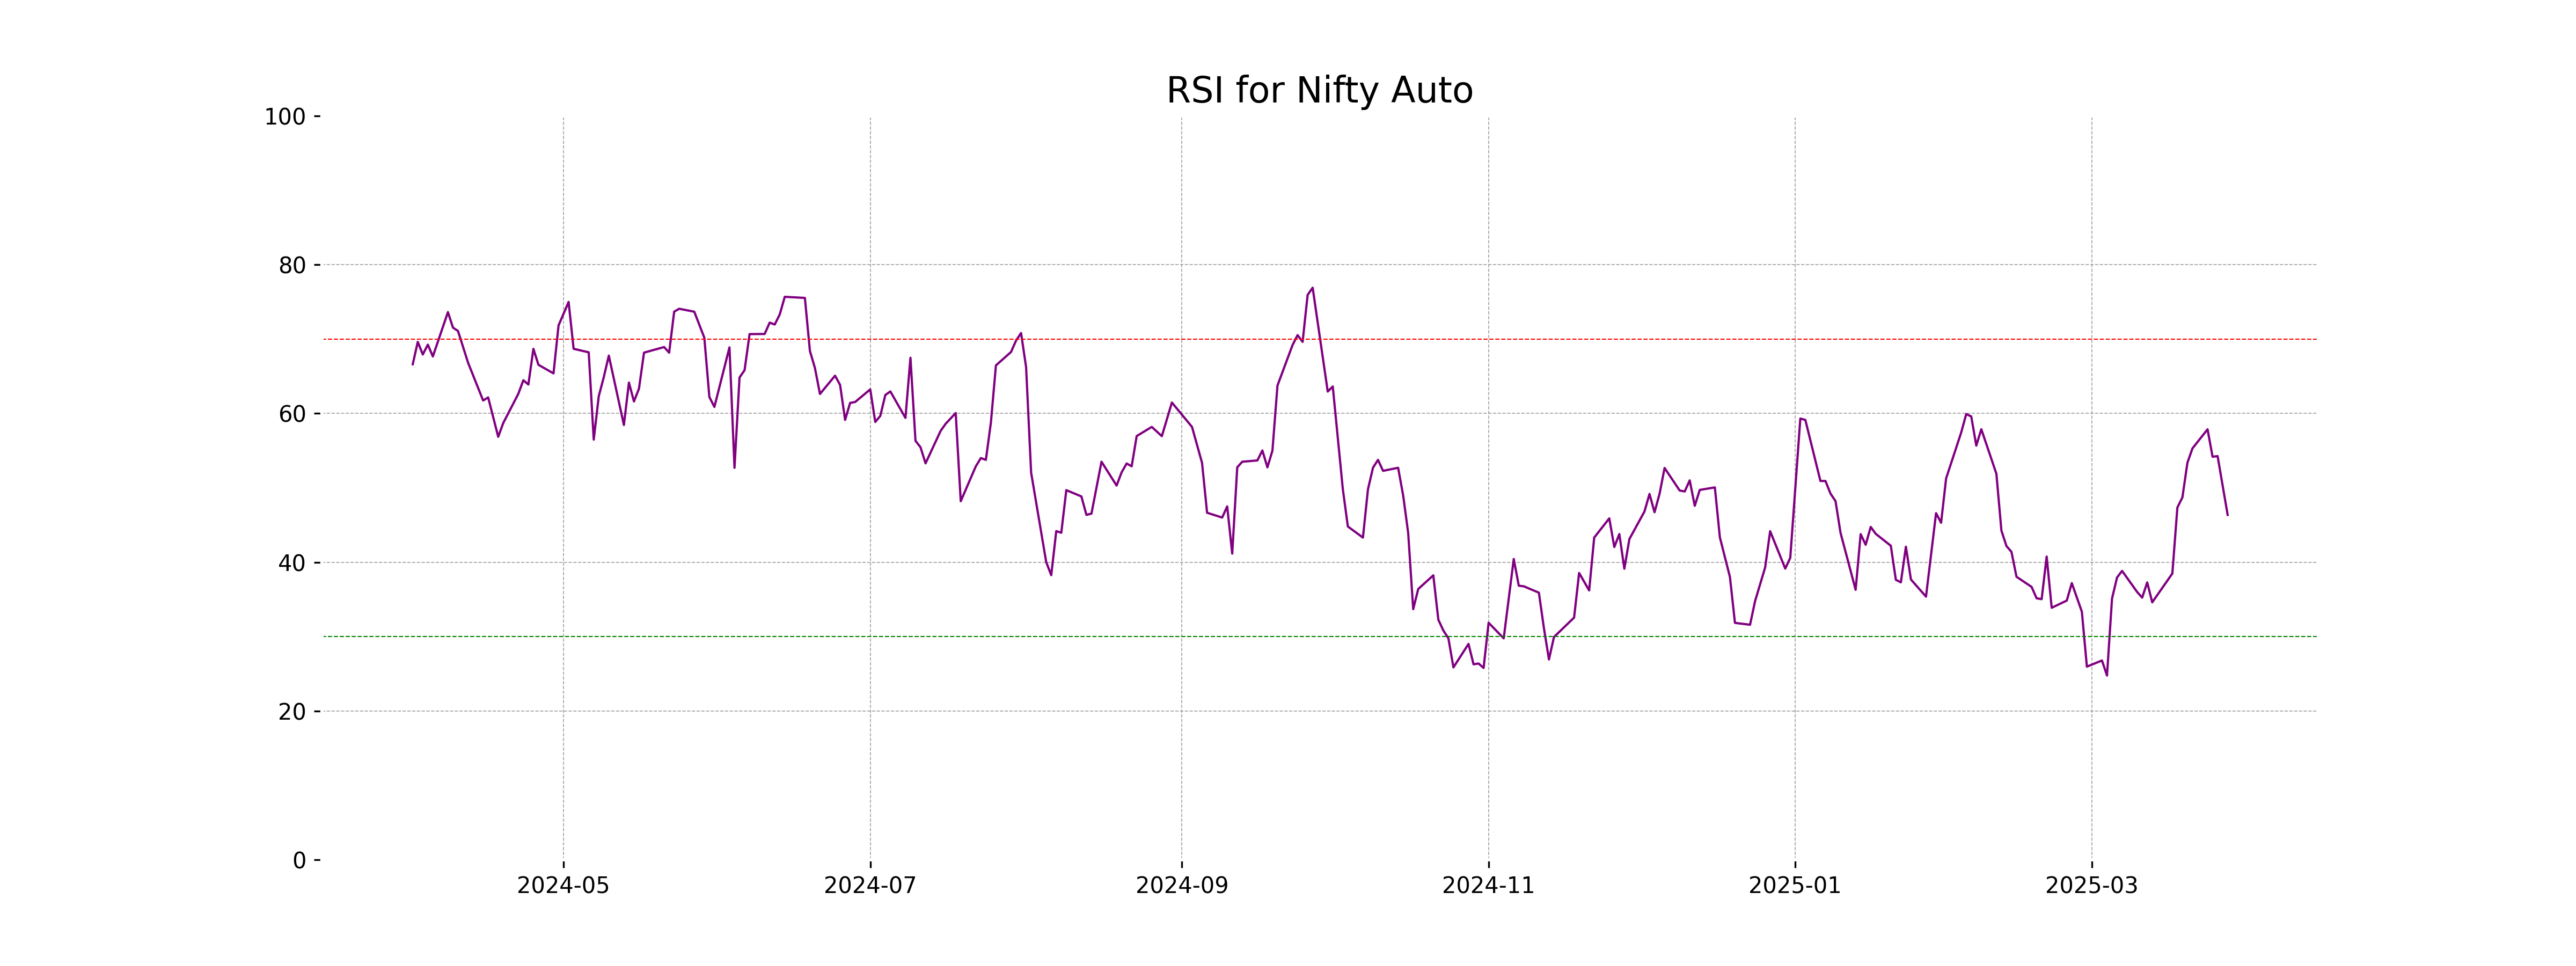
RSI Analysis
The RSI (Relative Strength Index) for Nifty Auto is 46.36, which suggests that the index is in a neutral zone. This indicates neither overbought nor oversold conditions, implying that there are no strong signals for reversal or continuation, and market participants may look for additional indicators for clearer market direction.
Analysis for Nifty Energy - March 28, 2025

Nifty Energy opened at 33,771.45 and closed at 33,571.60, showing a decrease with a percentage change of -0.33% and a points change of -111.35 from the previous close of 33,682.95. The RSI stands at 61.70, suggesting moderate momentum, while the MACD is above the signal line, indicating potential bullish movement. The volumes remained at zero, thus providing no additional insight from trading activity.

Relationship with Key Moving Averages
Nifty Energy is trading below its 50 EMA at 33,571.60, indicating a possible downtrend in the short term. However, it remains above the 20 EMA and 10 EMA, which could provide some support. The current level is significantly below the 200 EMA, highlighting ongoing bearish pressure in the longer term.
Moving Averages Trend (MACD)
Nifty Energy MACD Analysis: The current MACD value for Nifty Energy is significantly above its MACD Signal (468.80 vs. 218.18), suggesting a strong upward momentum. This indicates a bullish signal, as the disparity between the MACD and its signal line reflects increased buying pressure.

RSI Analysis
The RSI value for Nifty Energy is 61.70, indicating that the stock is neither overbought nor oversold at the moment, but is leaning towards the higher end of the neutral range. This suggests a potential continuation of the current trend unless other indicators provide contradictory signals.

Analysis for Nifty FMCG - March 28, 2025

The Nifty FMCG index opened at 53,198.80 and closed slightly higher at 53,589.80. It experienced a percent change of approximately 0.59% and a points change of 313.20. The index shows modest upward momentum with indicators such as MACD at 6.30 and the RSI at 59.45, suggesting it is in the mildly bullish zone. The 50-day EMA is slightly higher than the closing price, indicating the price is nearing resistance.

Relationship with Key Moving Averages
The Nifty FMCG index closed at 53,589.80, which is slightly below its 50-day EMA of 53,609.05, suggesting it is trading near its recent average price levels. It is significantly below the 200-day EMA of 56,245.04, indicating potential long-term weakness. However, it is above both the 10-day EMA of 52,925.12 and the 20-day EMA of 52,747.19, showing short-term strength.
Moving Averages Trend (MACD)
Nifty FMCG MACD Analysis: The MACD value for Nifty FMCG is 6.30 with a MACD Signal of -282.22, indicating a potential upward momentum as the MACD line is above the MACD Signal line. This crossover suggests that there might be a bullish trend developing.

RSI Analysis
The Nifty FMCG index has an RSI of 59.45, indicating a moderately strong momentum. With an RSI below 70, it suggests that the index is not overbought, allowing room for potential upward movement. However, the level is not low enough to consider it oversold either.

Analysis for Nifty Infra - March 28, 2025

Nifty Infra opened at 8505.95 and closed at 8457.80, showing a decrease with a percentage change of -0.28% and a points change of -24.10. The RSI value of 66.17 indicates a relatively strong performance, while the MACD value of 117.84 suggests a bullish trend compared to its signal line of 58.08. The stock is trading above its 50, 10, and 20 EMAs but slightly below the 200 EMA.

Relationship with Key Moving Averages
The closing price of Nifty Infra at 8457.80 is above the 50-day EMA of 8198.16 and slightly above the 200-day EMA of 8404.47, indicating a generally upward trend. However, it is also higher than the 10-day EMA of 8334.65 and the 20-day EMA of 8212.44, suggesting recent momentum in the stock's price.
Moving Averages Trend (MACD)
The MACD for Nifty Infra is 117.84, which is higher than the MACD Signal of 58.08. This indicates a potential bullish trend, suggesting that the stock may continue to experience upward momentum.

RSI Analysis
The current RSI for Nifty Infra is 66.17, which suggests that the index is approaching the overbought territory. This could indicate potential caution for new investments as the index has shown significant positive momentum recently.

Analysis for Nifty IT - March 28, 2025

Nifty IT opened at 37376.60 and closed at 36886.15, marking a decrease of 1.76% in value, with a points change of -662.15. The Relative Strength Index (RSI) is at 38.75, indicating a bearish momentum, and the Moving Average Convergence Divergence (MACD) is negative, which suggests a bearish trend continuation.

Relationship with Key Moving Averages
Nifty IT is trading below its key moving averages, with a current close of 36886.15. This is under the 10 EMA (37151.56), 20 EMA (37625.02), 50 EMA (39358.82), and 200 EMA (40057.34), indicating potential bearish momentum. The RSI of 38.76 further suggests it is nearing oversold territory.
Moving Averages Trend (MACD)
The current MACD for Nifty IT is -816.98, while the MACD Signal is -1057.02, indicating a negative divergence. This suggests a bearish momentum as the MACD line is above the signal line, possibly hinting at an upcoming bearish trend reversal or a continuation of the current downtrend.

RSI Analysis
The RSI of Nifty IT is currently 38.76, which indicates that the index is approaching oversold territory. Typically, an RSI below 30 suggests an oversold condition, while a value above 70 indicates overbought conditions. Therefore, investors may monitor for potential buying opportunities if the RSI continues to decrease.

Analysis for Nifty Metal - March 28, 2025

Nifty Metal opened at 9172.9 and closed at 9092.5, experiencing a decline of approximately -0.73% compared to the previous close of 9159.8. The index had a high of 9235.2 and a low of 9045.1 during the trading session. The 10-day EMA is 9079.87, indicating a close proximity to the closing price, suggesting potential stabilization.

Relationship with Key Moving Averages
The closing price of Nifty Metal is 9092.5, which is above the 10 EMA of 9079.87, indicating a short-term bullish trend. However, it remains significantly higher than both the 50 EMA at 8762.59 and the 200 EMA at 8821.19, suggesting a stronger sustained uptrend over longer periods.
Moving Averages Trend (MACD)
Based on the provided data, Nifty Metal's MACD (180.54) is above the MACD Signal line (172.85), suggesting a bullish momentum. This indicates that the stock could be in an upward trend, as the MACD line crossing above the Signal line often serves as a buy signal for traders.

RSI Analysis
The RSI for Nifty Metal is 59.43, indicating that the stock is in a neutral zone. It is neither overbought nor oversold, suggesting a balanced momentum in the current trend.

Analysis for Nifty Bank - March 28, 2025

Nifty Bank opened at 51,608.40 and closed slightly lower at 51,564.85, marking a marginal decrease of -0.021% from the previous close. The day's range saw a high of 51,839.10 and a low of 51,335.35. The technical indicators show a Relative Strength Index (RSI) of 69.80, suggesting a near overbought condition, while the MACD is significantly above its signal line, indicating bullish momentum.

Relationship with Key Moving Averages
The Nifty Bank's close price of 51,564.85 is above all key moving averages, including the 50 EMA (49,743.46), 200 EMA (49,986.60), 10 EMA (50,691.73), and 20 EMA (50,013.69), indicating a bullish trend. The RSI value of 69.80 suggests the index is near overbought territory.
Moving Averages Trend (MACD)
The MACD for Nifty Bank is at 663.67, while the MACD Signal is 316.90, indicating a bullish momentum as the MACD line is above the signal line. The significant gap between them suggests strong upward momentum in recent sessions.

RSI Analysis
The RSI for Nifty Bank is 69.80, which indicates that the stock is approaching overbought territory. This suggests that there may be limited room for upward movement, and a potential pullback could occur if buying pressure diminishes.

Analysis for Nifty 50 - March 28, 2025
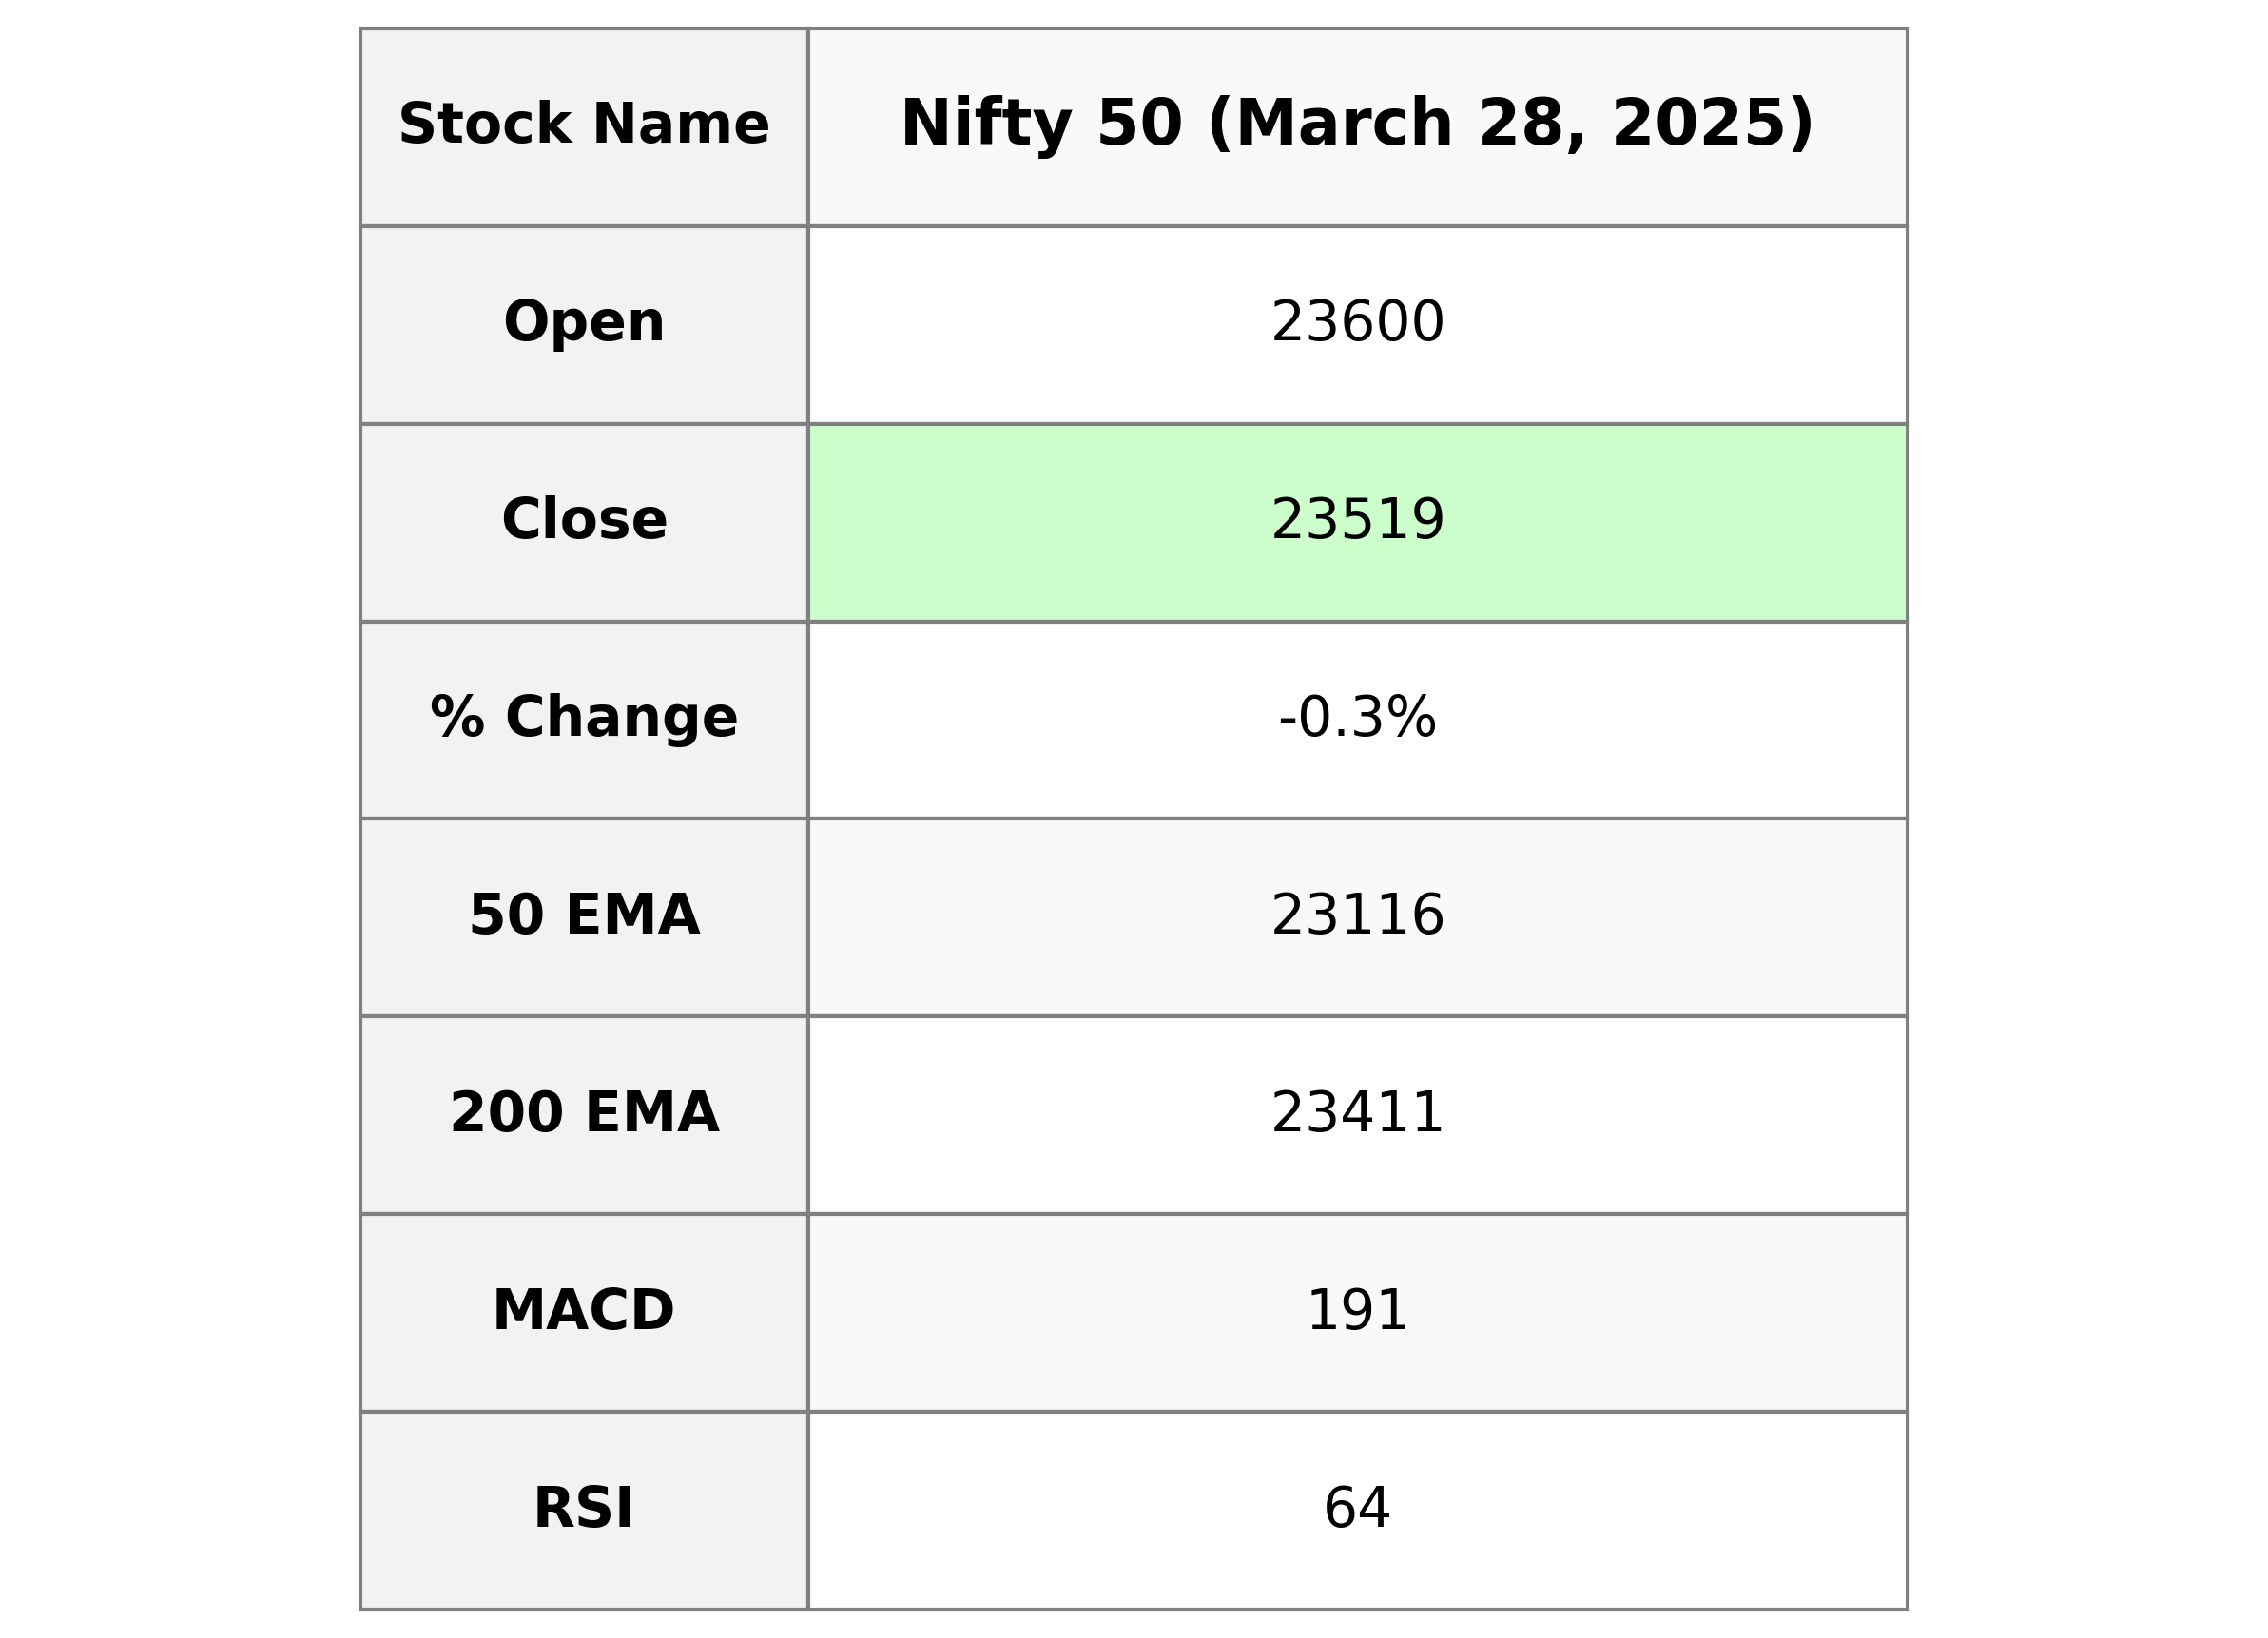
Nifty 50 opened at 23600.40 and closed at 23519.35, witnessing a decline of 72.60 points or -0.31% from its previous close of 23591.95. The Relative Strength Index (RSI) stands at 64.07, indicating moderate momentum, while the Moving Average Convergence Divergence (MACD) is at 190.96, suggesting bullish sentiment compared to its signal line at 60.93.

Relationship with Key Moving Averages
The Nifty 50 index closed at 23,519.35, which is above both its 50-day EMA of 23,115.95 and 200-day EMA of 23,410.85, indicating a potential bullish trend. However, it is below its 10-day EMA of 23,299.32, which may suggest short-term weakness.
Moving Averages Trend (MACD)
The MACD for Nifty 50 is 190.96, which is significantly above the MACD Signal line of 60.93. This suggests a bullish trend, indicating that the momentum may continue to favor the upside in the near term.

RSI Analysis
Based on the given data, the RSI for Nifty 50 is 64.07. This value suggests that the index is in the neutral-to-overbought range, indicating that it has some bullish momentum but is not yet in extreme overbought territory. Investors may want to monitor for potential pullbacks or consolidations.
