Top 5 Nifty 50 gainers today – April 11, 2025: Biggest stock moves
In this article, we will explore the technical indicators of some of the high-performing stocks on the Indian stock market, including COALINDIA, HINDALCO, JSWSTEEL, and TATASTEEL.
By looking at these stocks through the lens of key technical factors, we aim to better understand their price movements, trends, and potential future performance.

Analysis for Coal India - April 11, 2025

Coal India Performance Summary: Coal India exhibited a notable increase in its stock price with a closing value of 392.10, representing a 4.67% change from the previous close. The stock's market capitalization stands at approximately 2.42 trillion INR. With a PE Ratio of 7.04 and EPS of 55.7, the company operates within the Energy sector, focusing on Thermal Coal in India. Key technical indicators like the RSI and MACD reflect a moderate bullish momentum.

Relationship with Key Moving Averages
Coal India is trading above its 50 EMA of 384.37 and 10 EMA of 387.71, indicating a short-term uptrend, as it has closed at 392.10. However, it remains below the 200 EMA of 400.12, suggesting a possible long-term resistance.
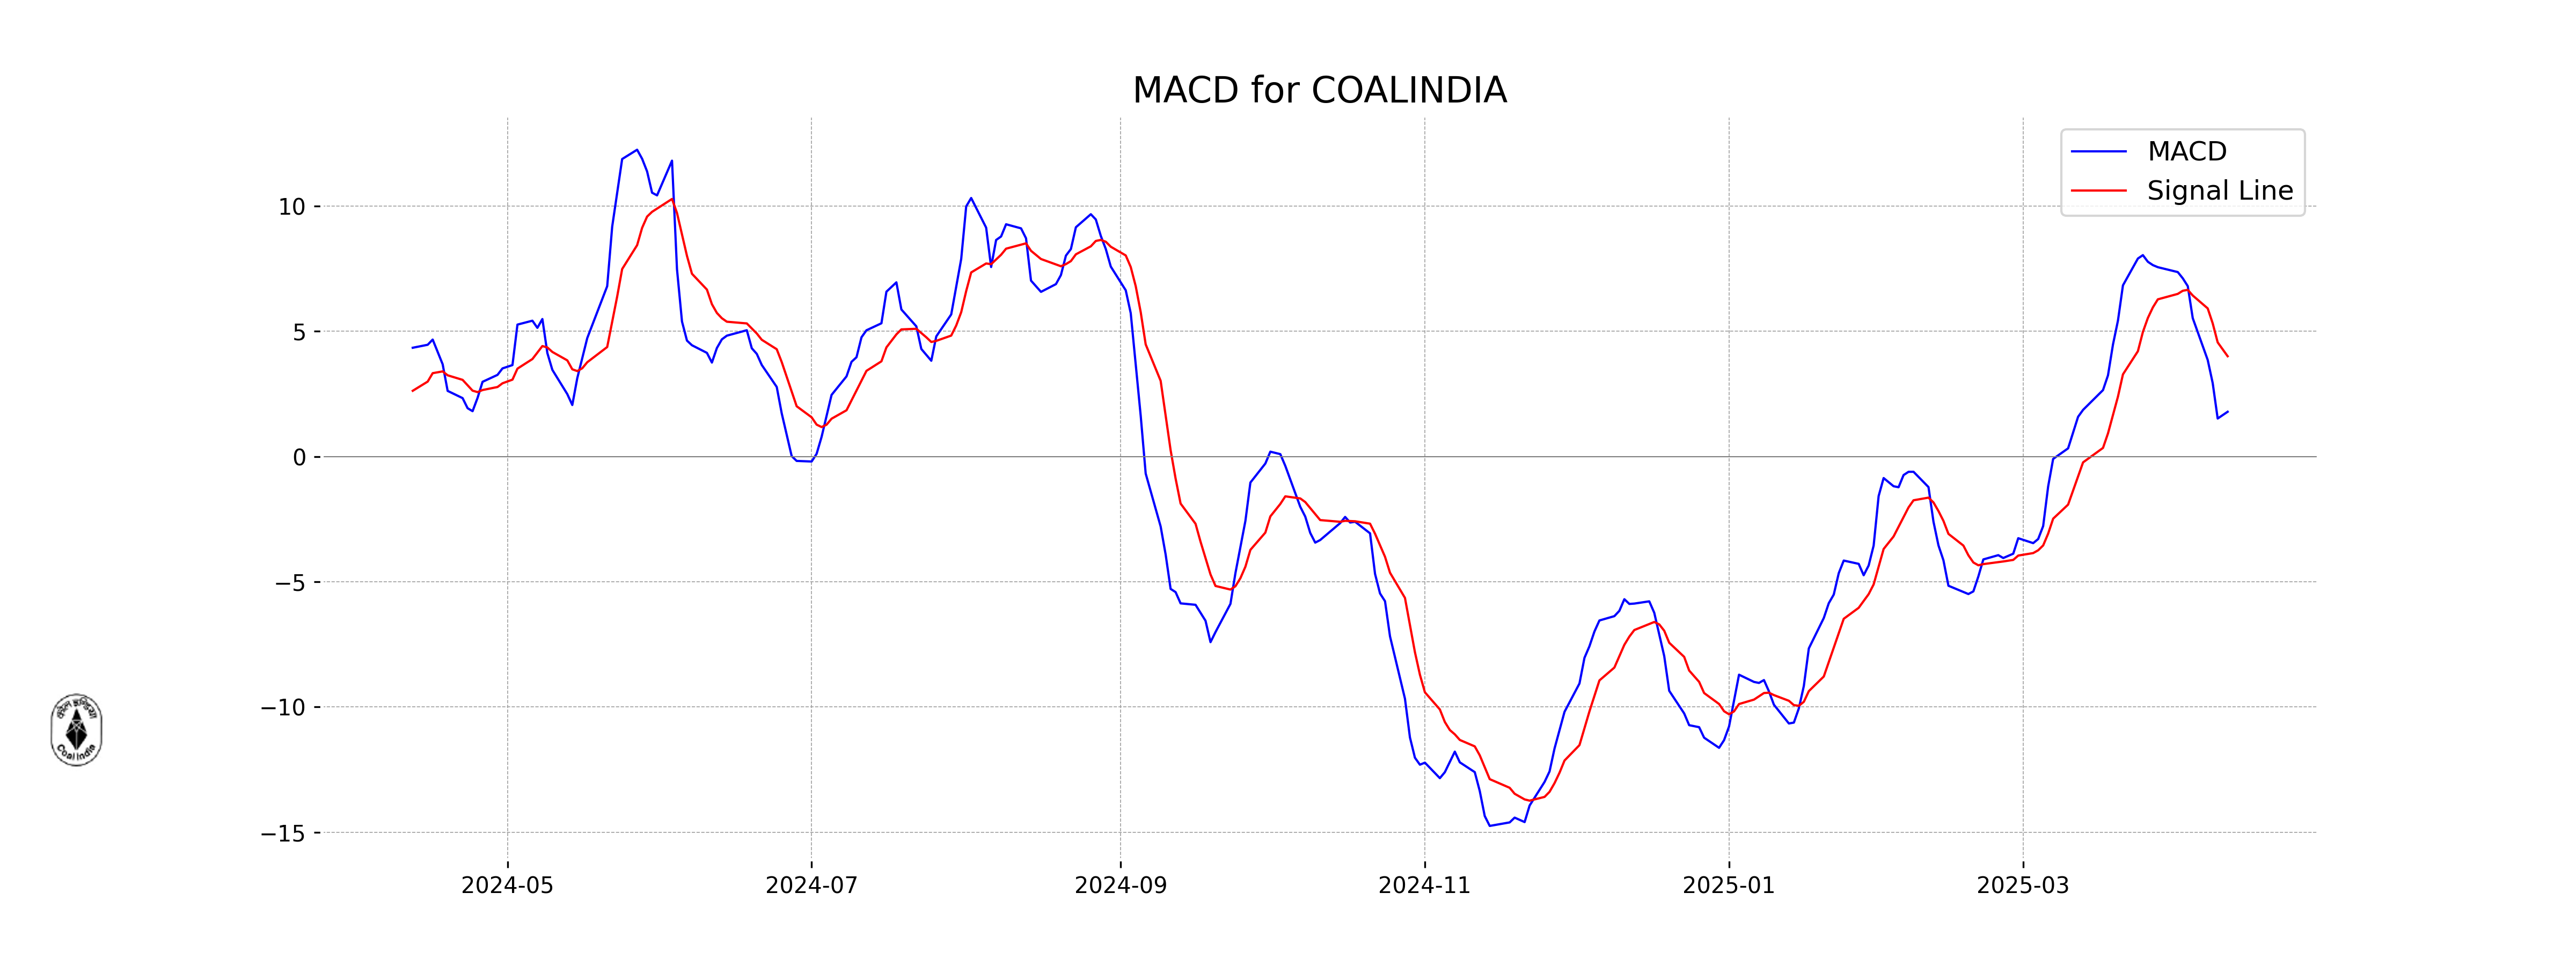
Moving Averages Trend (MACD)
MACD Analysis for Coal India: The MACD value of 1.7855 is below the MACD Signal of 4.0014, indicating a potential bearish signal. This suggests that Coal India's momentum may be weakening, and a further downward movement could occur if the trend persists.
RSI Analysis
The RSI (Relative Strength Index) for Coal India is 54.09, which suggests that the stock is neither overbought nor oversold. This indicates a neutral position, suggesting that there might be a balance between buyers and sellers at the current price level.

Analysis for HINDALCO - April 11, 2025

- Current Performance: Hindalco opened at 585.0 and closed at 600.3 with a high of 607.95 and a low of 576.10, marking a 6.44% increase from its previous close of 564.0, reflecting a positive momentum with a points change of 36.3. - Technical Indicators: Despite the recent gains, the stock's 50, 20, and 10 EMA values were above the closing price, suggesting a bearish trend. The RSI was at 39.07, indicating the stock is nearing oversold territory. Additionally, the MACD was negative, further indicating bearish conditions. - Valuation: Hindalco carries a PE Ratio of 9.62, which may suggest it is undervalued, supported by an EPS of 62.43. With a sector classification in basic materials, specifically aluminum, its market cap stands at 1,332,732,160,608, indicating its substantial presence in the Indian market.

Relationship with Key Moving Averages
Hindalco's current close price of 600.30 is below the 50-day and 200-day EMAs, indicating potential bearish sentiment in the medium to long term. Additionally, the close remains under the 10-day and 20-day EMAs, suggesting pressure in the short term as well.
Moving Averages Trend (MACD)
``` Hindalco's current MACD value is -18.53, which suggests a bearish trend as it is below the MACD Signal line of -4.07. This indicates that the stock might be experiencing downward momentum. ```

RSI Analysis
Hindalco's RSI is currently at 39.07, which indicates that the stock is approaching the oversold territory. This suggests that there might be potential for a price reversal or an upward movement if buying interest increases. However, investors should consider other technical indicators and market conditions before making decisions.

Analysis for JSW Steel - April 11, 2025

Performance of JSW Steel: JSW Steel experienced a notable gain, closing at 990.25 with a percentage change of 4.73% from its previous close. Despite this upward movement, the stock's technical indicators reveal some mixed signals, with an RSI of 46.62 suggesting near-neutral momentum and a negative MACD of -5.26 indicating potential bearish trends.

Relationship with Key Moving Averages
JSW Steel's closing price of 990.25 is below its 50-day EMA of 993.67 and slightly below its 10-day EMA of 996.03, indicating a slight downward momentum in the short term. However, it remains significantly above its 200-day EMA of 950.03, suggesting a continued longer-term bullish trend despite recent fluctuations.
Moving Averages Trend (MACD)
The MACD value for JSW Steel is -5.26, which is below the MACD Signal of 7.71, suggesting a bearish momentum. The negative divergence indicates a potential downtrend or continued weakness in the stock price. However, it's important to consider other indicators, such as RSI and EMAs, for a comprehensive analysis.

RSI Analysis
The RSI value for JSW Steel is 46.62, which suggests that the stock is approaching the neutral zone, indicating neither overbought nor oversold conditions. A typical RSI range is between 30 and 70, with values below 30 indicating potential undervaluation and above 70 indicating possible overvaluation.

Analysis for Tata Steel - April 11, 2025

Tata Steel Performance: Tata Steel experienced a positive change of 4.91% with the stock closing at 133.42, surpassing the previous close of 127.18. Despite trading below its EMA levels, indicating potential downward pressure, its RSI is at 36.27, suggesting that the stock is nearing an oversold condition. The company operates in the Basic Materials sector and Steel industry in India with a PE Ratio of 60.37 and a Market Cap of 1,663,987,482,624.

Relationship with Key Moving Averages
Tata Steel's current price of 133.42 is below significant moving averages, with the 50 EMA at 143.53 and the 200 EMA at 144.99. This indicates a potential bearish trend, suggesting the stock is trading lower compared to its average prices over long-term periods.
Moving Averages Trend (MACD)
For Tata Steel, the current MACD value is -3.07, which is below the MACD Signal of 0.54. This suggests bearish momentum, as the MACD line is below the signal line, indicating potential downward pressure on the stock price.

RSI Analysis
Tata Steel RSI Analysis: The Relative Strength Index (RSI) for Tata Steel is 36.27. An RSI below 30 typically indicates that a stock is oversold, while an RSI above 70 indicates that it is overbought. With an RSI of 36.27, Tata Steel is close to being oversold, suggesting potential buying interest if it trends lower.
