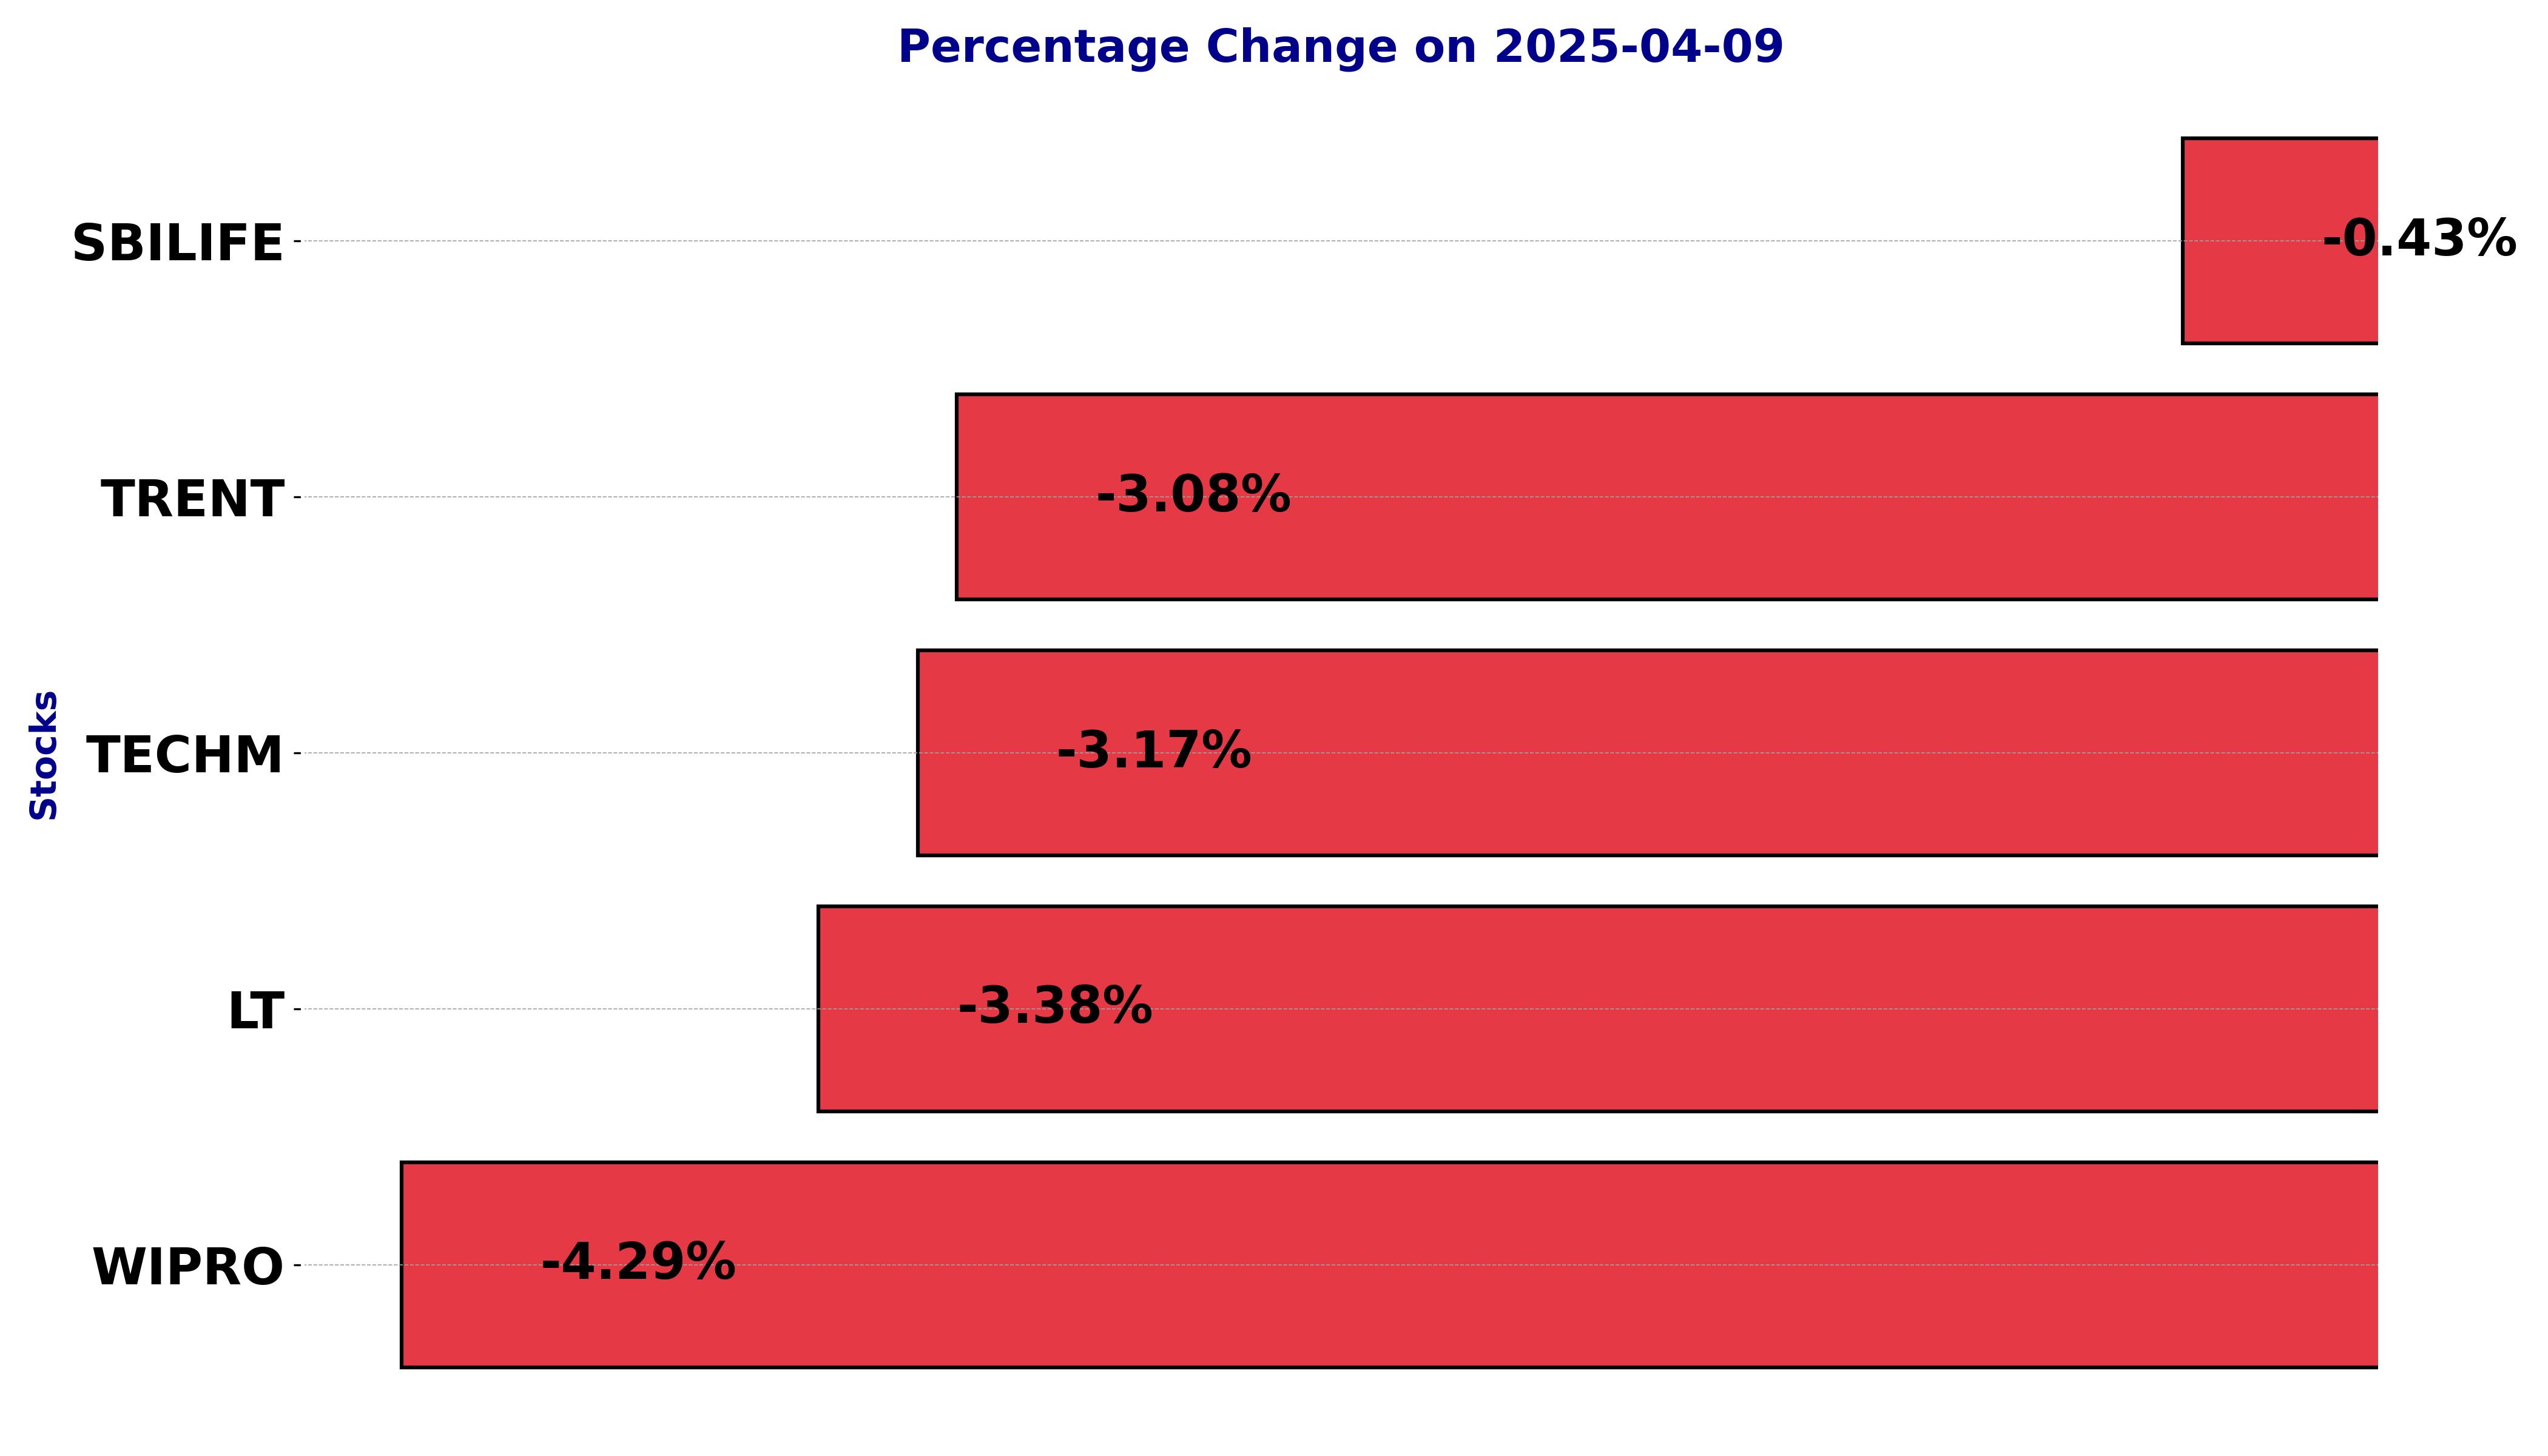
NSE Nifty 50: Top 5 stock losers of April 9, 2025
In this article, we will explore the technical indicators of some of the low-performing stocks on the Indian stock market, including LT, SBILIFE, TECHM, TRENT, and WIPRO.
By looking at these stocks through the lens of key technical factors, we aim to better understand their price movements, trends, and potential future performance.
Analysis for HCL Technologies - April 09, 2025
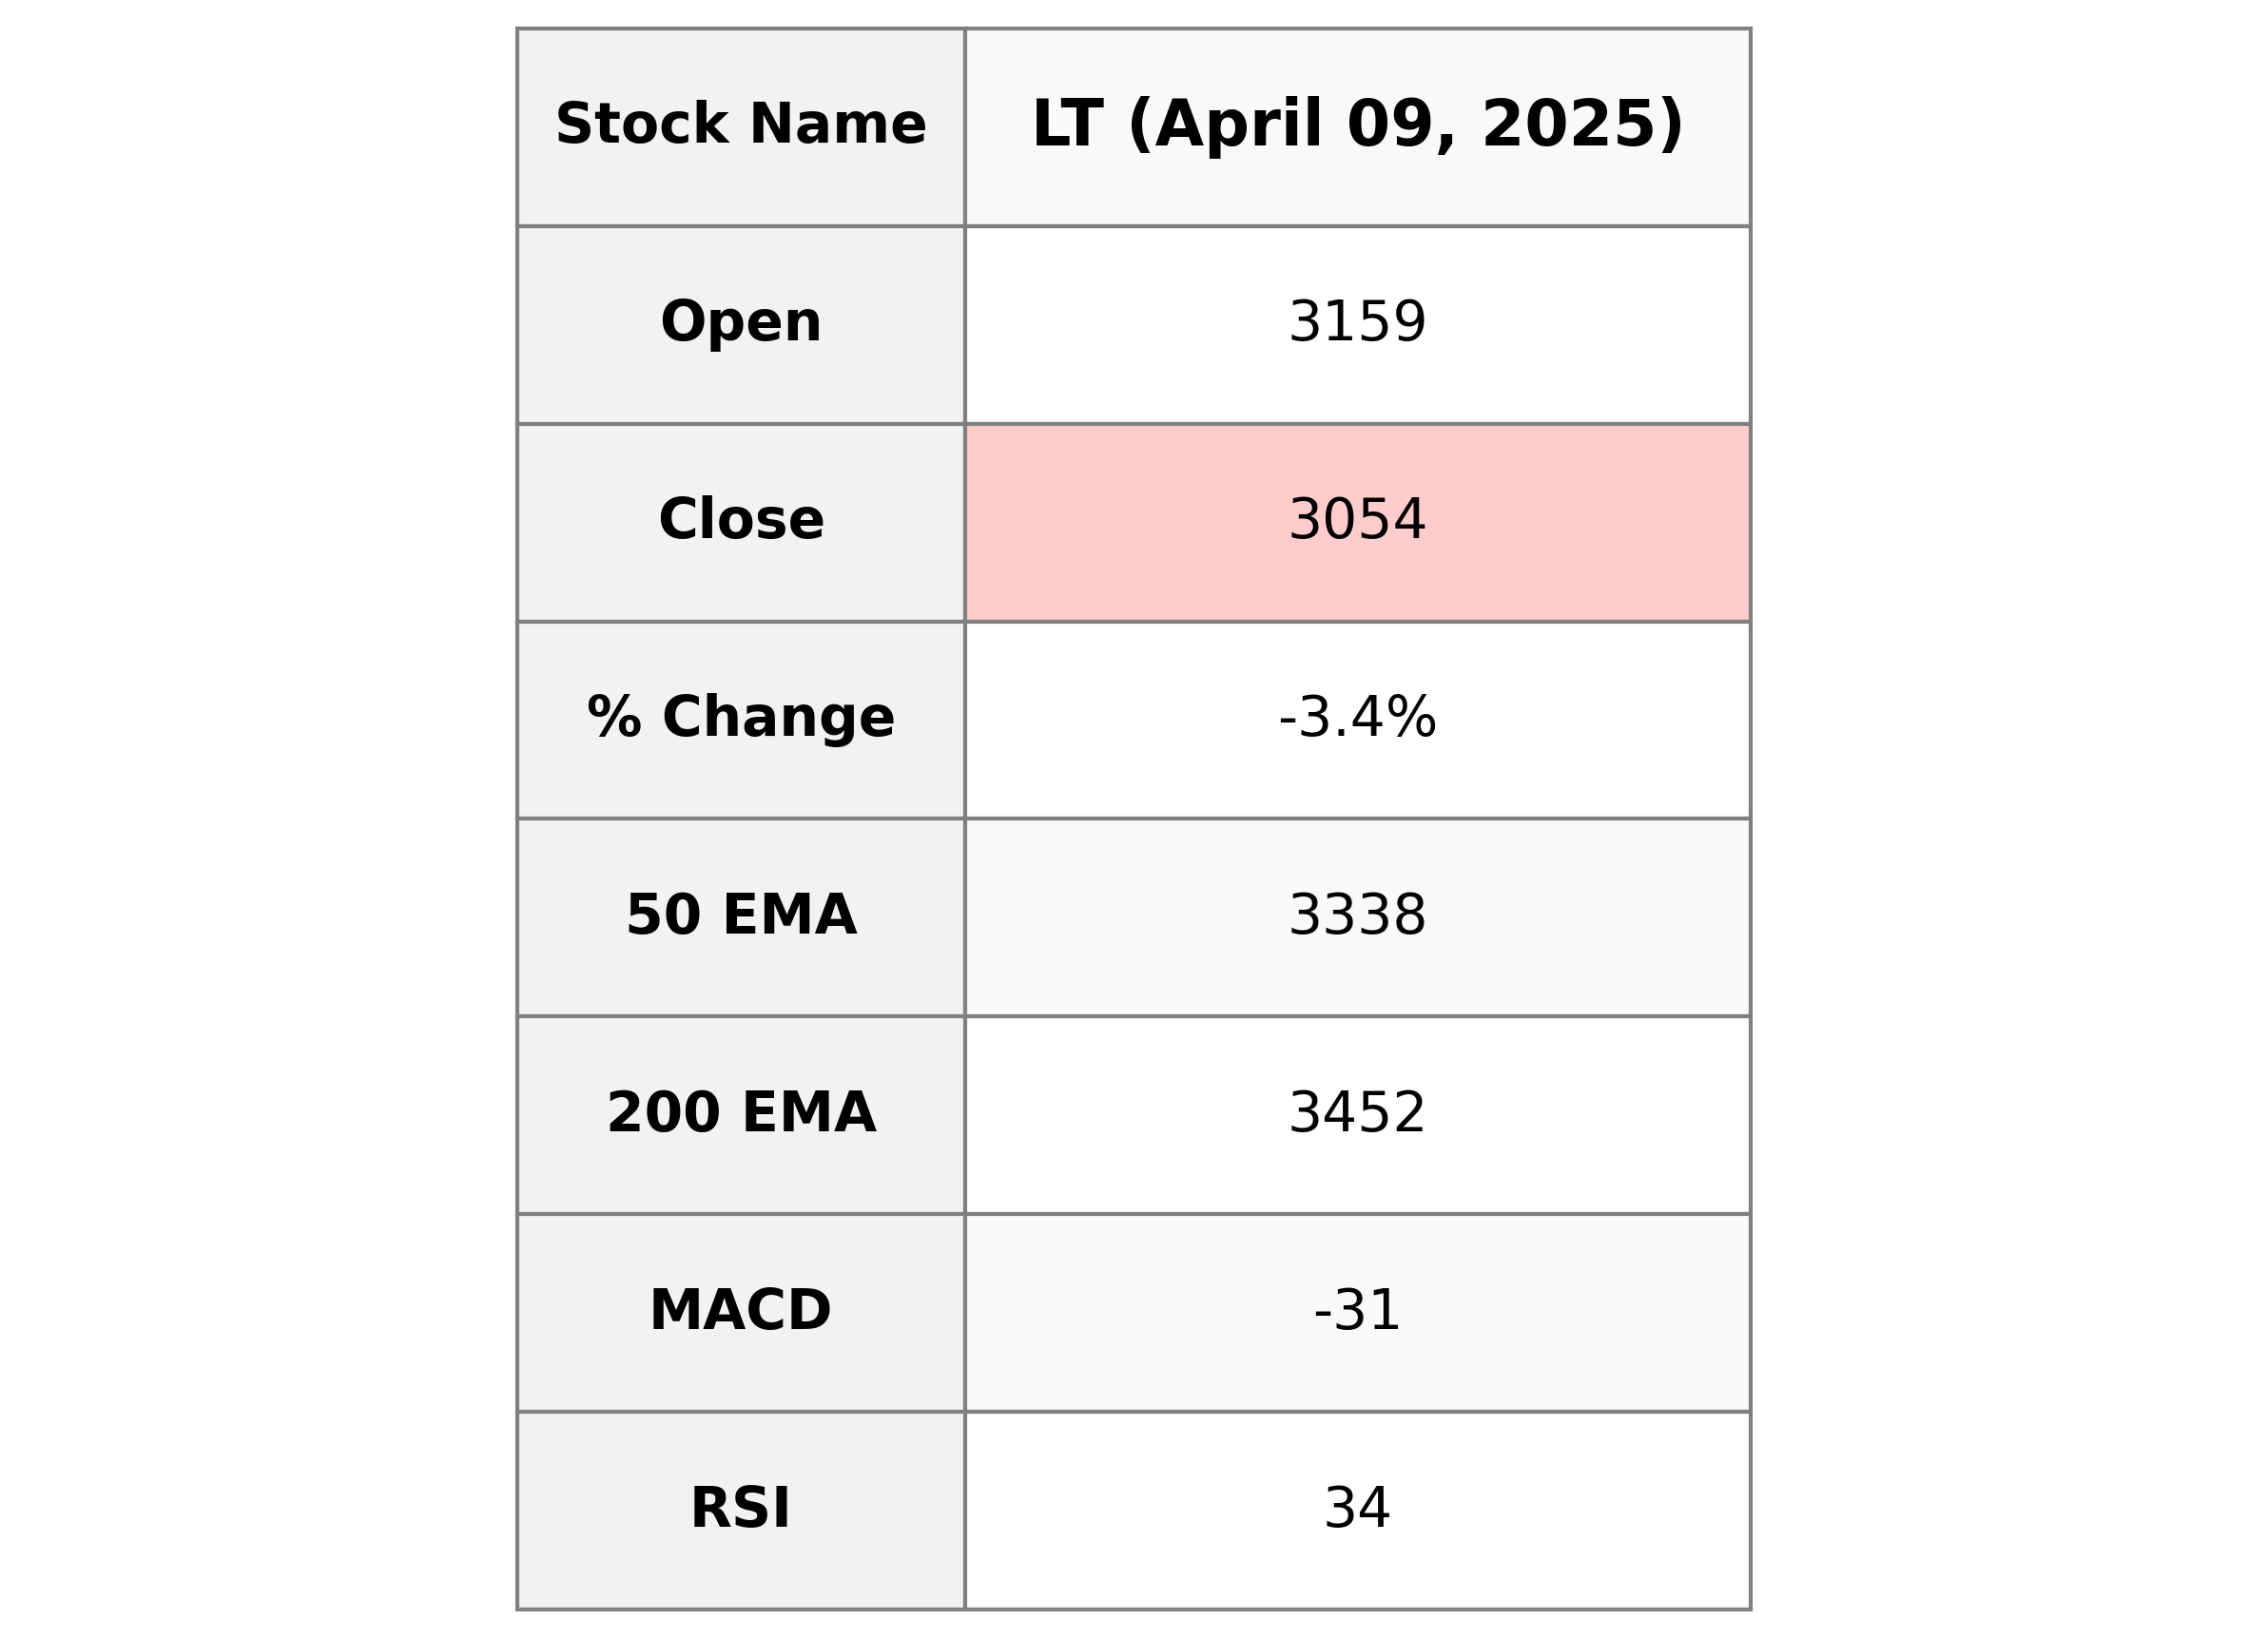
### Stock Performance Summary for HCL Technologies: - Price Movement: The stock has experienced a notable decline in its closing price at 3054.15, marking a decrease of approximately 3.38% from the previous close. This drop is indicative of a bearish trend for the day, with a significant points change of -106.95. - Technical Indicators: With a relative strength index (RSI) of 34.25, the stock is approaching the oversold territory, suggesting potential for a near-term rebound. The negative MACD indicates a bearish momentum. - Market & Financial Metrics: The stock is trading below its 50-day and 200-day exponential moving averages (EMA), suggesting a negative long-term trend. The market cap stands at approximately 4.2 trillion, with a PE ratio of 30.19 and EPS of 101.16, reflecting its valuation and profitability metrics within the Industrials sector.
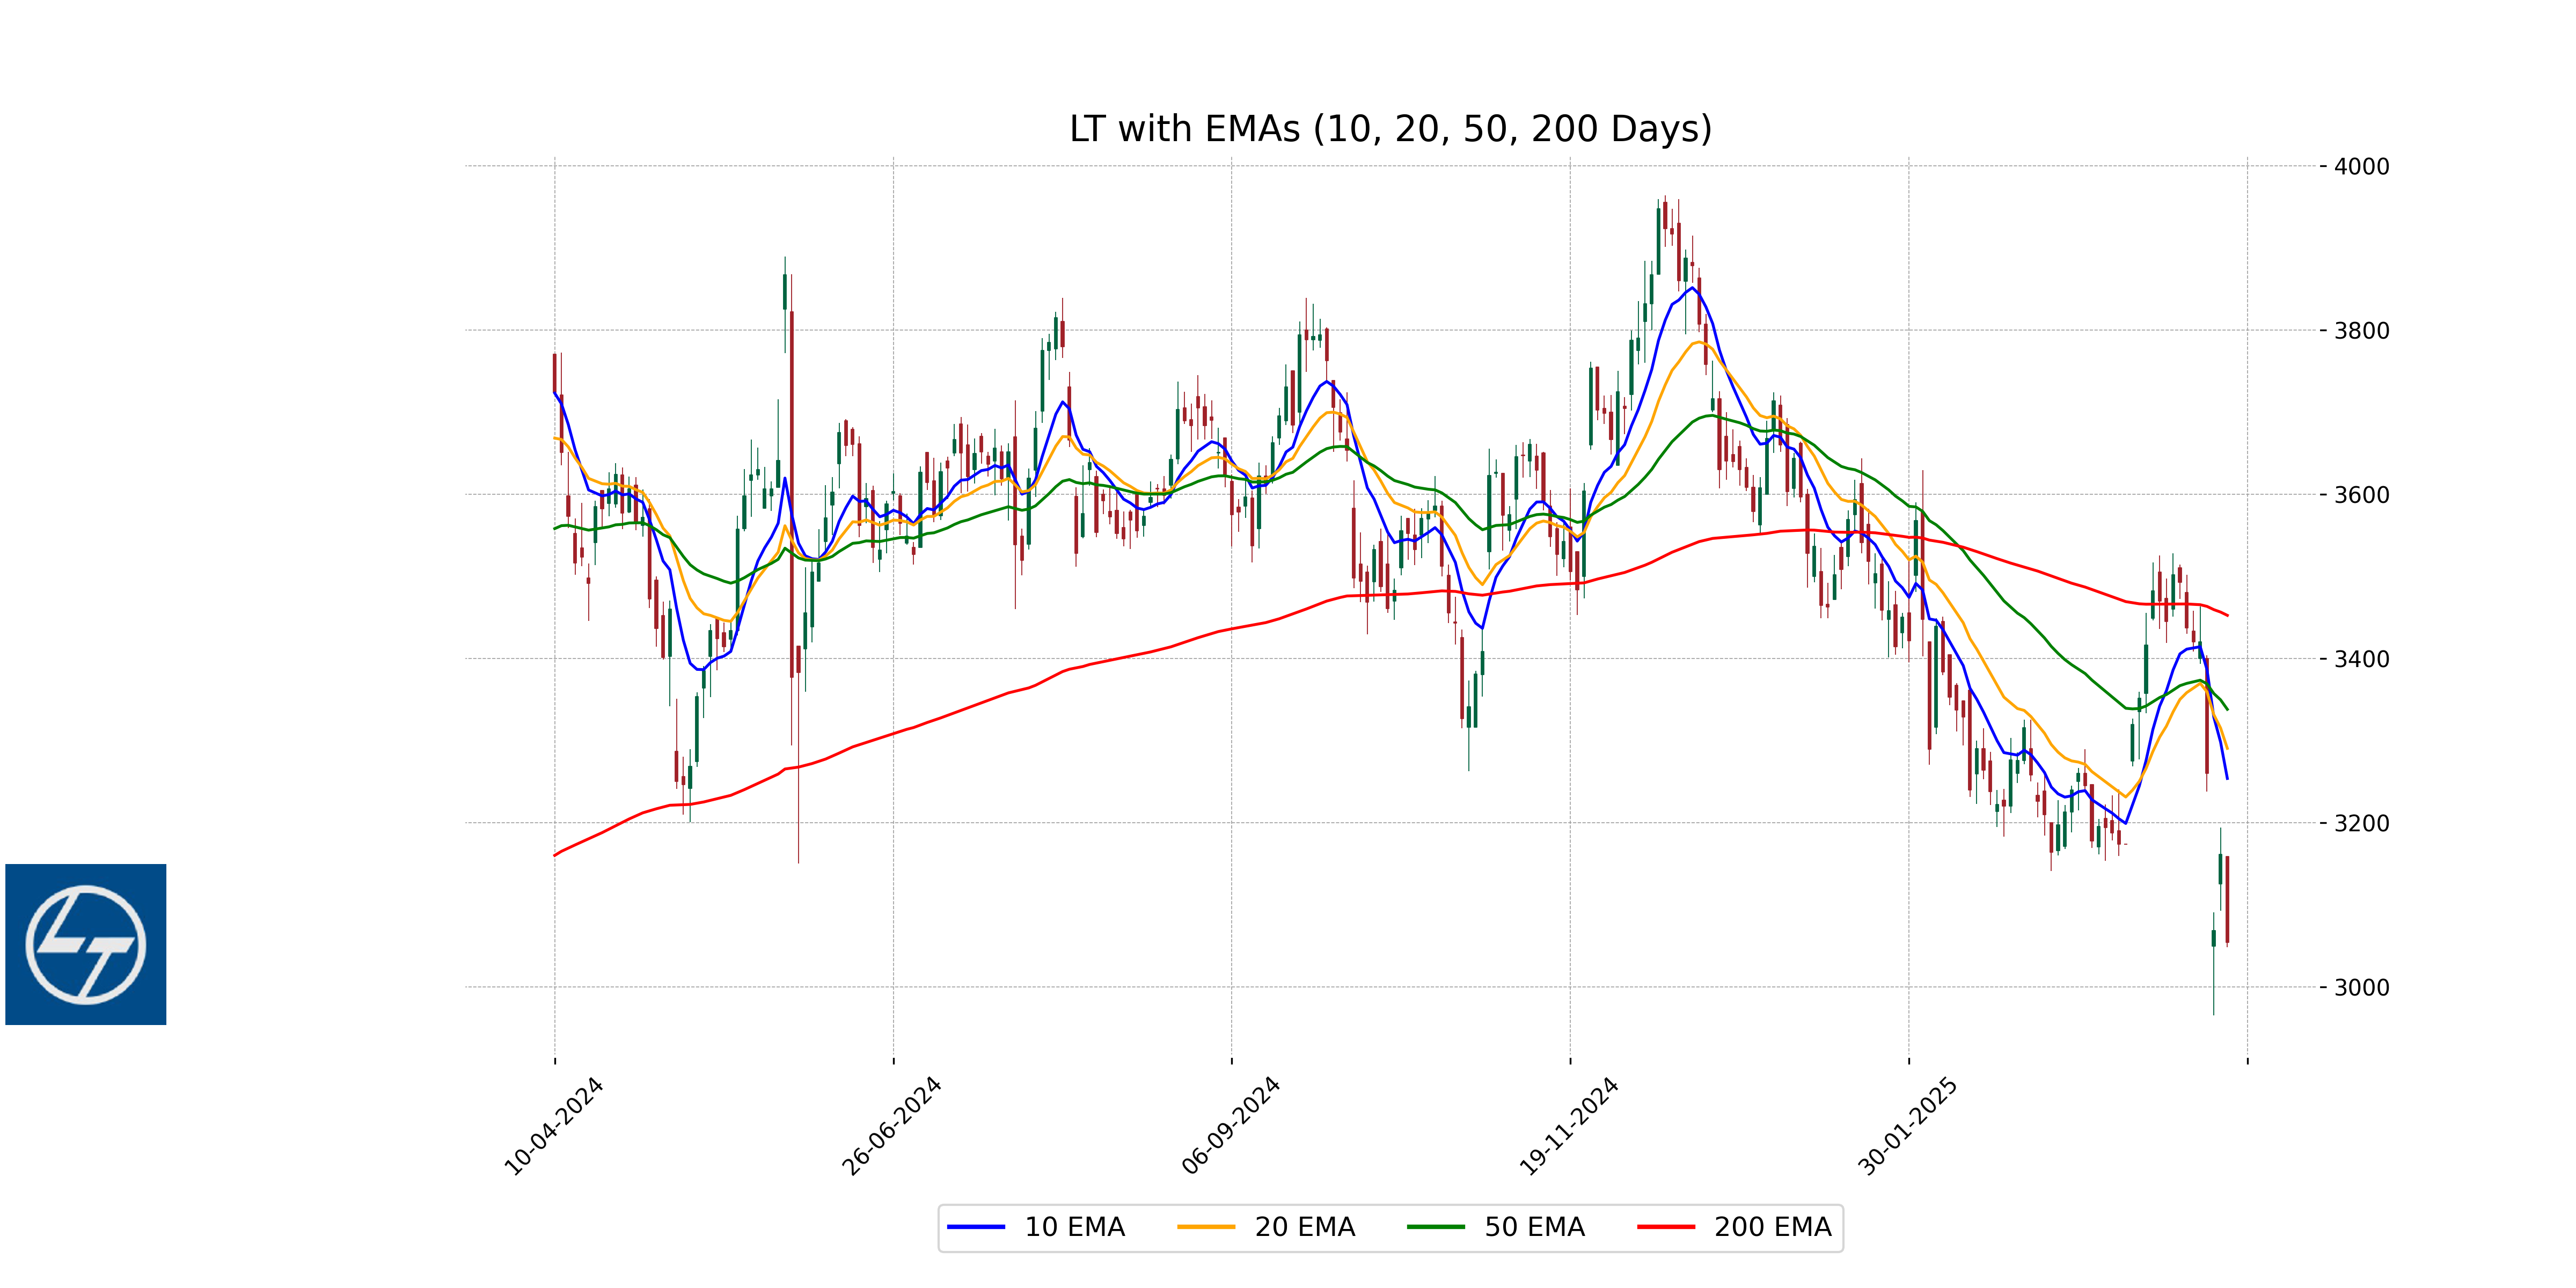
Relationship with Key Moving Averages
Larsen & Toubro Ltd (LT.NS) is currently trading below its key moving averages. The current closing price of 3054.15 is below the 10 EMA (3253.59), 20 EMA (3290.23), 50 EMA (3337.78), and 200 EMA (3452.22), indicating a bearish trend and potential downward pressure in the short to long term.
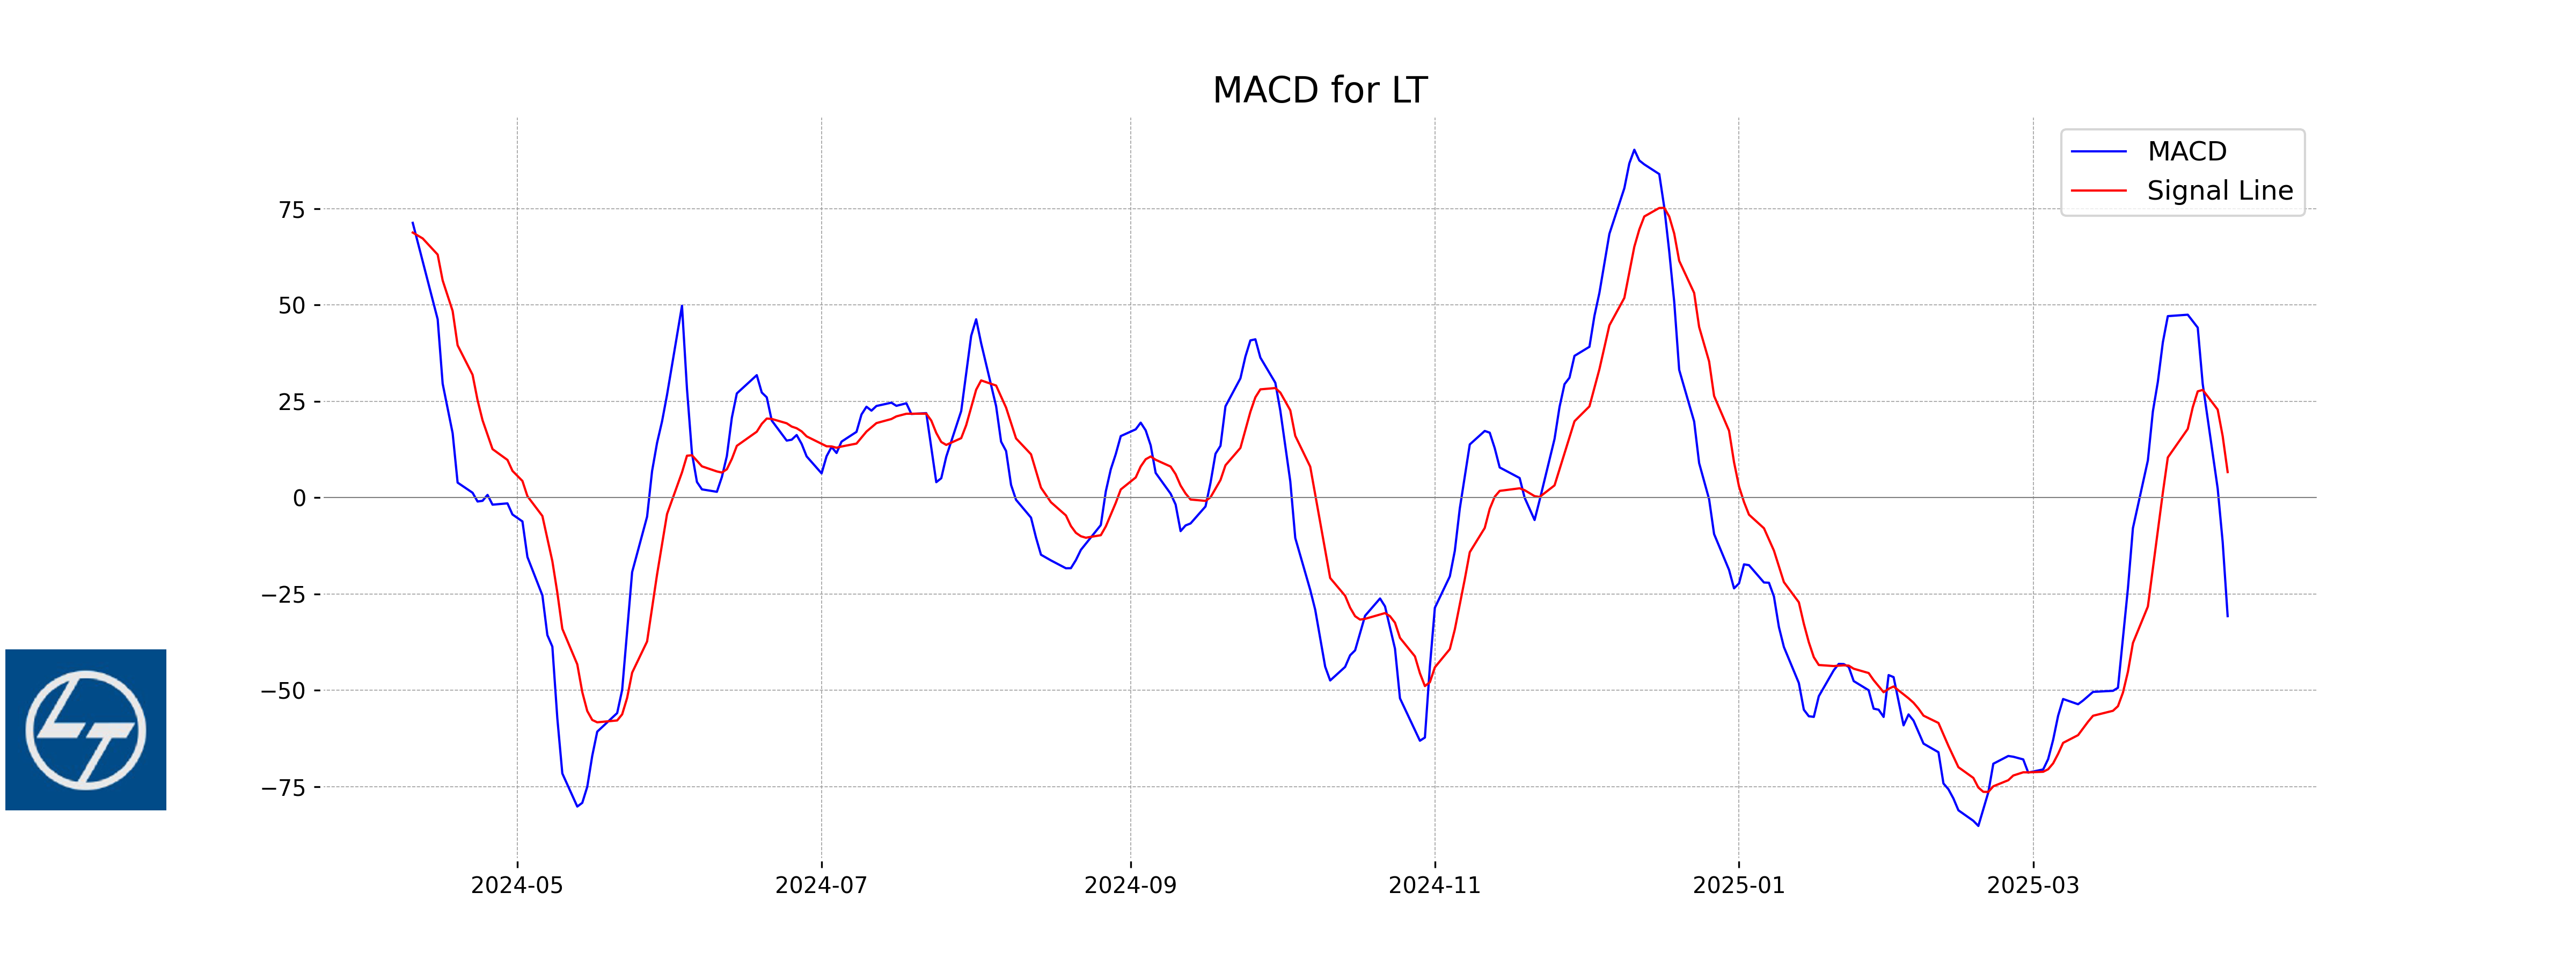
Moving Averages Trend (MACD)
The MACD for HCL Technologies indicates a bearish trend as the MACD line is positioned below the signal line. This suggests that selling pressure might be increasing, and the momentum is possibly shifting downwards. Investors should watch for potential reversal signals or further confirmation of the downtrend.
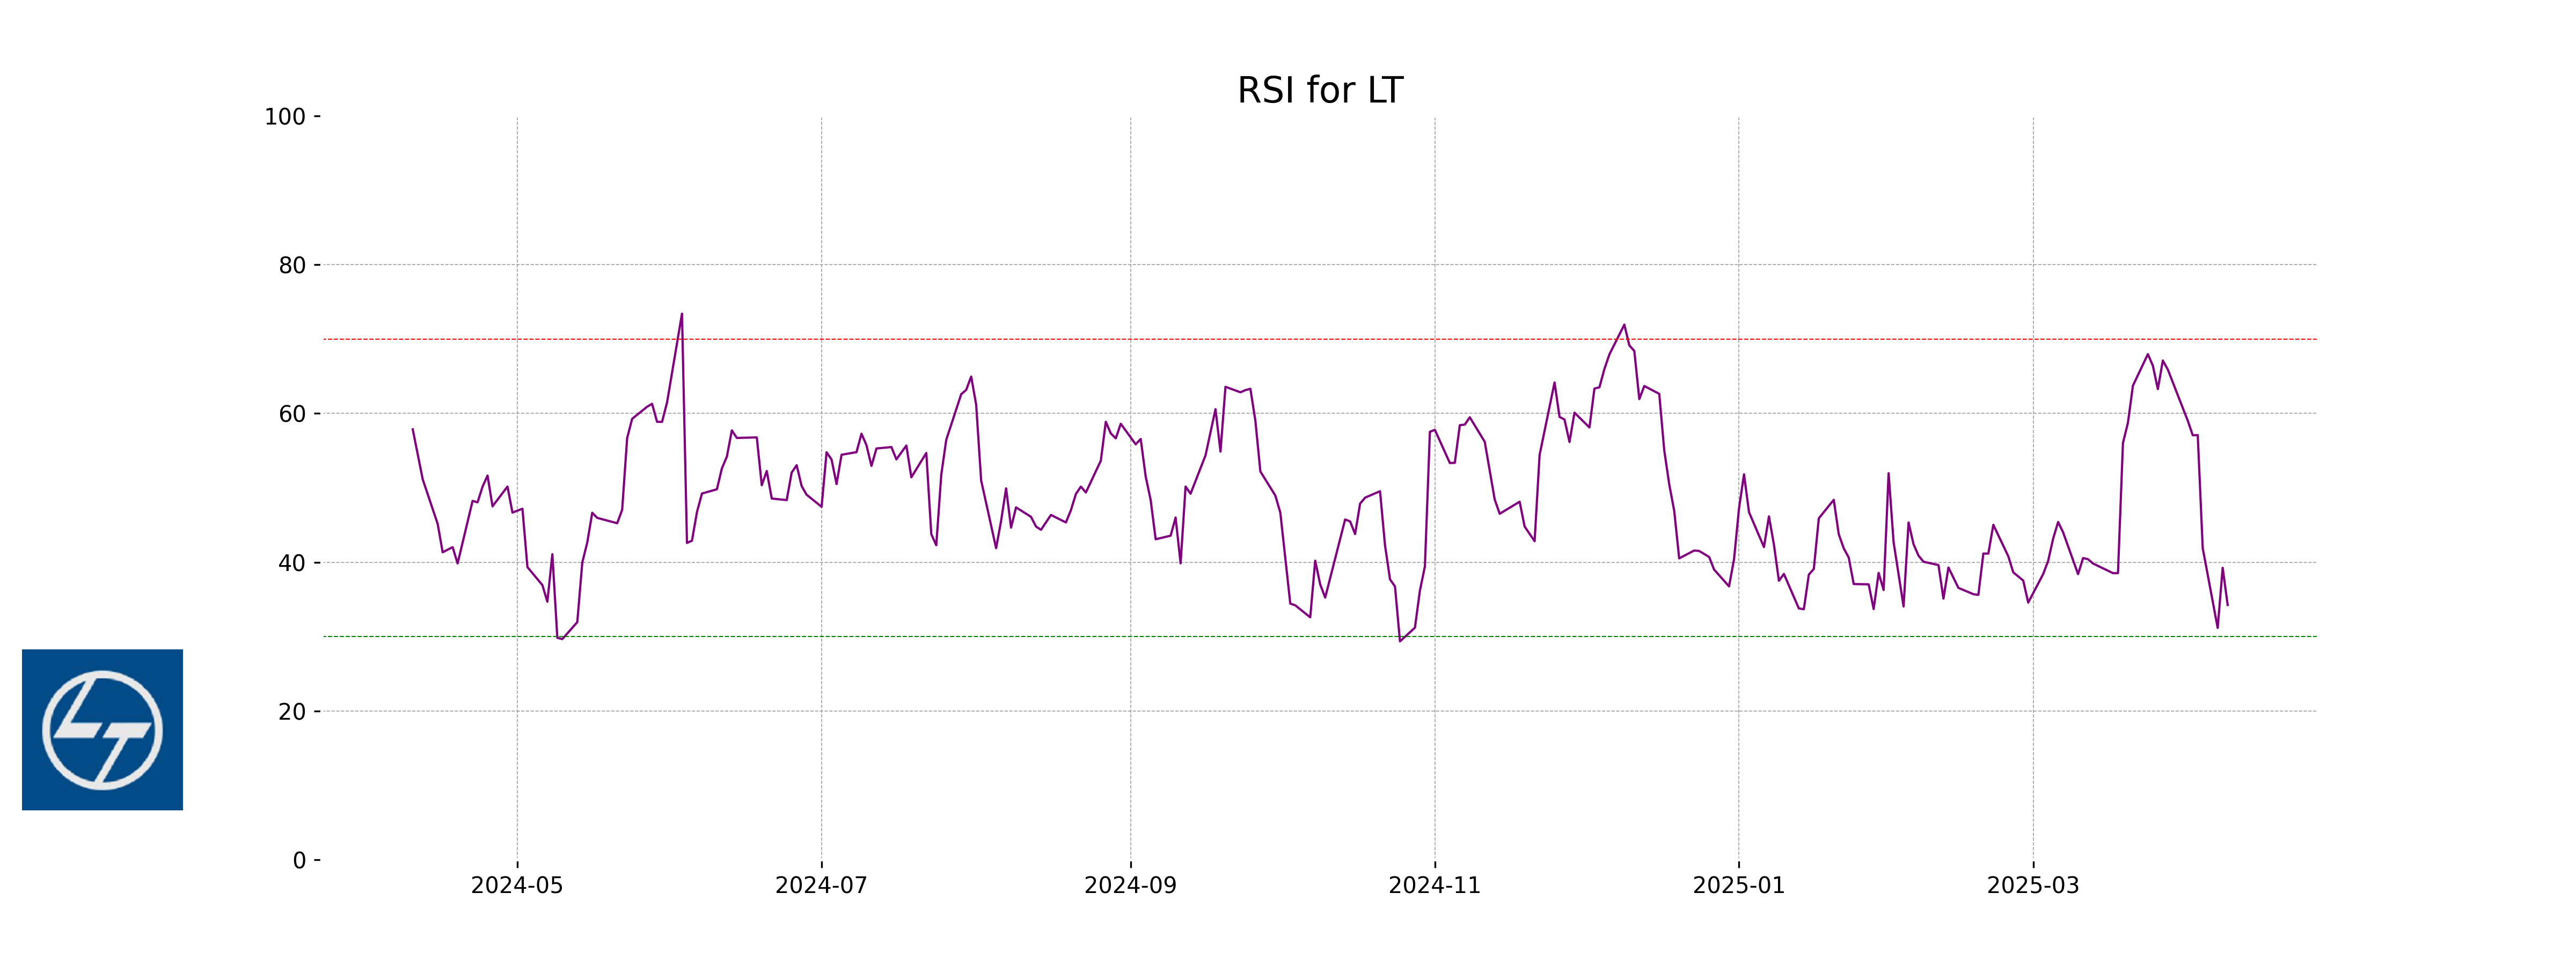
RSI Analysis
The provided data does not pertain to HCL Technologies, but rather to Larsen & Toubro, indicated by the stock symbol LT.NS. For the stock data provided, the RSI is 34.25, which suggests that the stock is approaching oversold territory. An RSI below 30 typically indicates that a stock might be undervalued.
Analysis for SBI Life - April 09, 2025
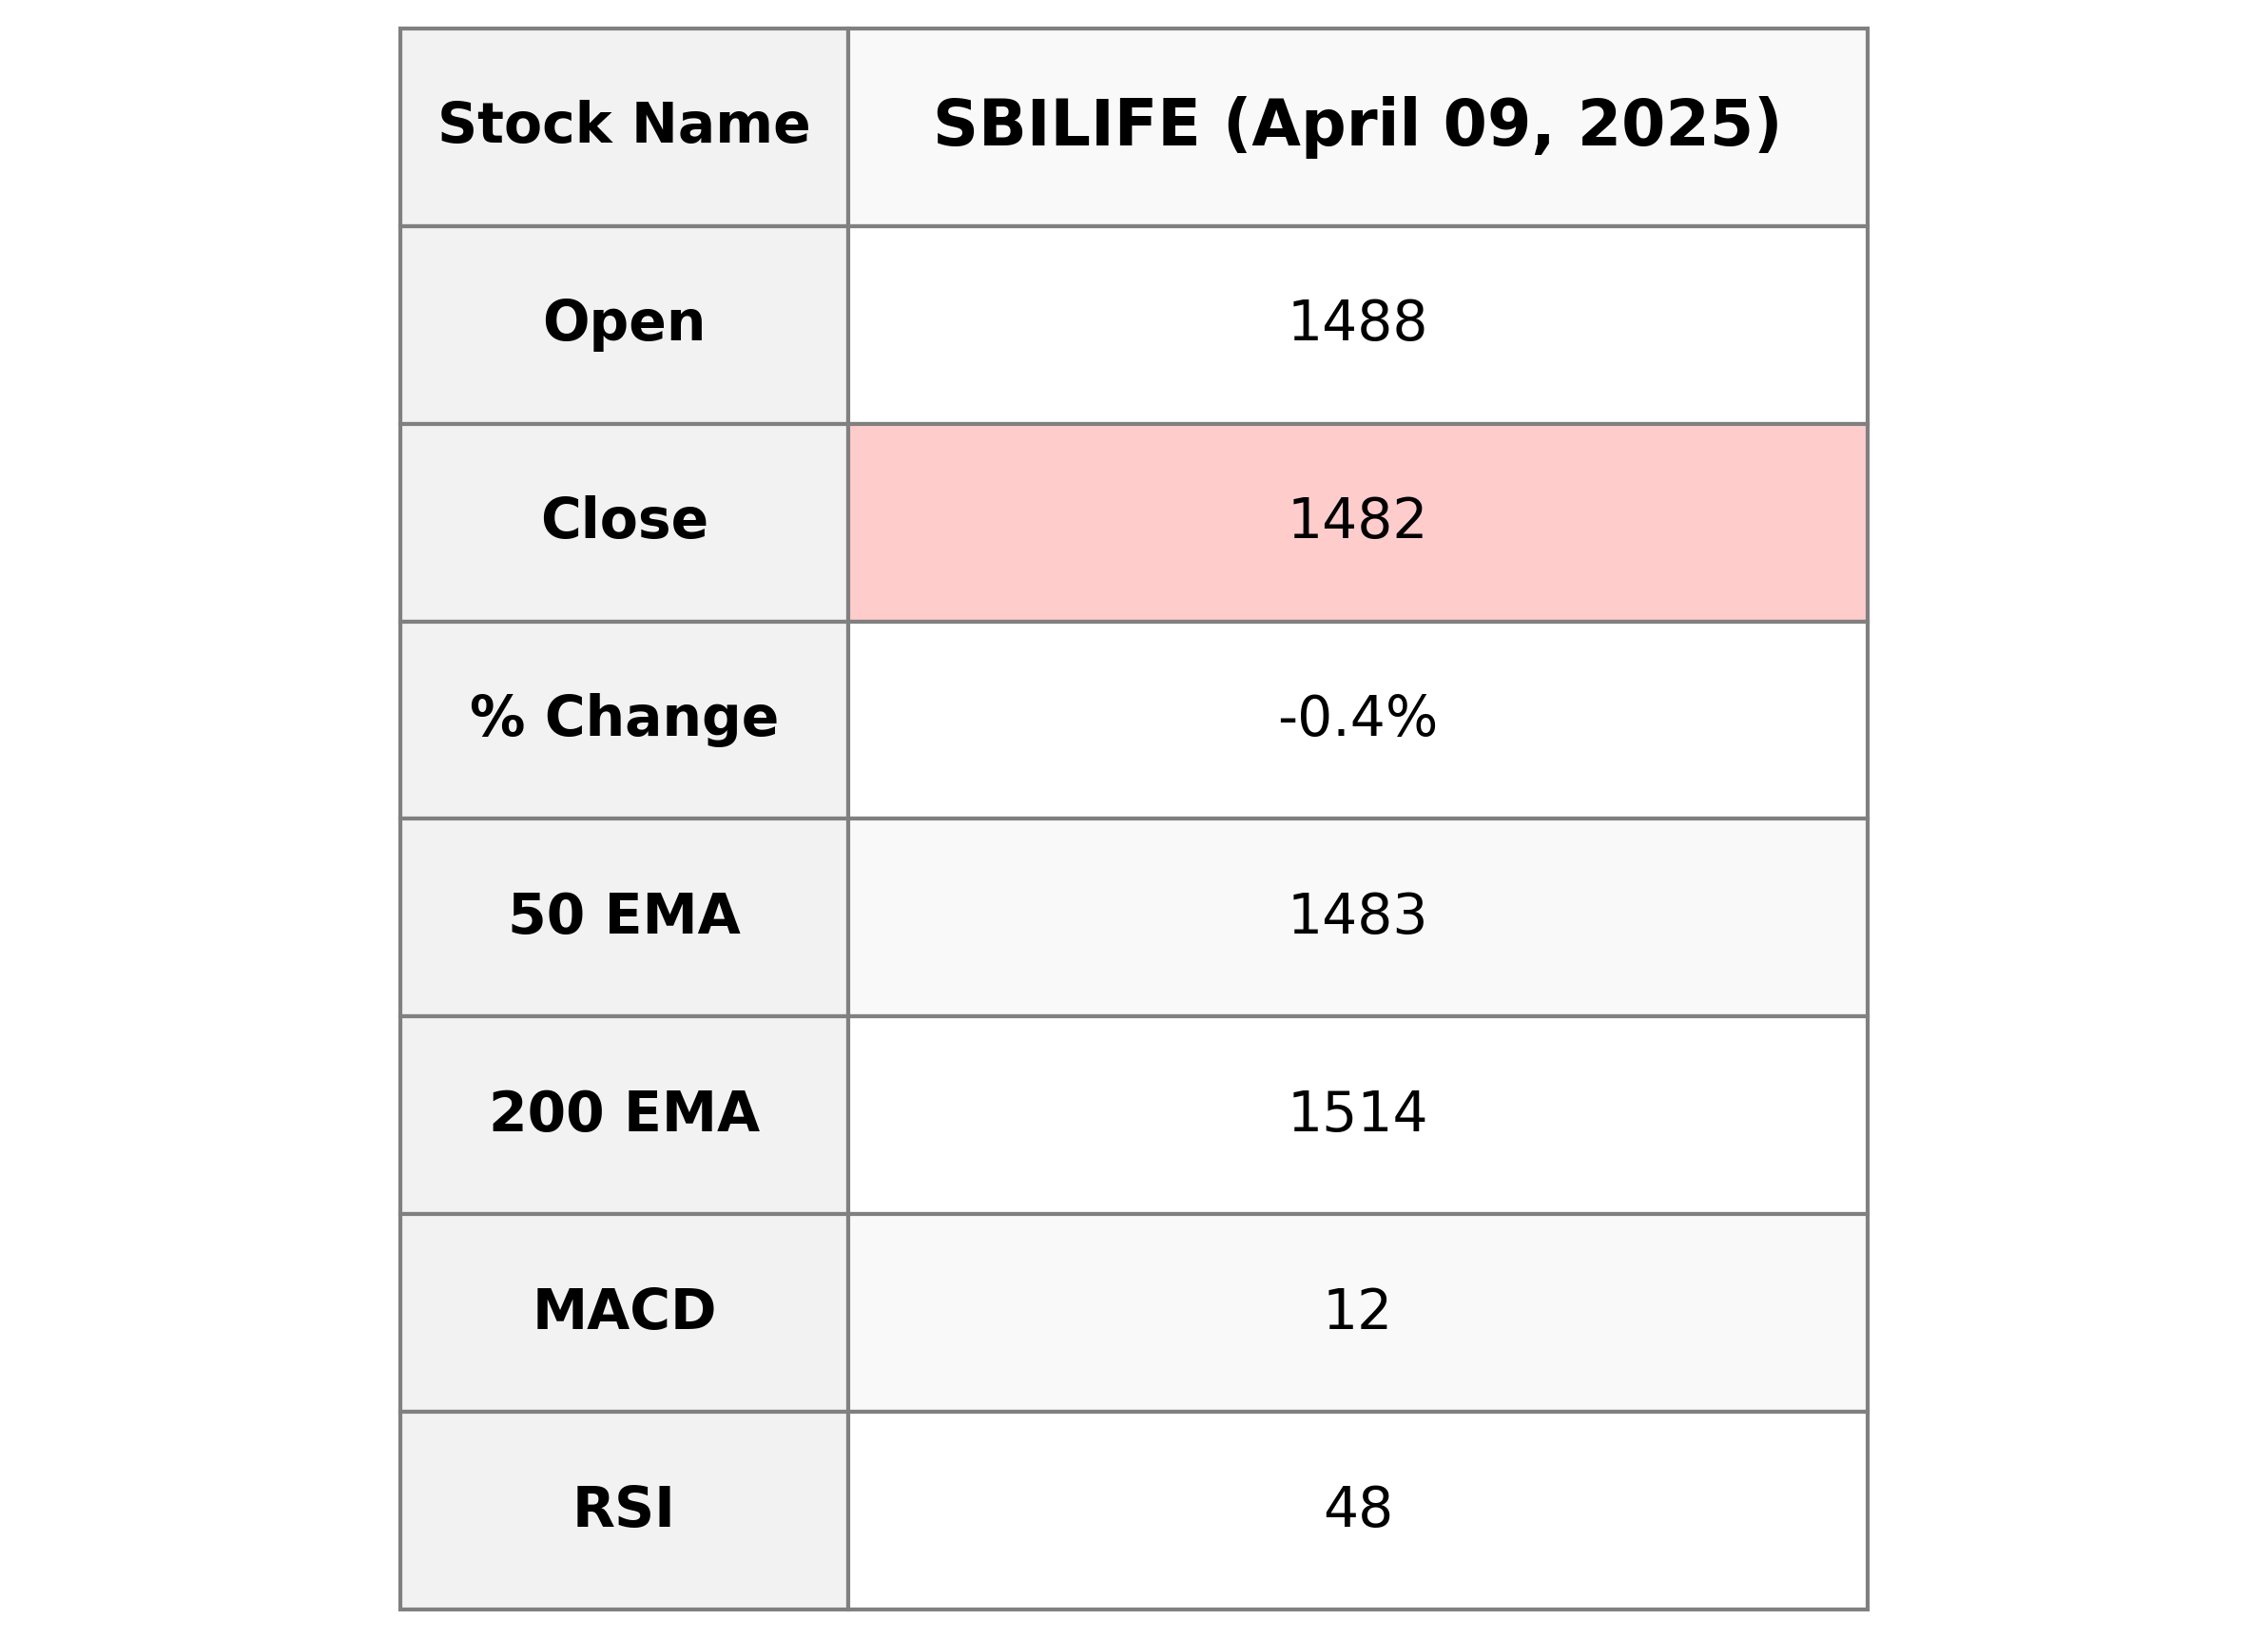
SBI Life Performance: SBI Life's stock opened at 1488.0 and closed slightly lower at 1481.65, marking a decrease of approximately 0.43% with a point change of -6.35. The stock's relative strength index (RSI) indicates that it is neither overbought nor oversold, and its MACD shows bearish momentum as it is below the MACD signal line. Although the 50-day EMA aligns closely with the closing price, it's still under the 10-day and 20-day EMAs, suggesting short-term volatility. With a market cap of 1485 billion INR, the stock's PE ratio stands at 61.45, indicating a relatively high valuation.
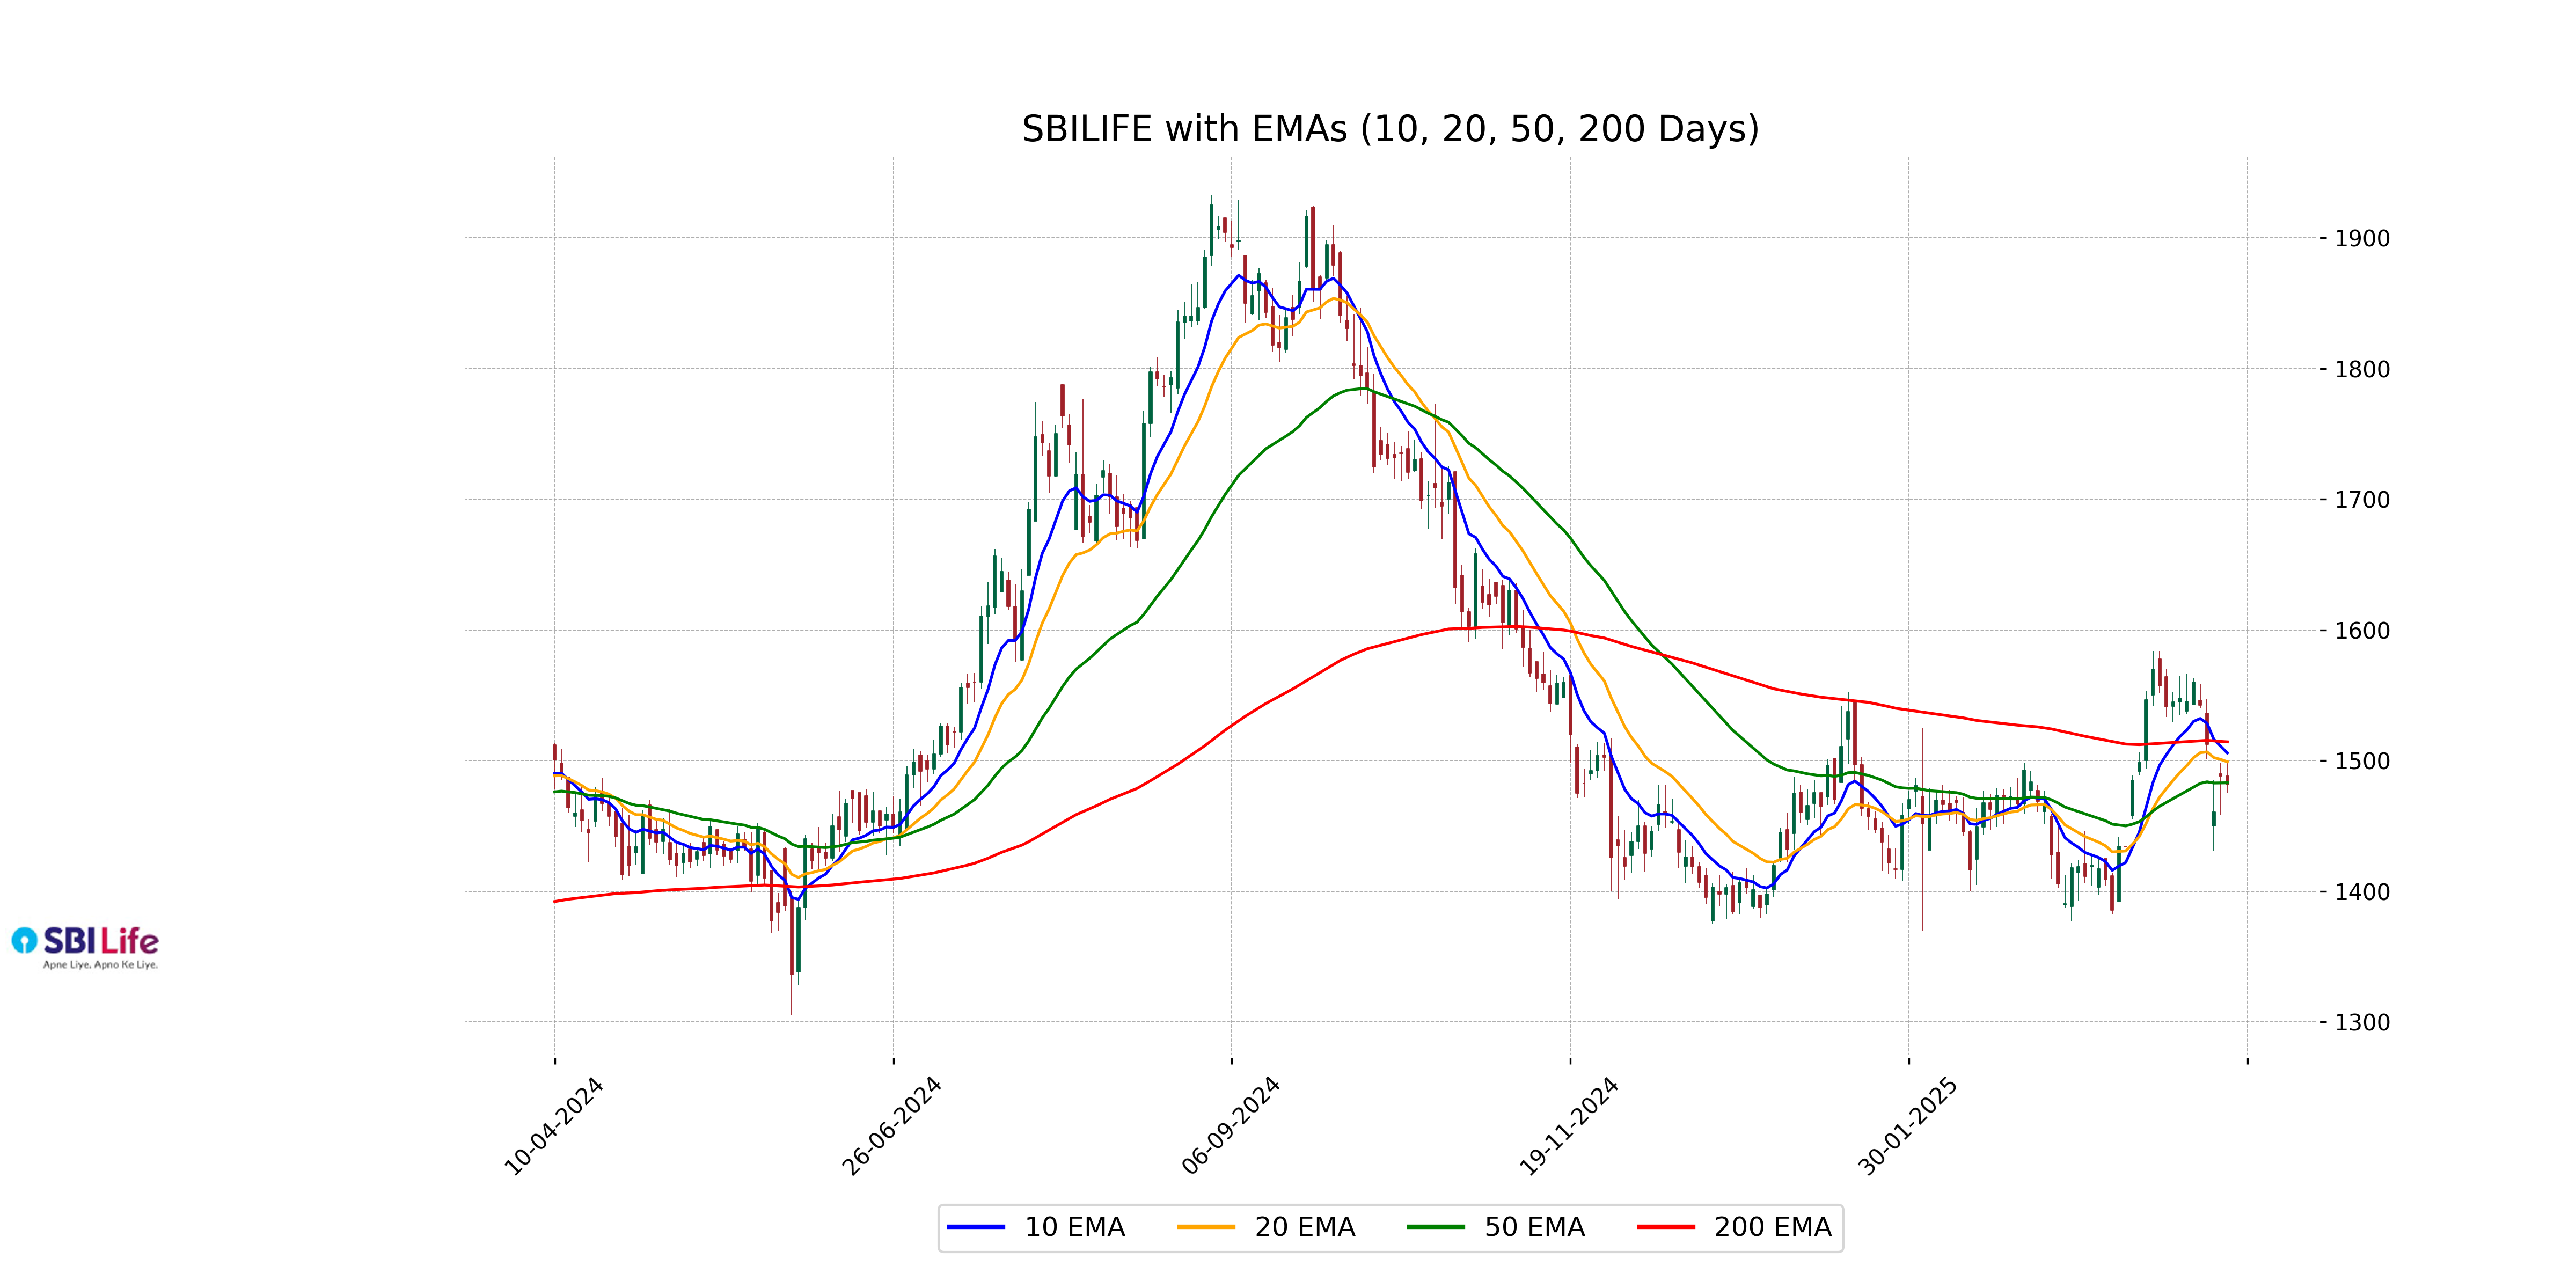
Relationship with Key Moving Averages
SBI Life is currently trading below its 10 EMA and 20 EMA, indicating short-term bearish momentum. Additionally, it is also trading below its 50 EMA and 200 EMA, which points towards a longer-term downtrend relative to these key moving averages.
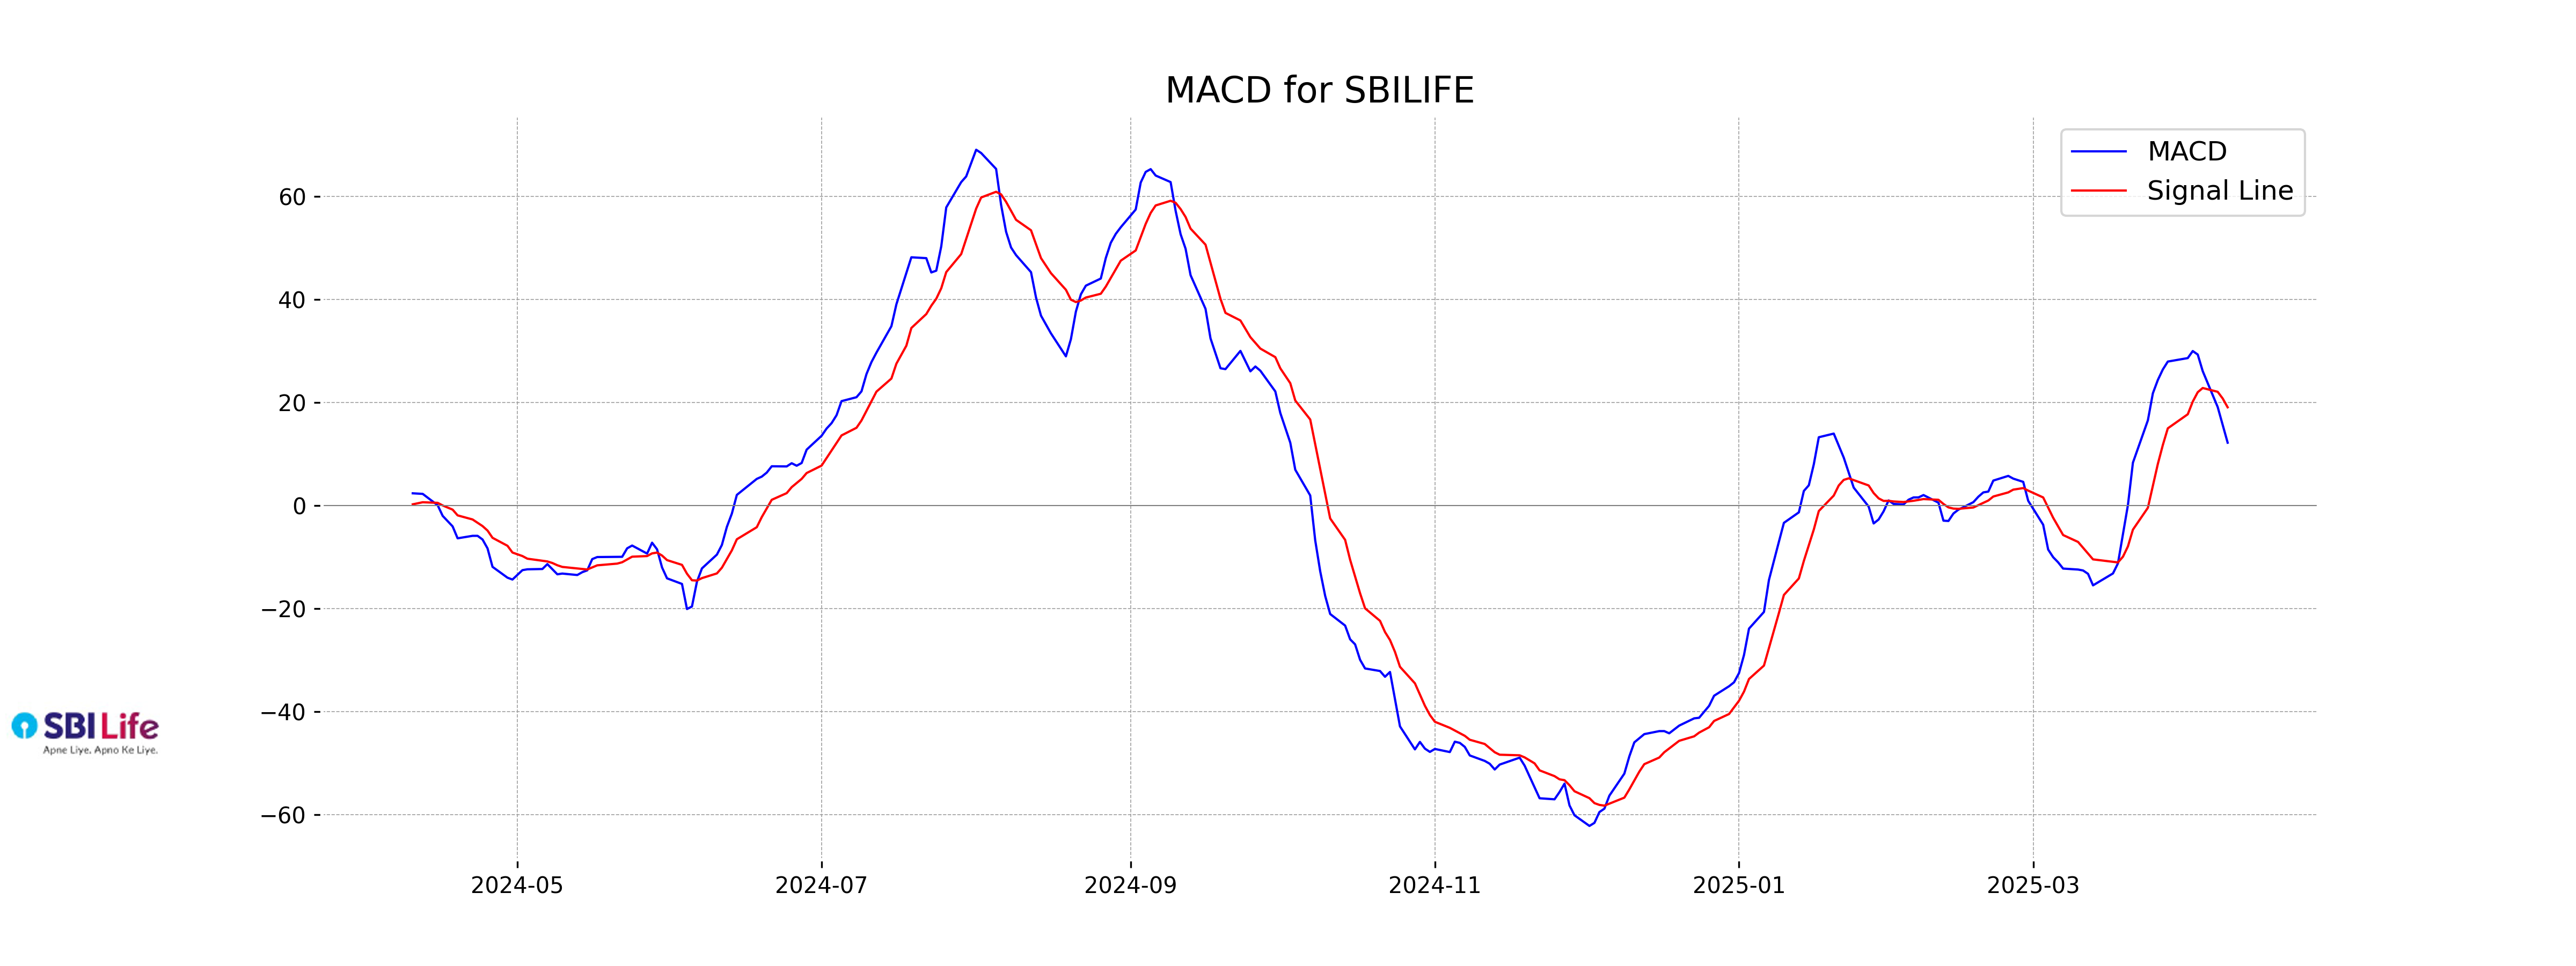
Moving Averages Trend (MACD)
The MACD for SBI Life indicates a bearish signal as the MACD line (12.19) is below the MACD Signal line (19.06). This suggests that there might be a downward momentum in the price trend currently.
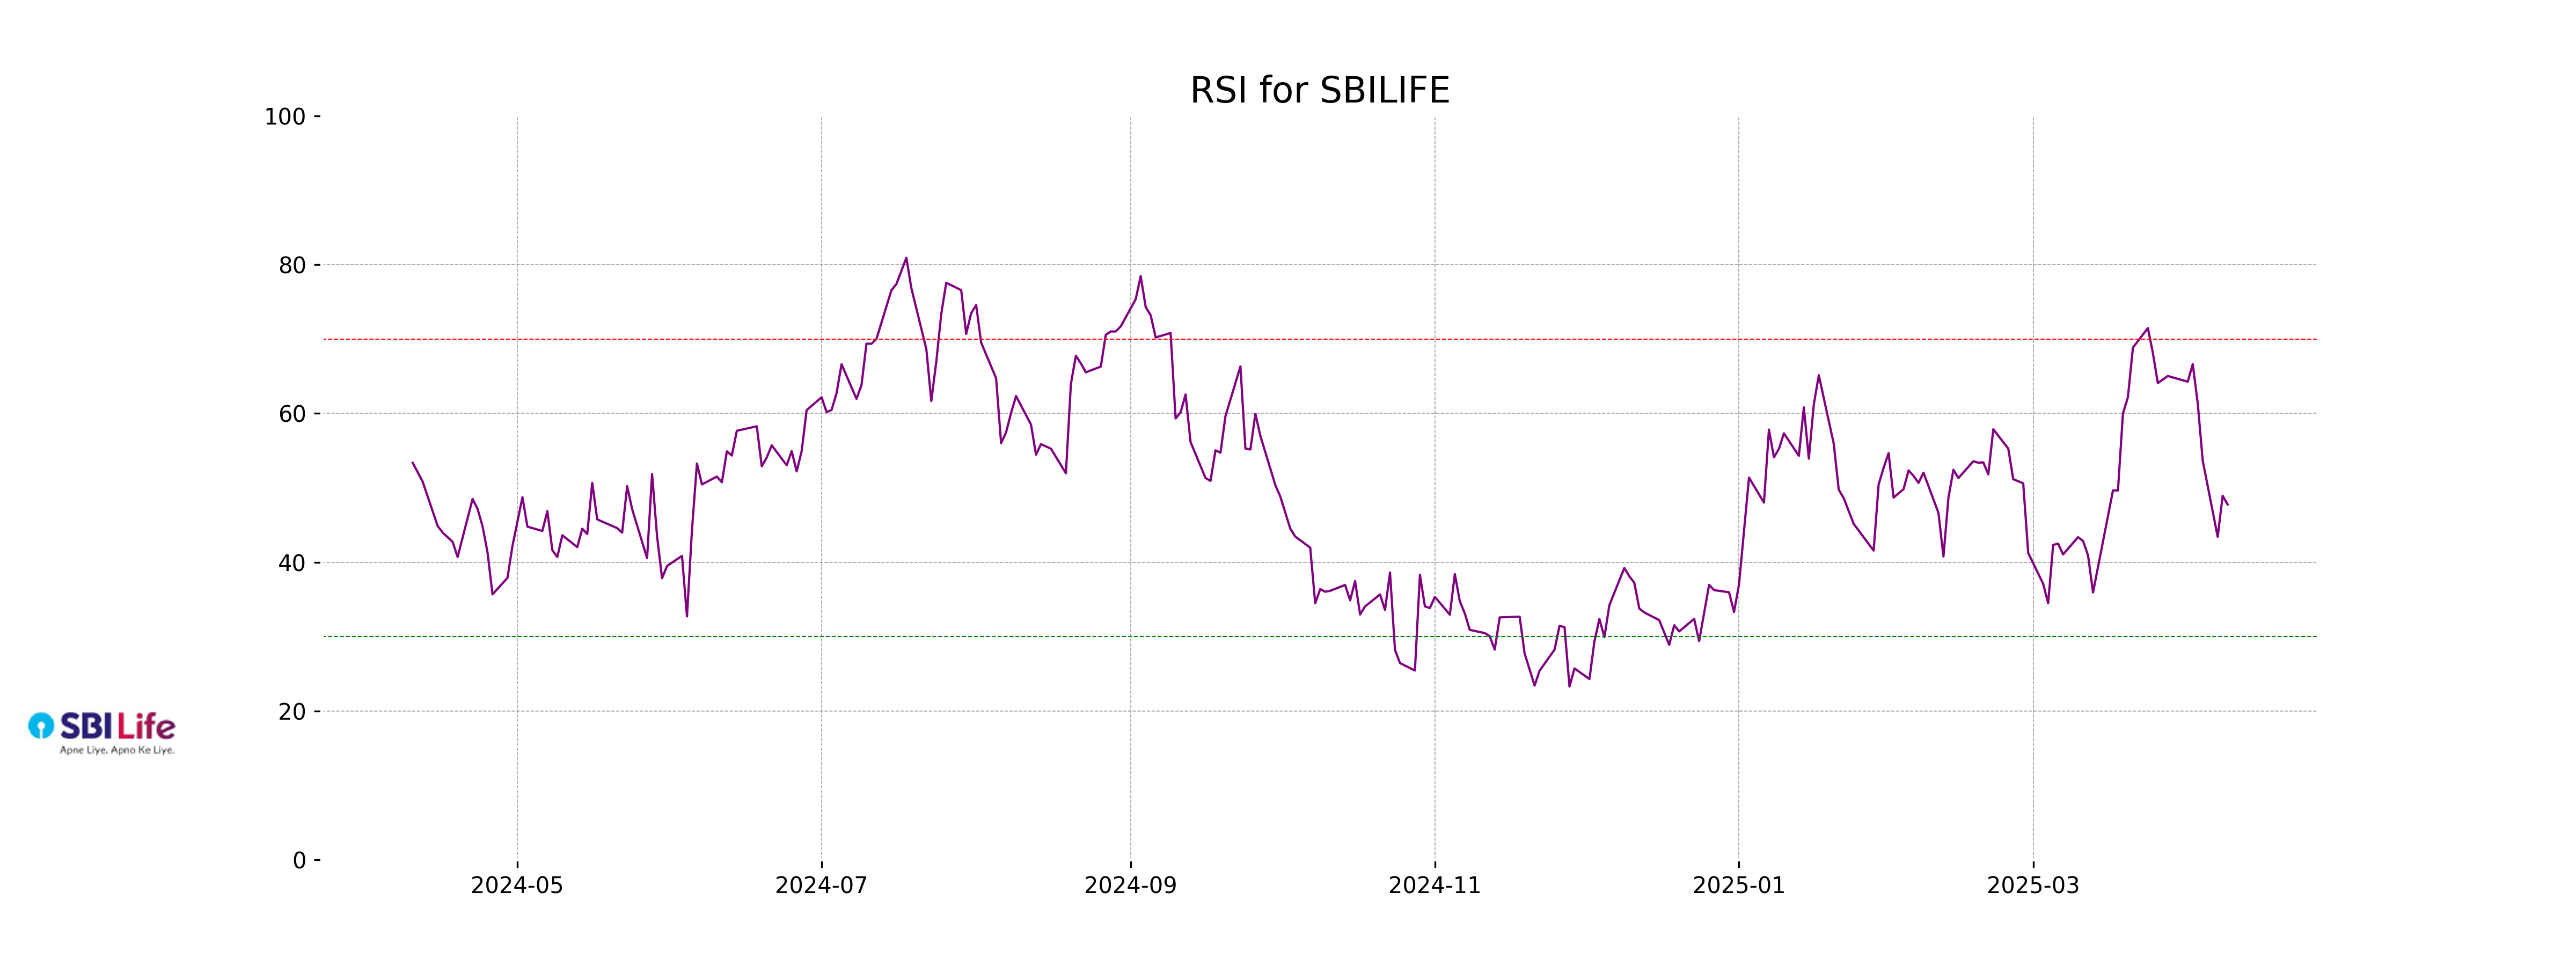
RSI Analysis
SBI Life's RSI is 47.76, indicating that the stock is neither overbought nor oversold. It is close to the neutral 50 level, suggesting a balance between buying and selling pressures in the market.
Analysis for Tech Mahindra - April 09, 2025
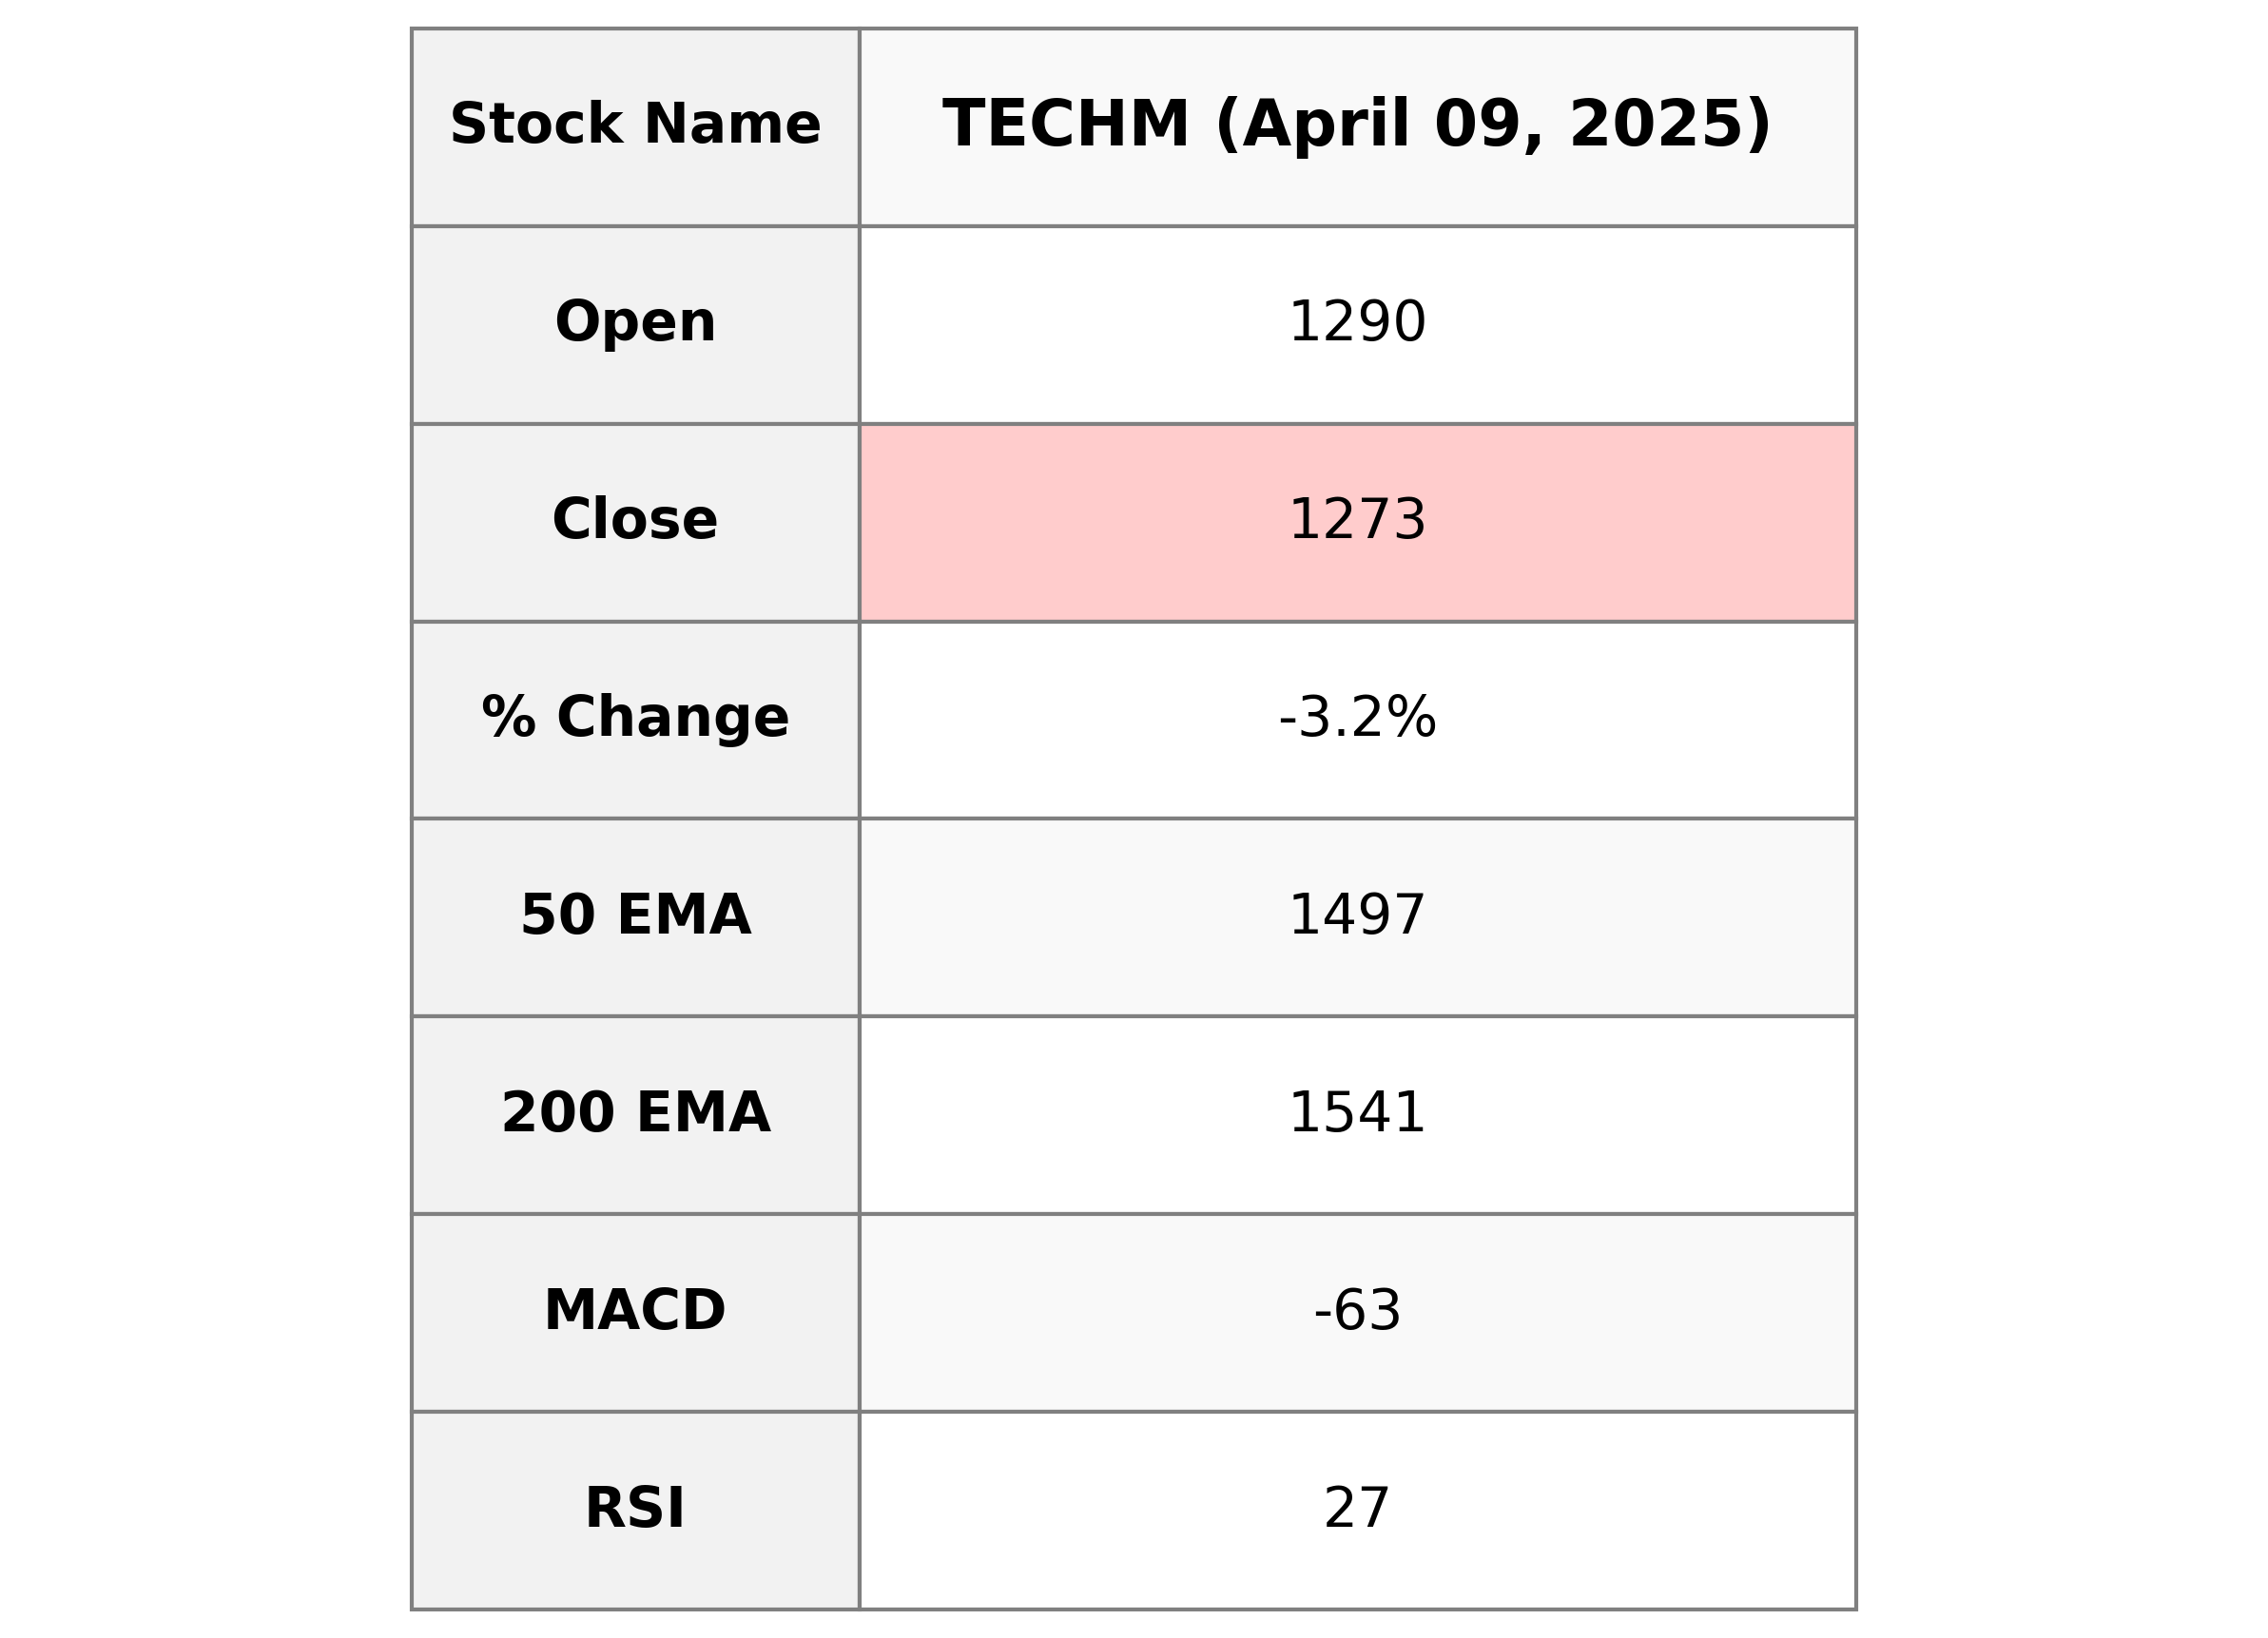
Tech Mahindra's stock performance shows a decline with a closing price of 1272.75, down from the previous close of 1314.40, resulting in a percentage change of -3.17%. The Relative Strength Index (RSI) at 26.97 suggests the stock is oversold. The company's Market Cap stands at approximately ₹1,126 billion, with a PE Ratio of 30.17, while operating in the Information Technology Services sector in India.
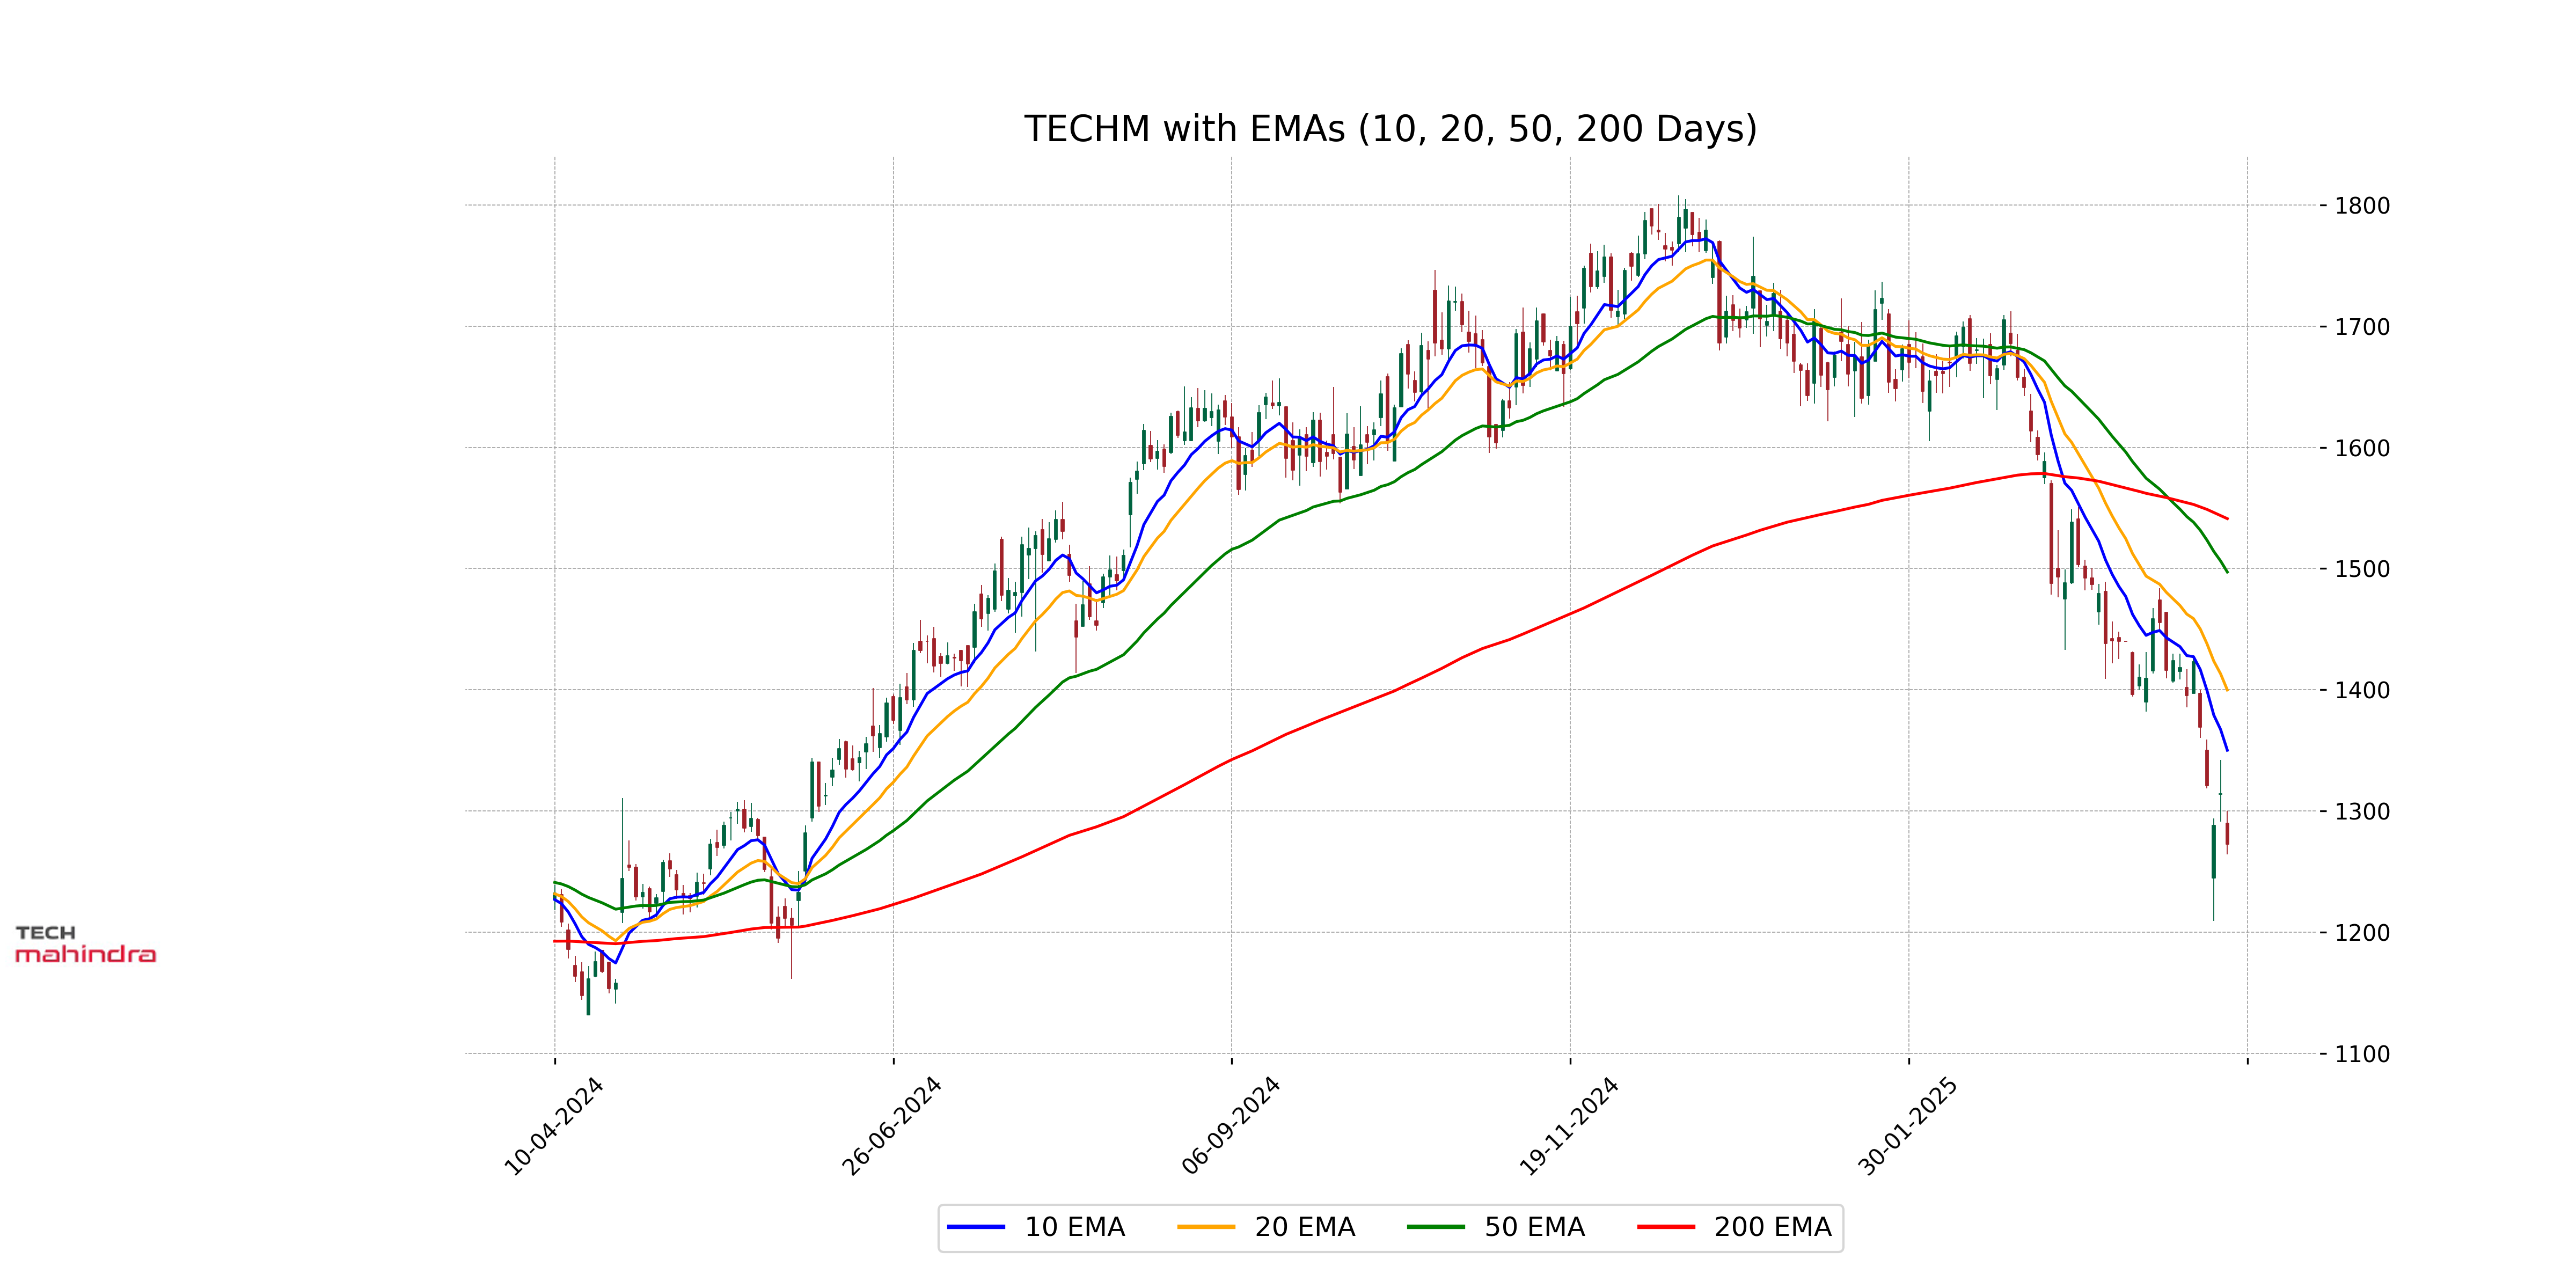
Relationship with Key Moving Averages
Tech Mahindra is currently trading below its key moving averages, with its close price of 1272.75 positioned below the 10 EMA (1350.15), 20 EMA (1399.85), 50 EMA (1497.15), and 200 EMA (1541.18). This indicates a bearish trend in the stock's short-term to long-term momentum.
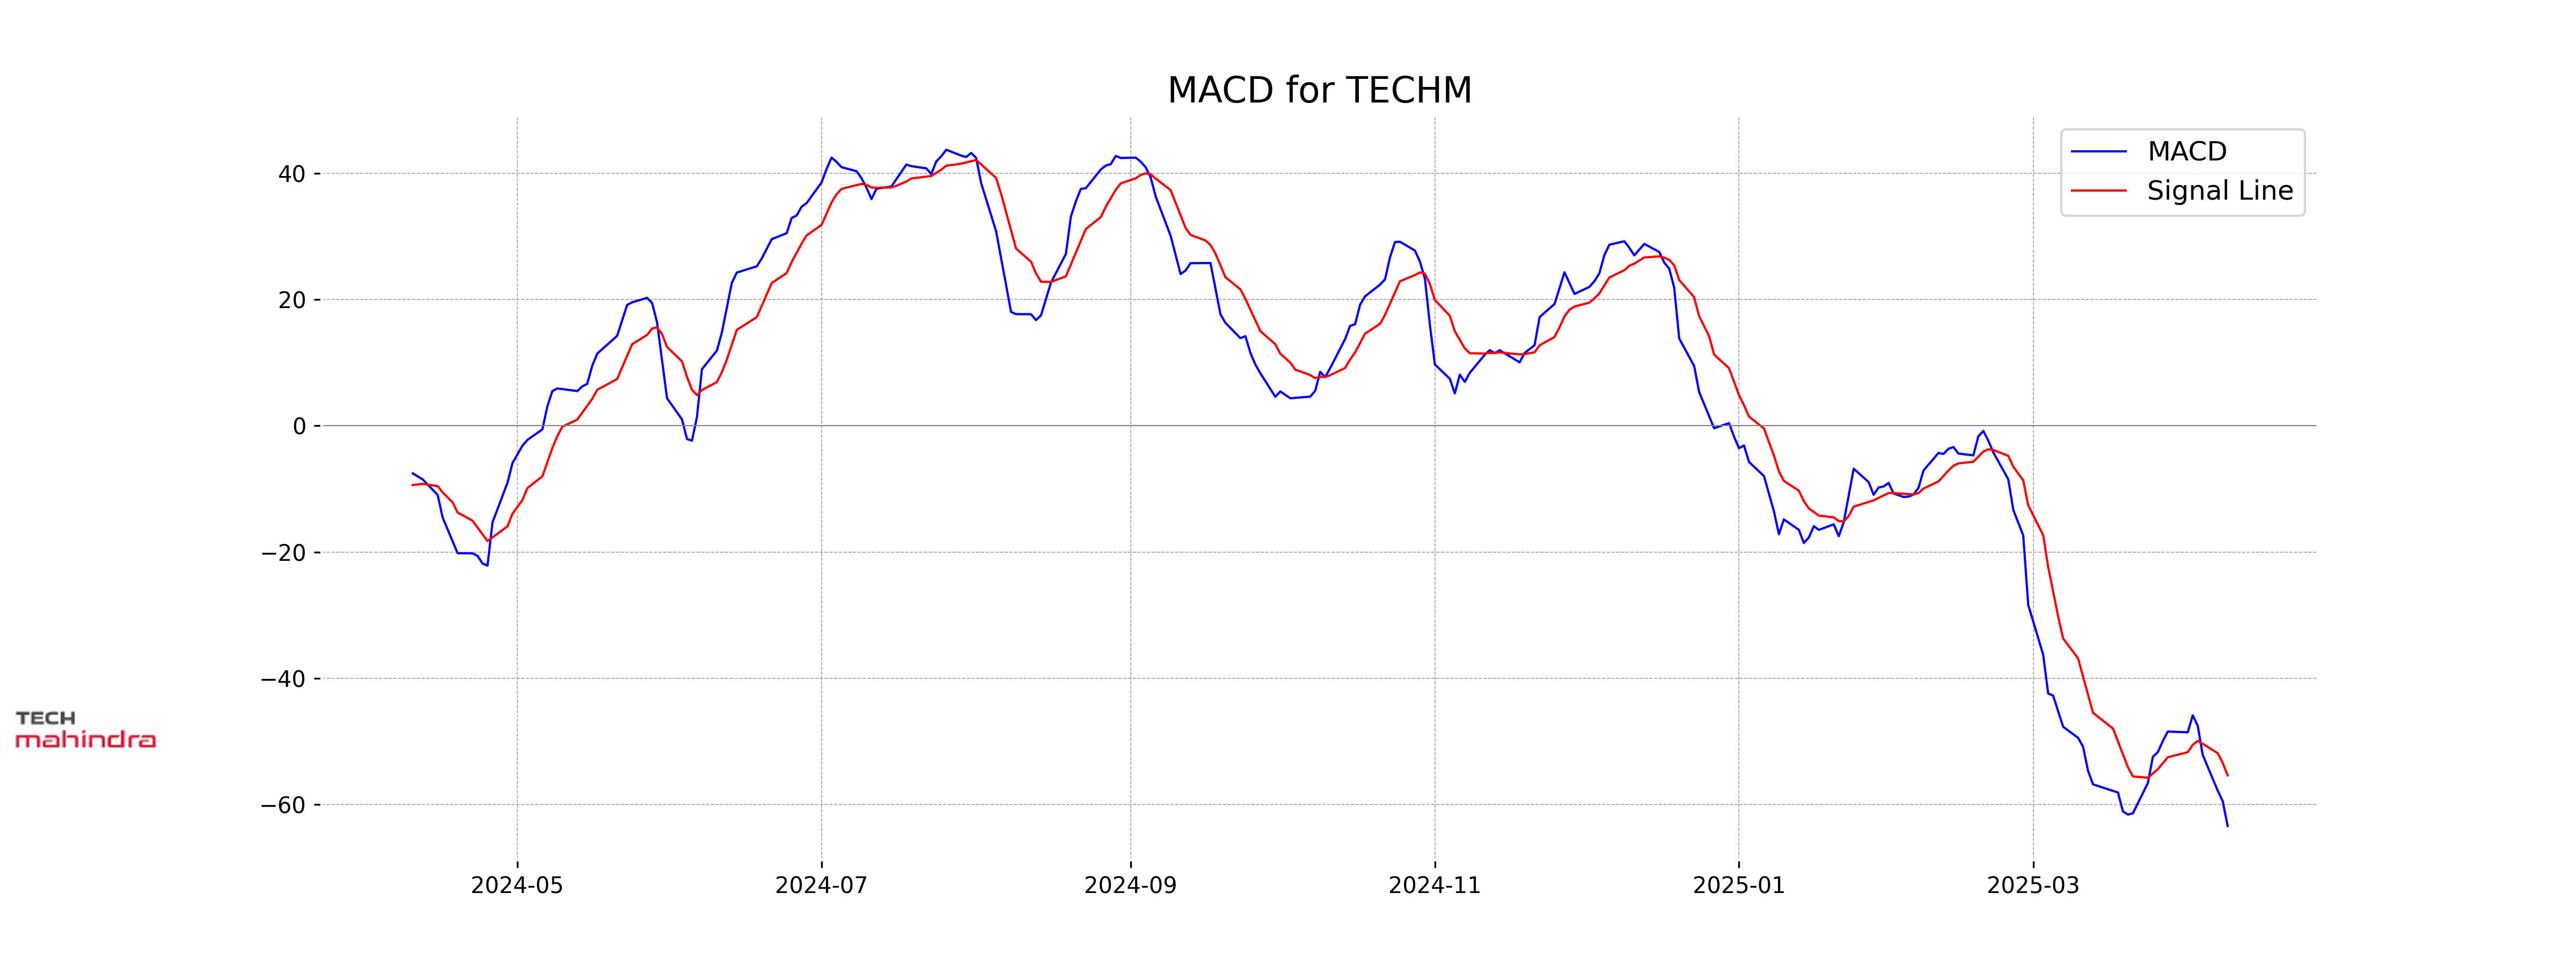
Moving Averages Trend (MACD)
Tech Mahindra's MACD is currently at -63.41 with the MACD Signal at -55.40, indicating a bearish momentum as the MACD line is below the signal line. This suggests that the stock might continue to experience downward pressure in the near term.
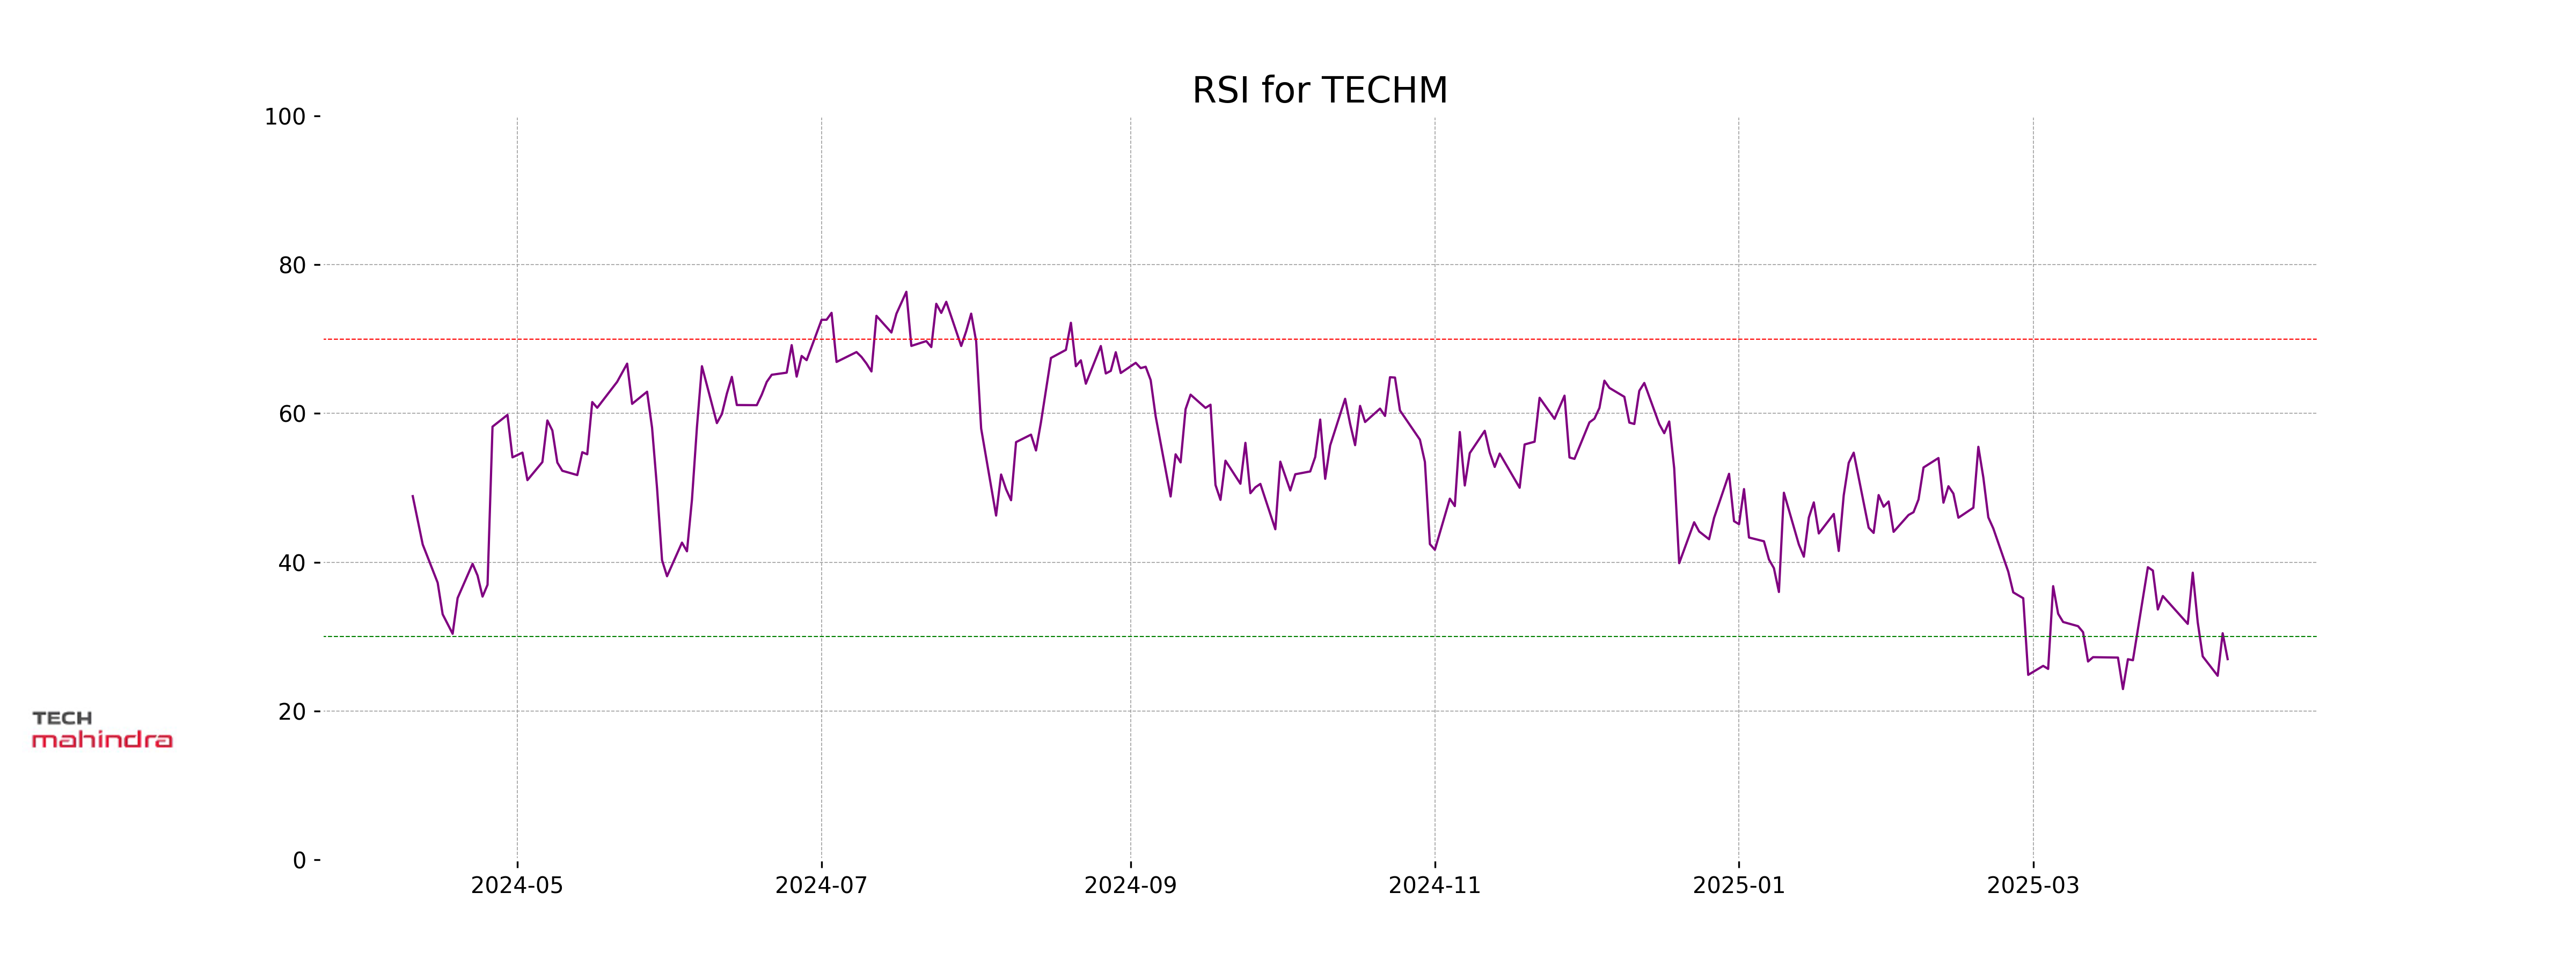
RSI Analysis
The RSI for Tech Mahindra is 26.97, which suggests that the stock is currently in the oversold territory. This indicates a potential buying opportunity if the downward momentum starts to reverse. However, caution is advised as it might also imply continued weakness in the near term.
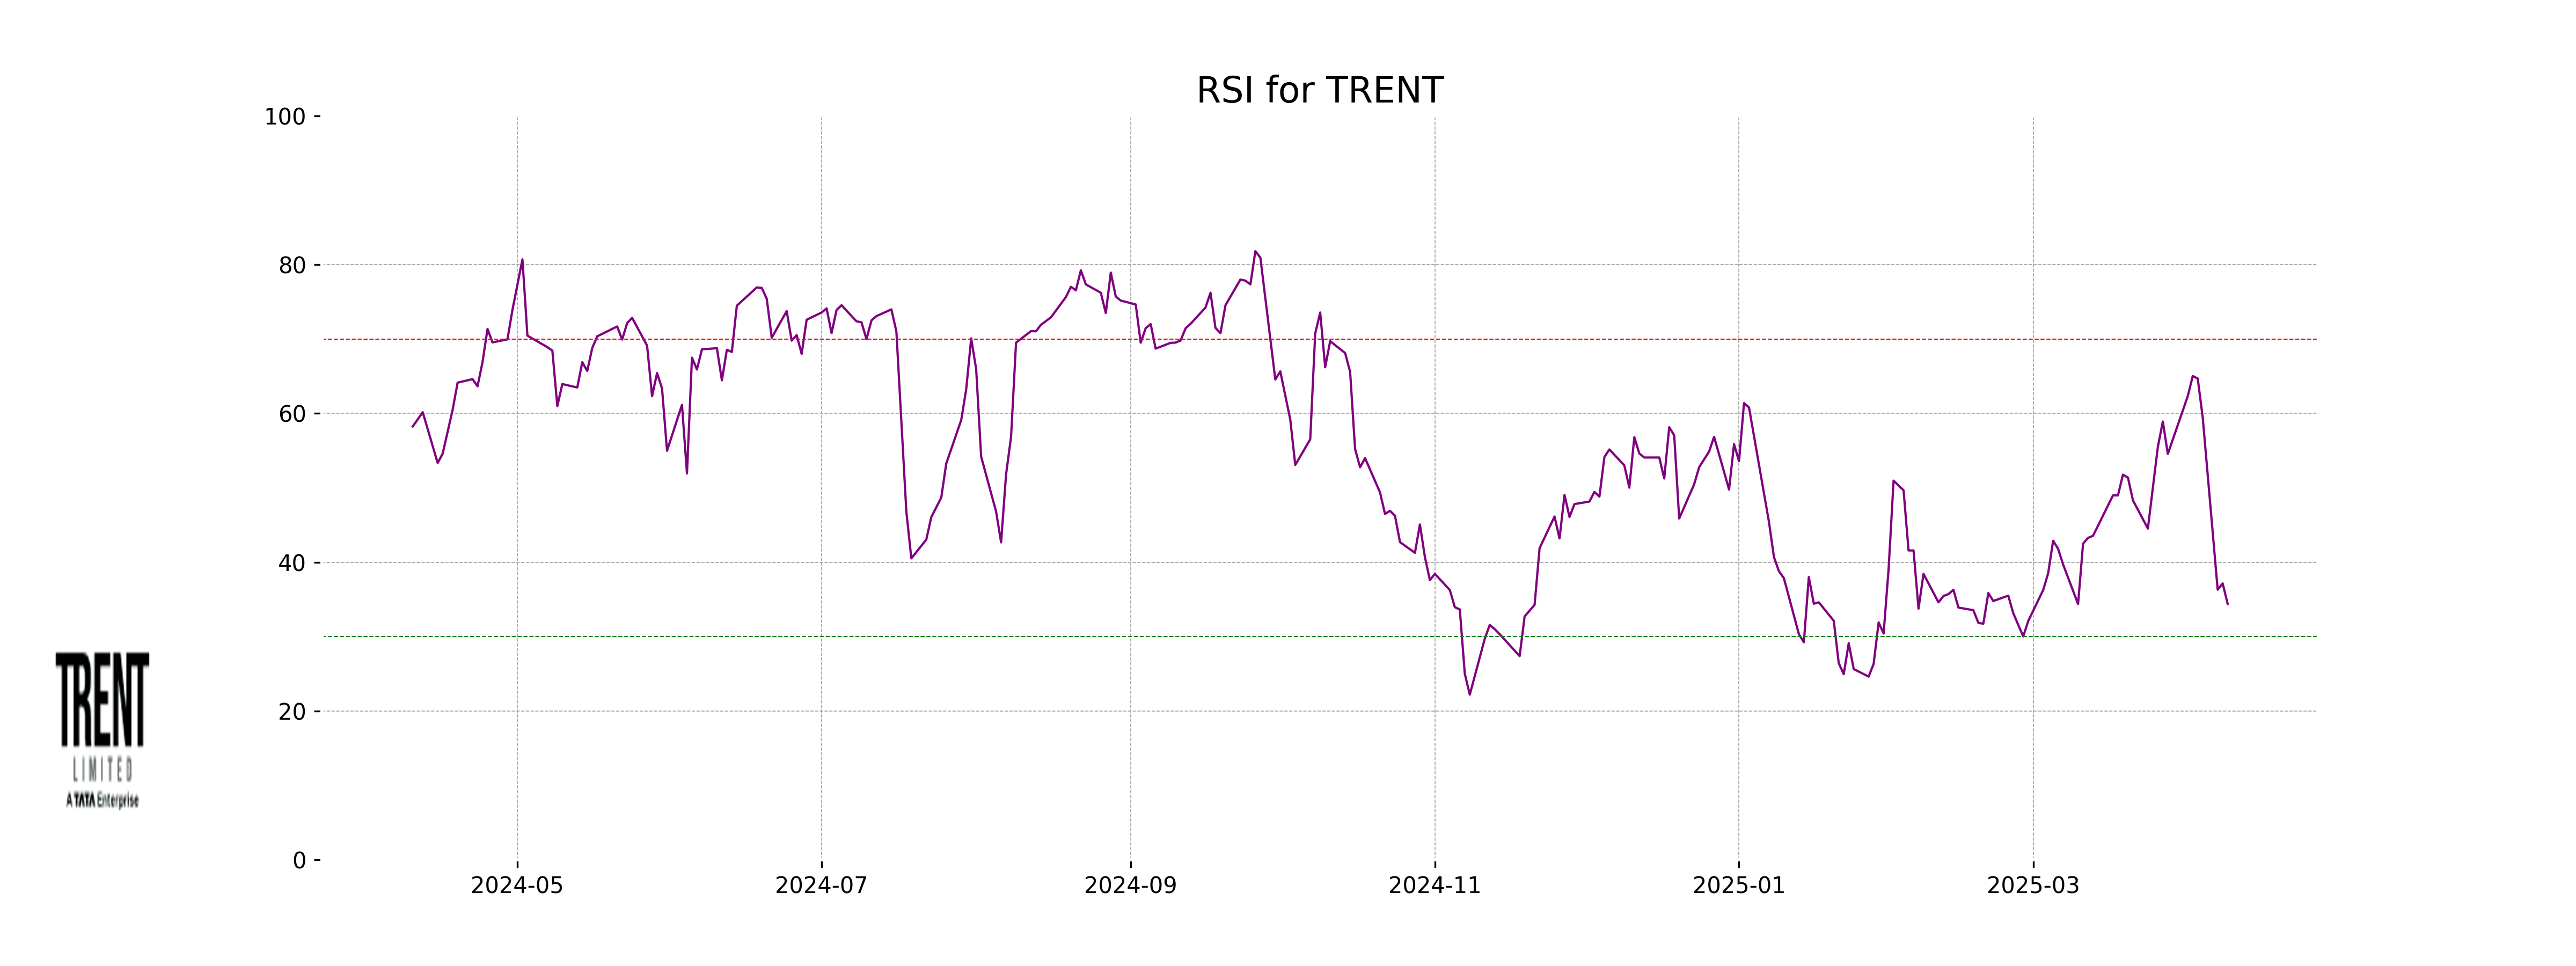
Analysis for Trent - April 09, 2025

Trent Performance Description: Trent, operating in the Consumer Cyclical sector, specifically within Apparel Retail in India, experienced a decrease in its stock price recently, with a close of 4620.20 after opening at 4767.00. This marks a percentage change of -3.08%. Despite the current negative MACD of -60.52, the stock has a healthy PE Ratio of 85.01, suggesting future growth potential. However, the RSI of 34.41 indicates the stock is approaching oversold territory.
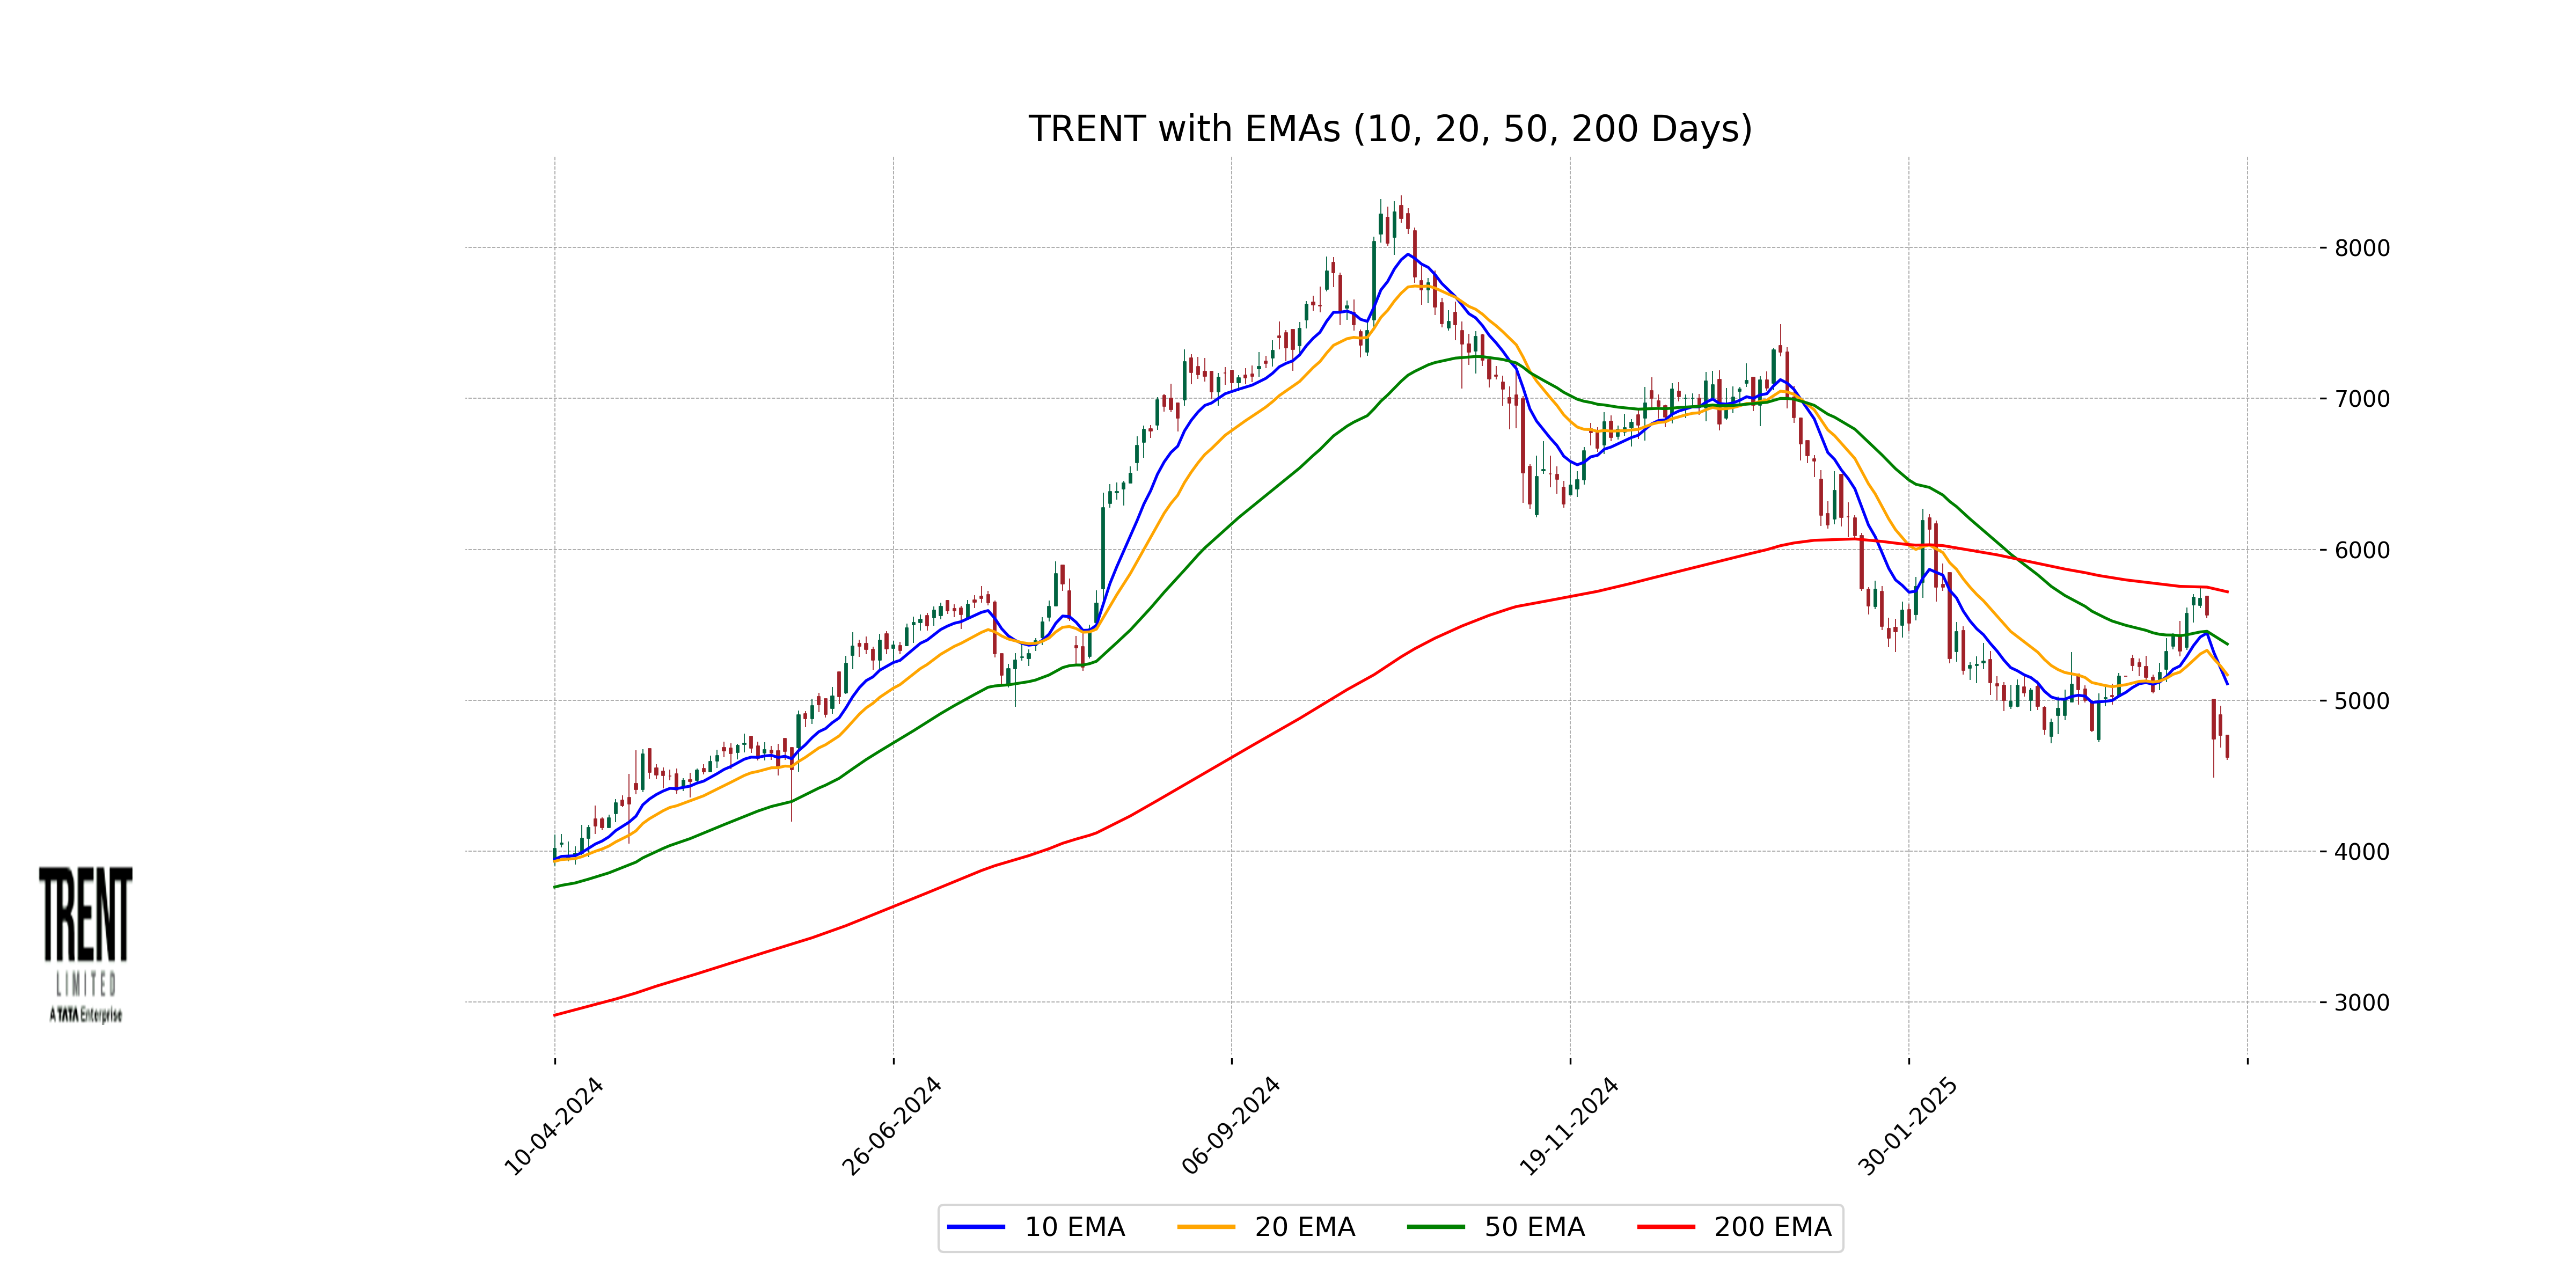
Relationship with Key Moving Averages
Trent's closing price of 4620.20 is currently below its 10-day EMA of 5108.45, 20-day EMA of 5168.23, 50-day EMA of 5371.82, and 200-day EMA of 5718.42, indicating a potential bearish trend. The RSI of 34.41 suggests that the stock might be approaching oversold conditions.
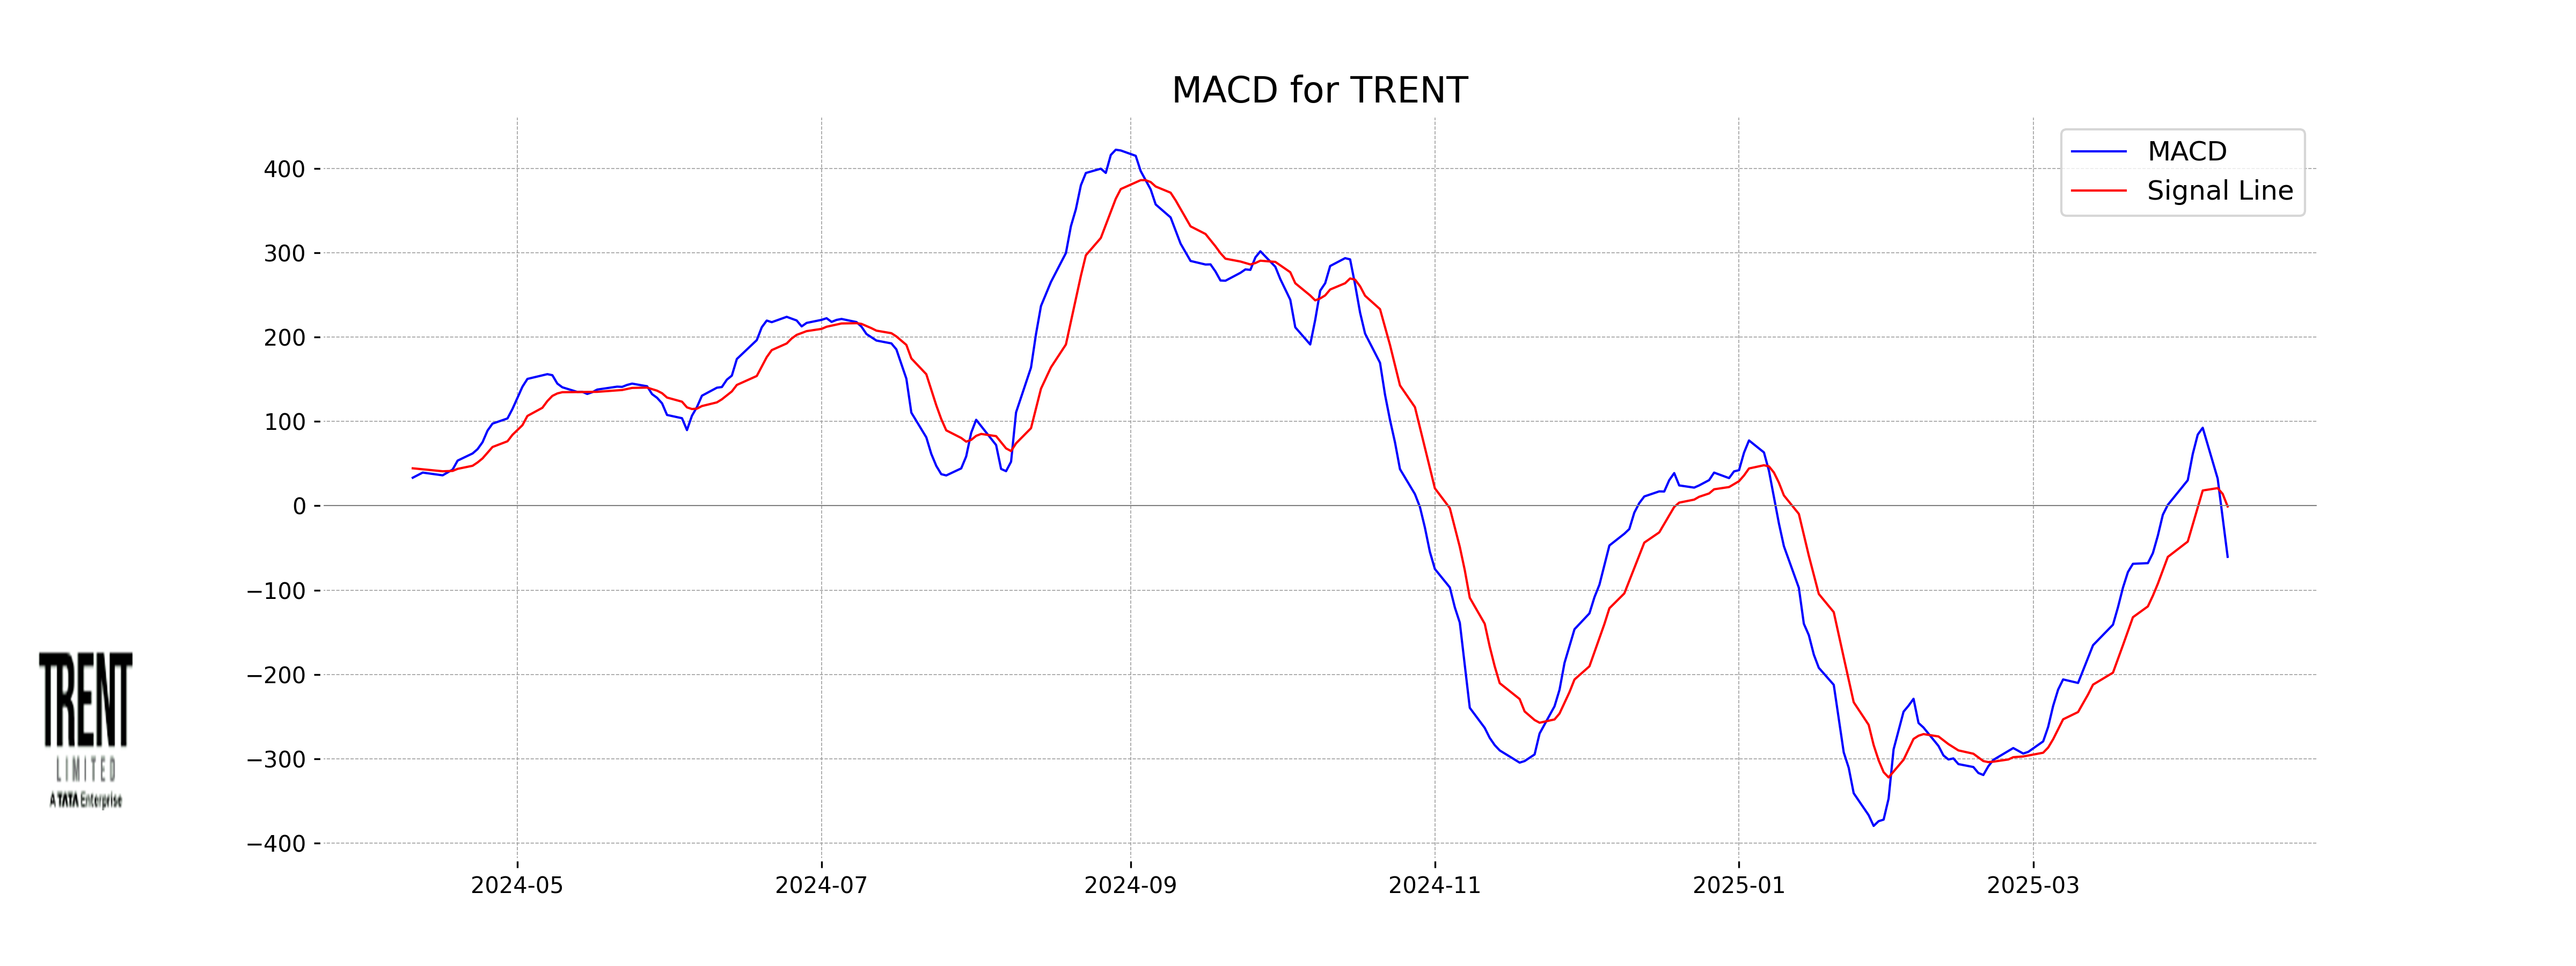
Moving Averages Trend (MACD)
MACD Analysis for Trent: The MACD for Trent is currently at -60.52 with a signal line at -0.84, indicating a bearish trend as the MACD line is below the signal line. This suggests a potential continuation of downward momentum in the short term.
RSI Analysis
RSI Analysis for Trent: The Relative Strength Index (RSI) of Trent is at 34.41, which indicates that the stock is approaching the oversold territory. An RSI below 30 generally suggests that a stock is oversold, while levels above 70 indicate that it is overbought.
Analysis for Wipro - April 09, 2025
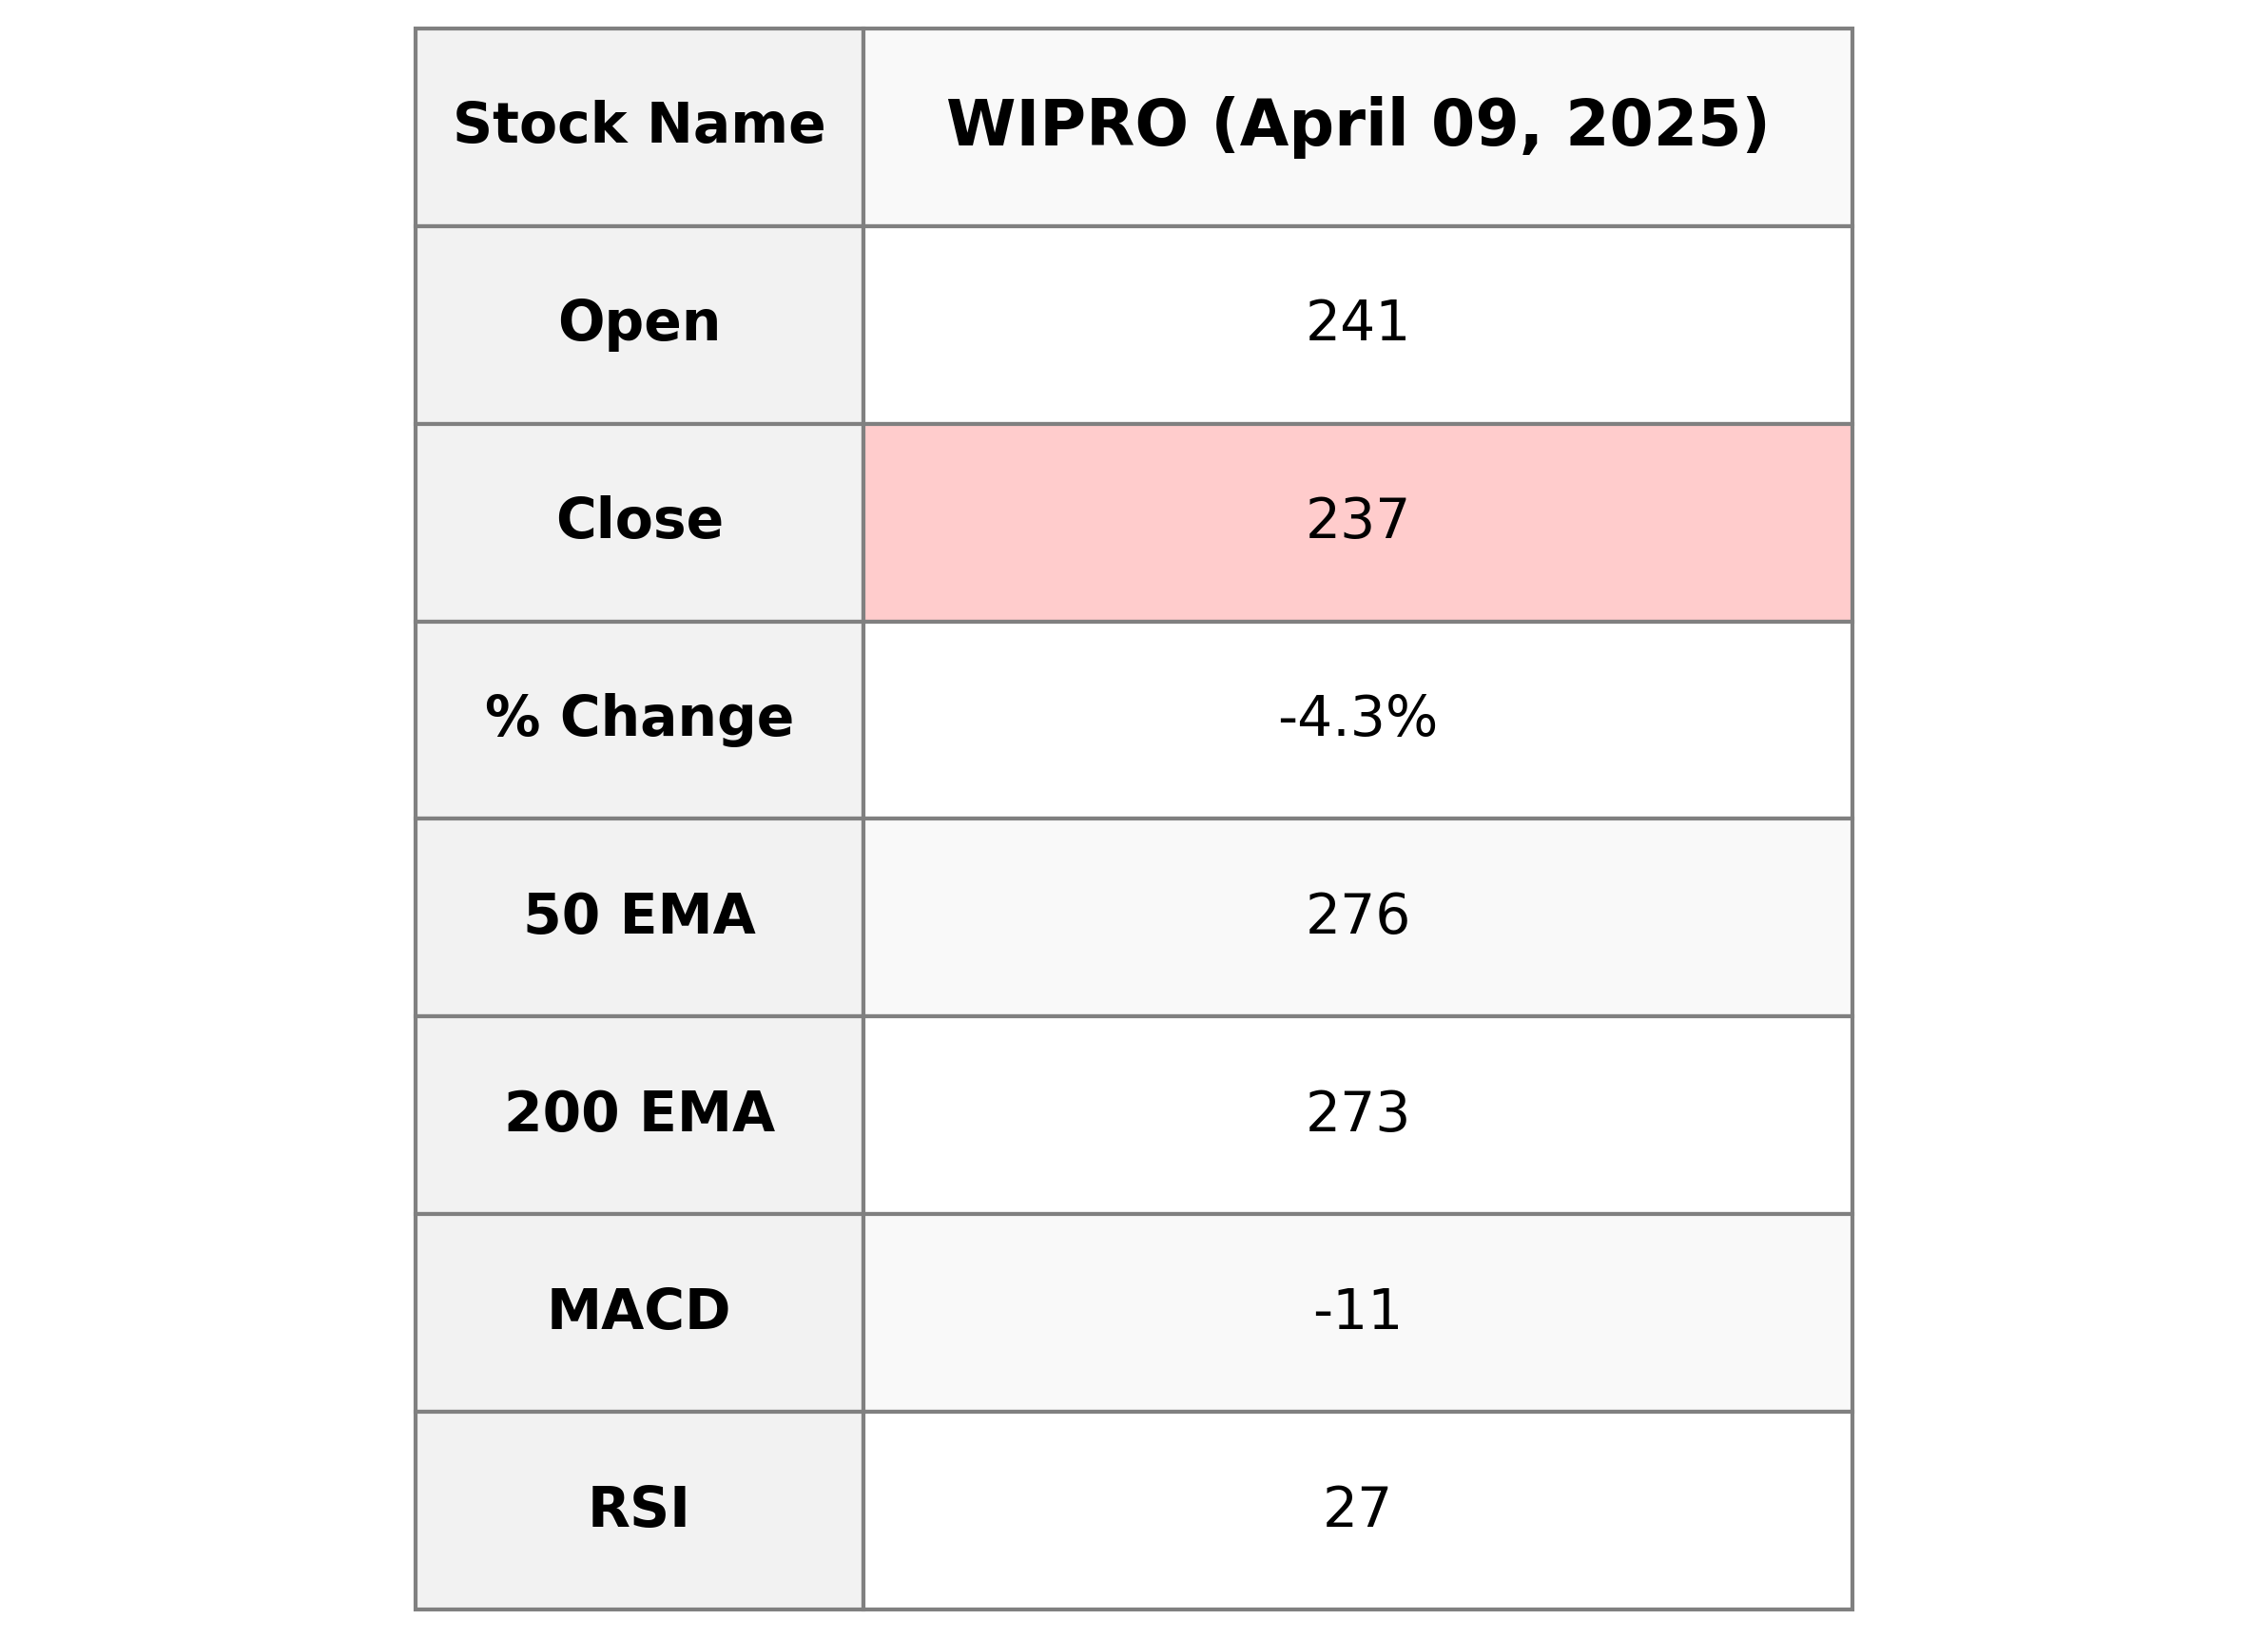
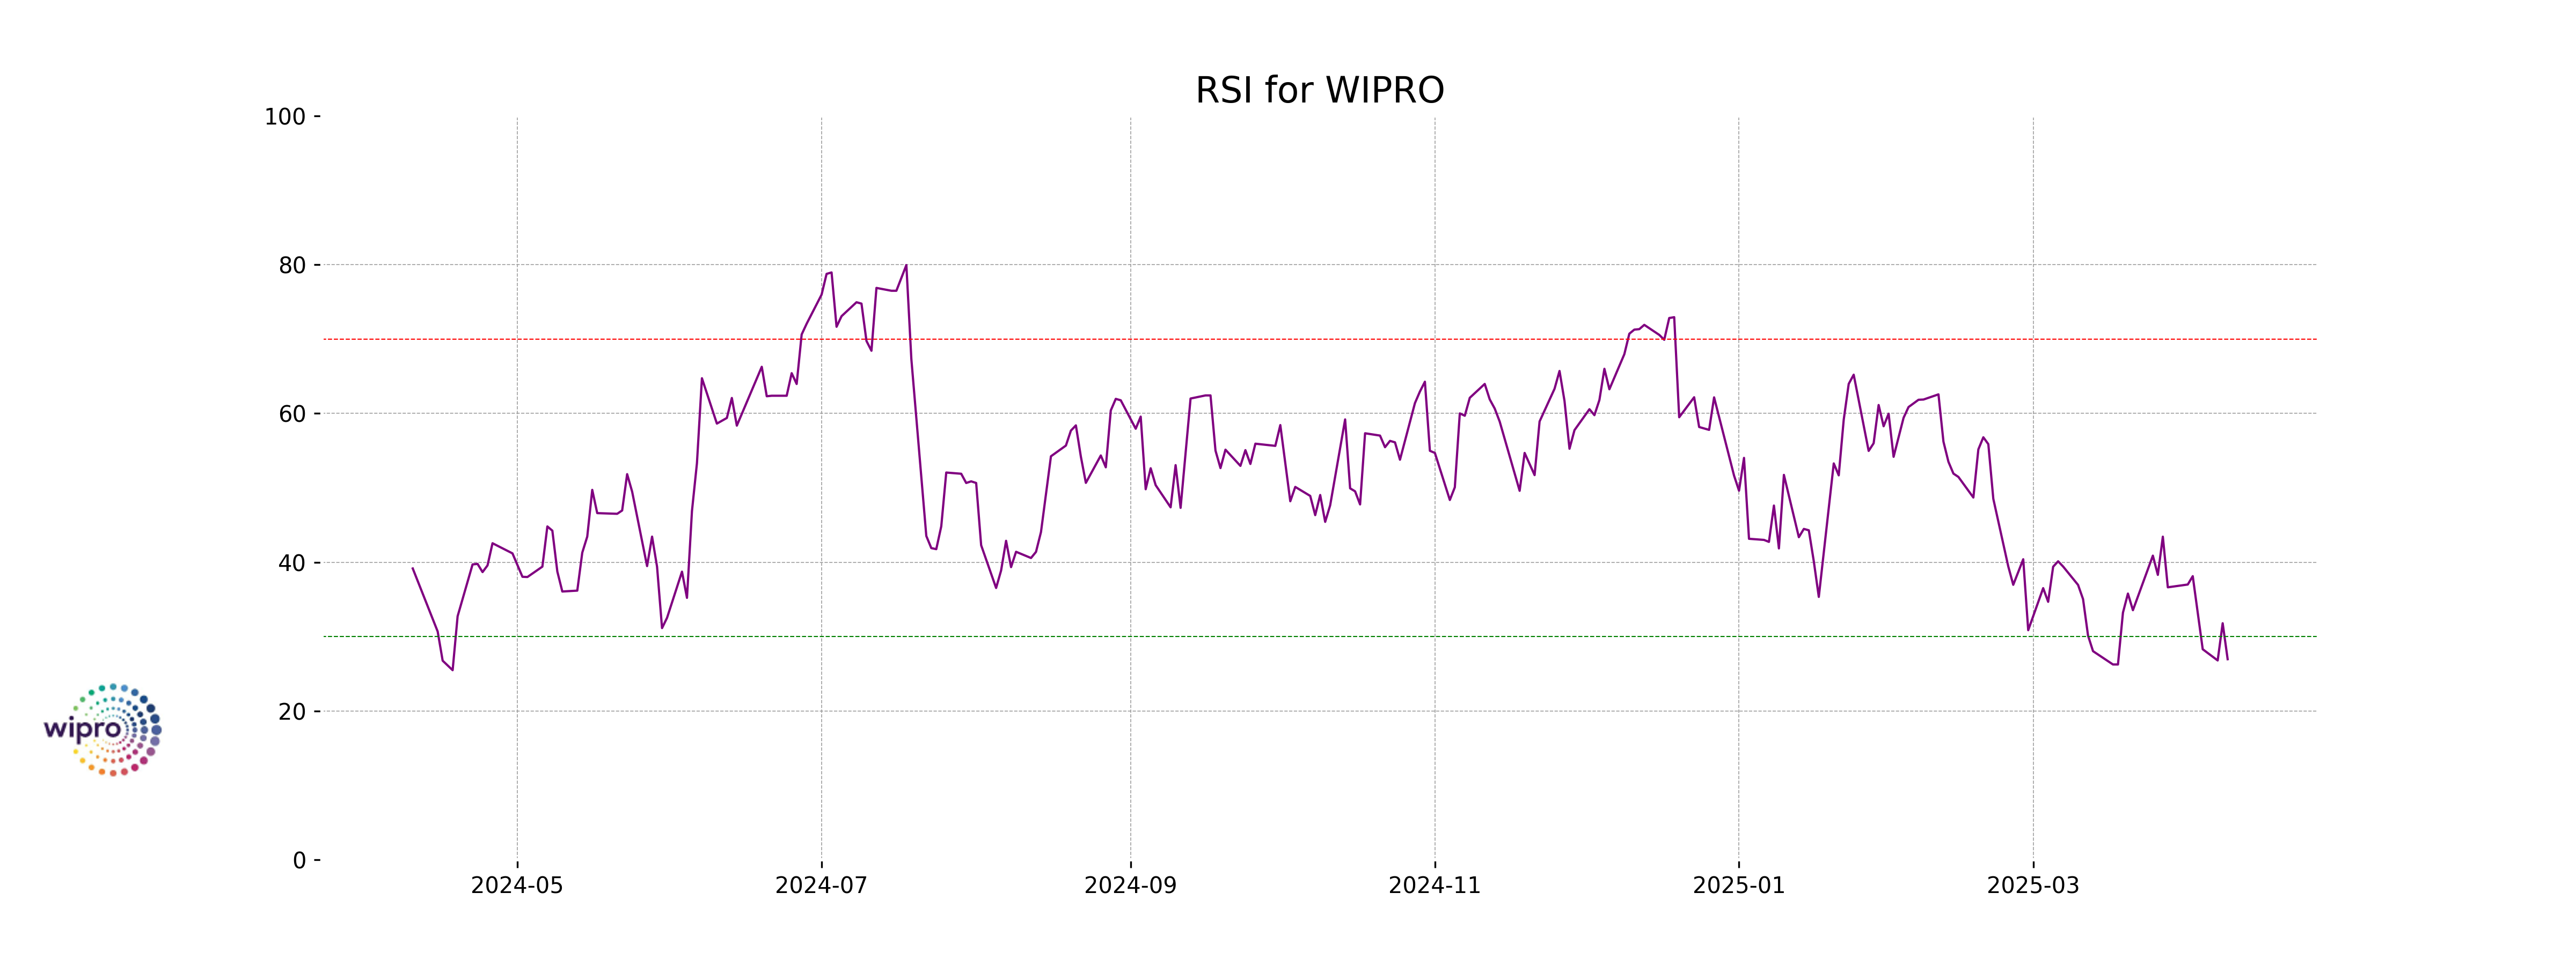
Wipro experienced a decline in its stock performance, with a closing price of 236.65 compared to the previous close of 247.25, marking a percentage change of -4.29%. The stock's RSI value indicates it may be in oversold territory, and the MACD further suggests a downward trend. With a substantial market cap, Wipro operates in the Technology sector, specializing in Information Technology Services in India.
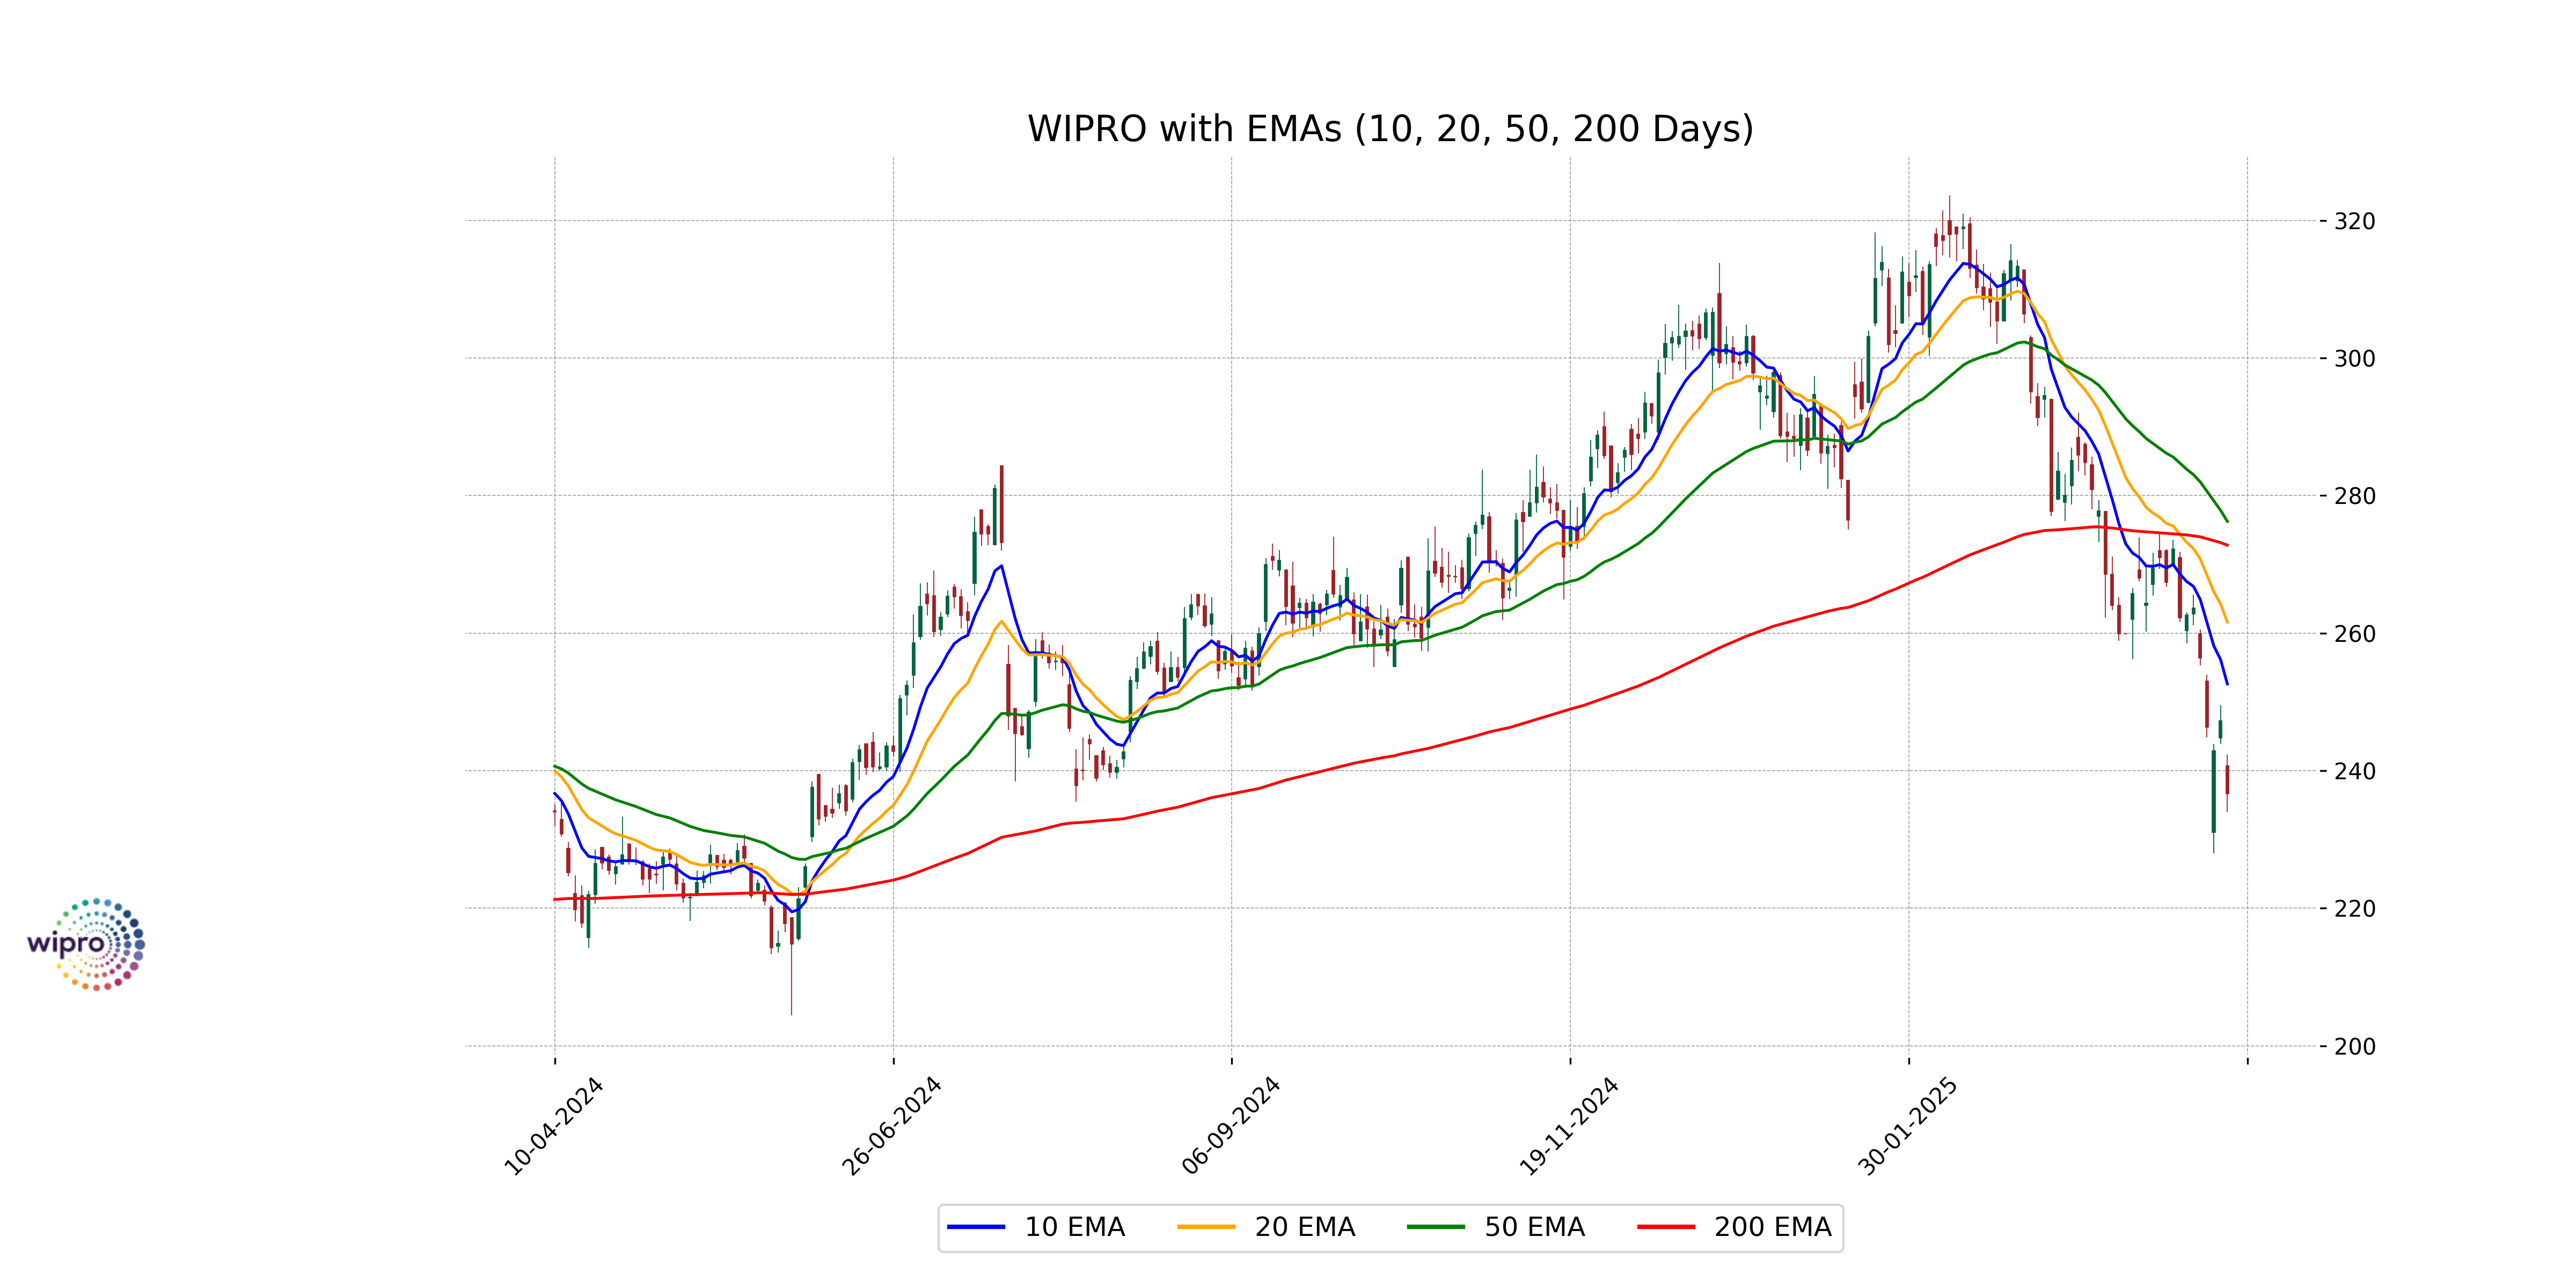
Relationship with Key Moving Averages
Wipro's current closing price of 236.65 is below its 50 EMA of 276.23, 200 EMA of 272.77, 20 EMA of 261.59, and 10 EMA of 252.60. This indicates a bearish trend as the stock is trading below all key moving averages.
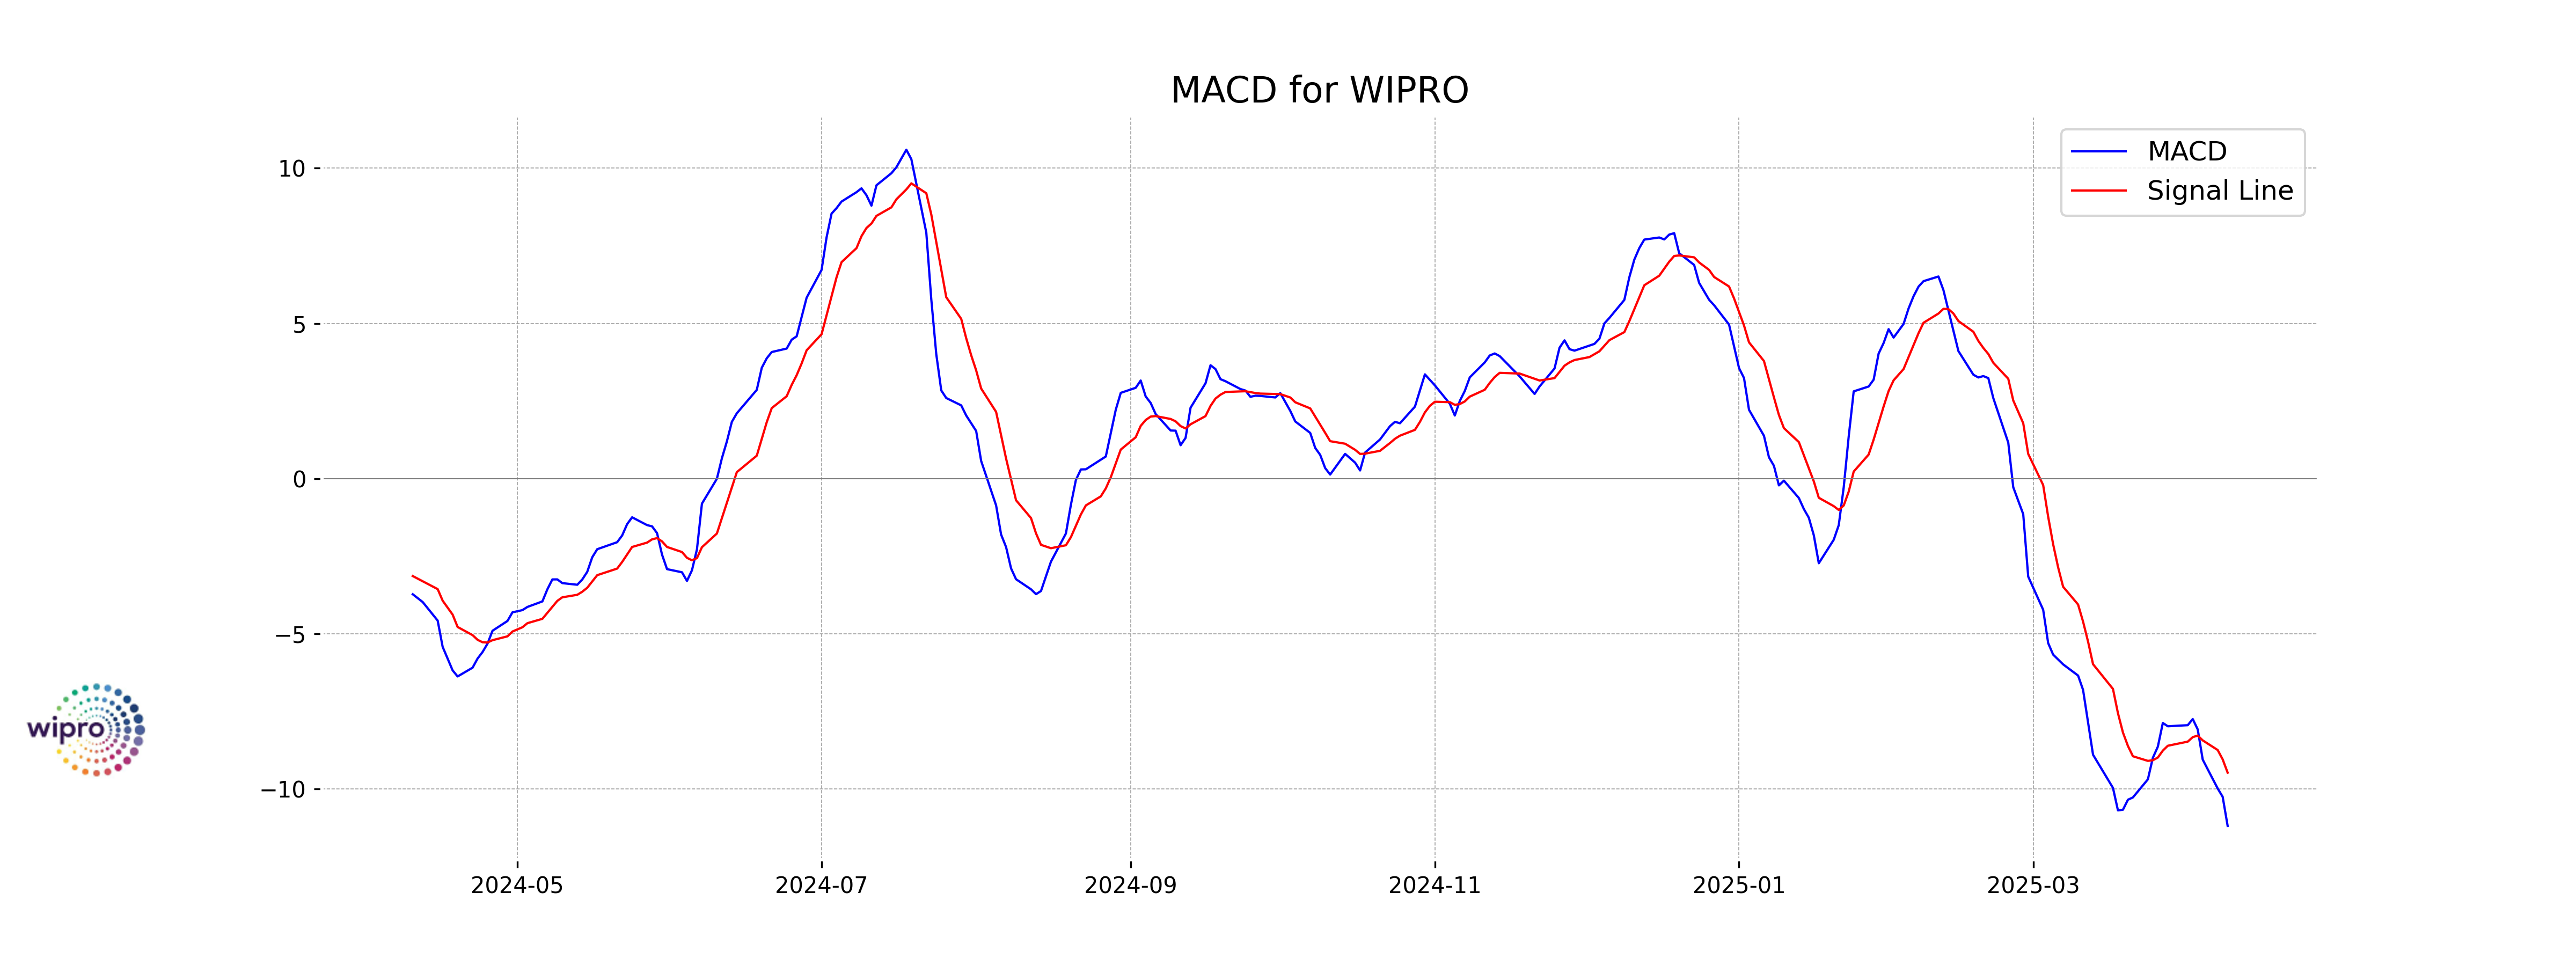
Moving Averages Trend (MACD)
Wipro's MACD value of -11.18, which is below the MACD Signal of -9.47, indicates a bearish trend as the momentum is negative. This suggests potential continued downward movement in the stock's price. With an RSI of 26.96, the stock may be oversold, warranting closer monitoring for any reversal signals.
RSI Analysis
The RSI (Relative Strength Index) for Wipro is 26.96, which indicates that the stock is in the oversold territory. An RSI below 30 typically suggests that the stock may be undervalued, and there could be potential for an upward price movement if the trend reverses.