NSE Nifty 50: Top 5 stock losers of March 21, 2025
In this article, we will explore the technical indicators of some of the low-performing stocks on the Indian stock market, including HINDALCO, INFY, TATASTEEL, TRENT, and WIPRO.
By looking at these stocks through the lens of key technical factors, we aim to better understand their price movements, trends, and potential future performance.

Analysis for HINDALCO - March 21, 2025
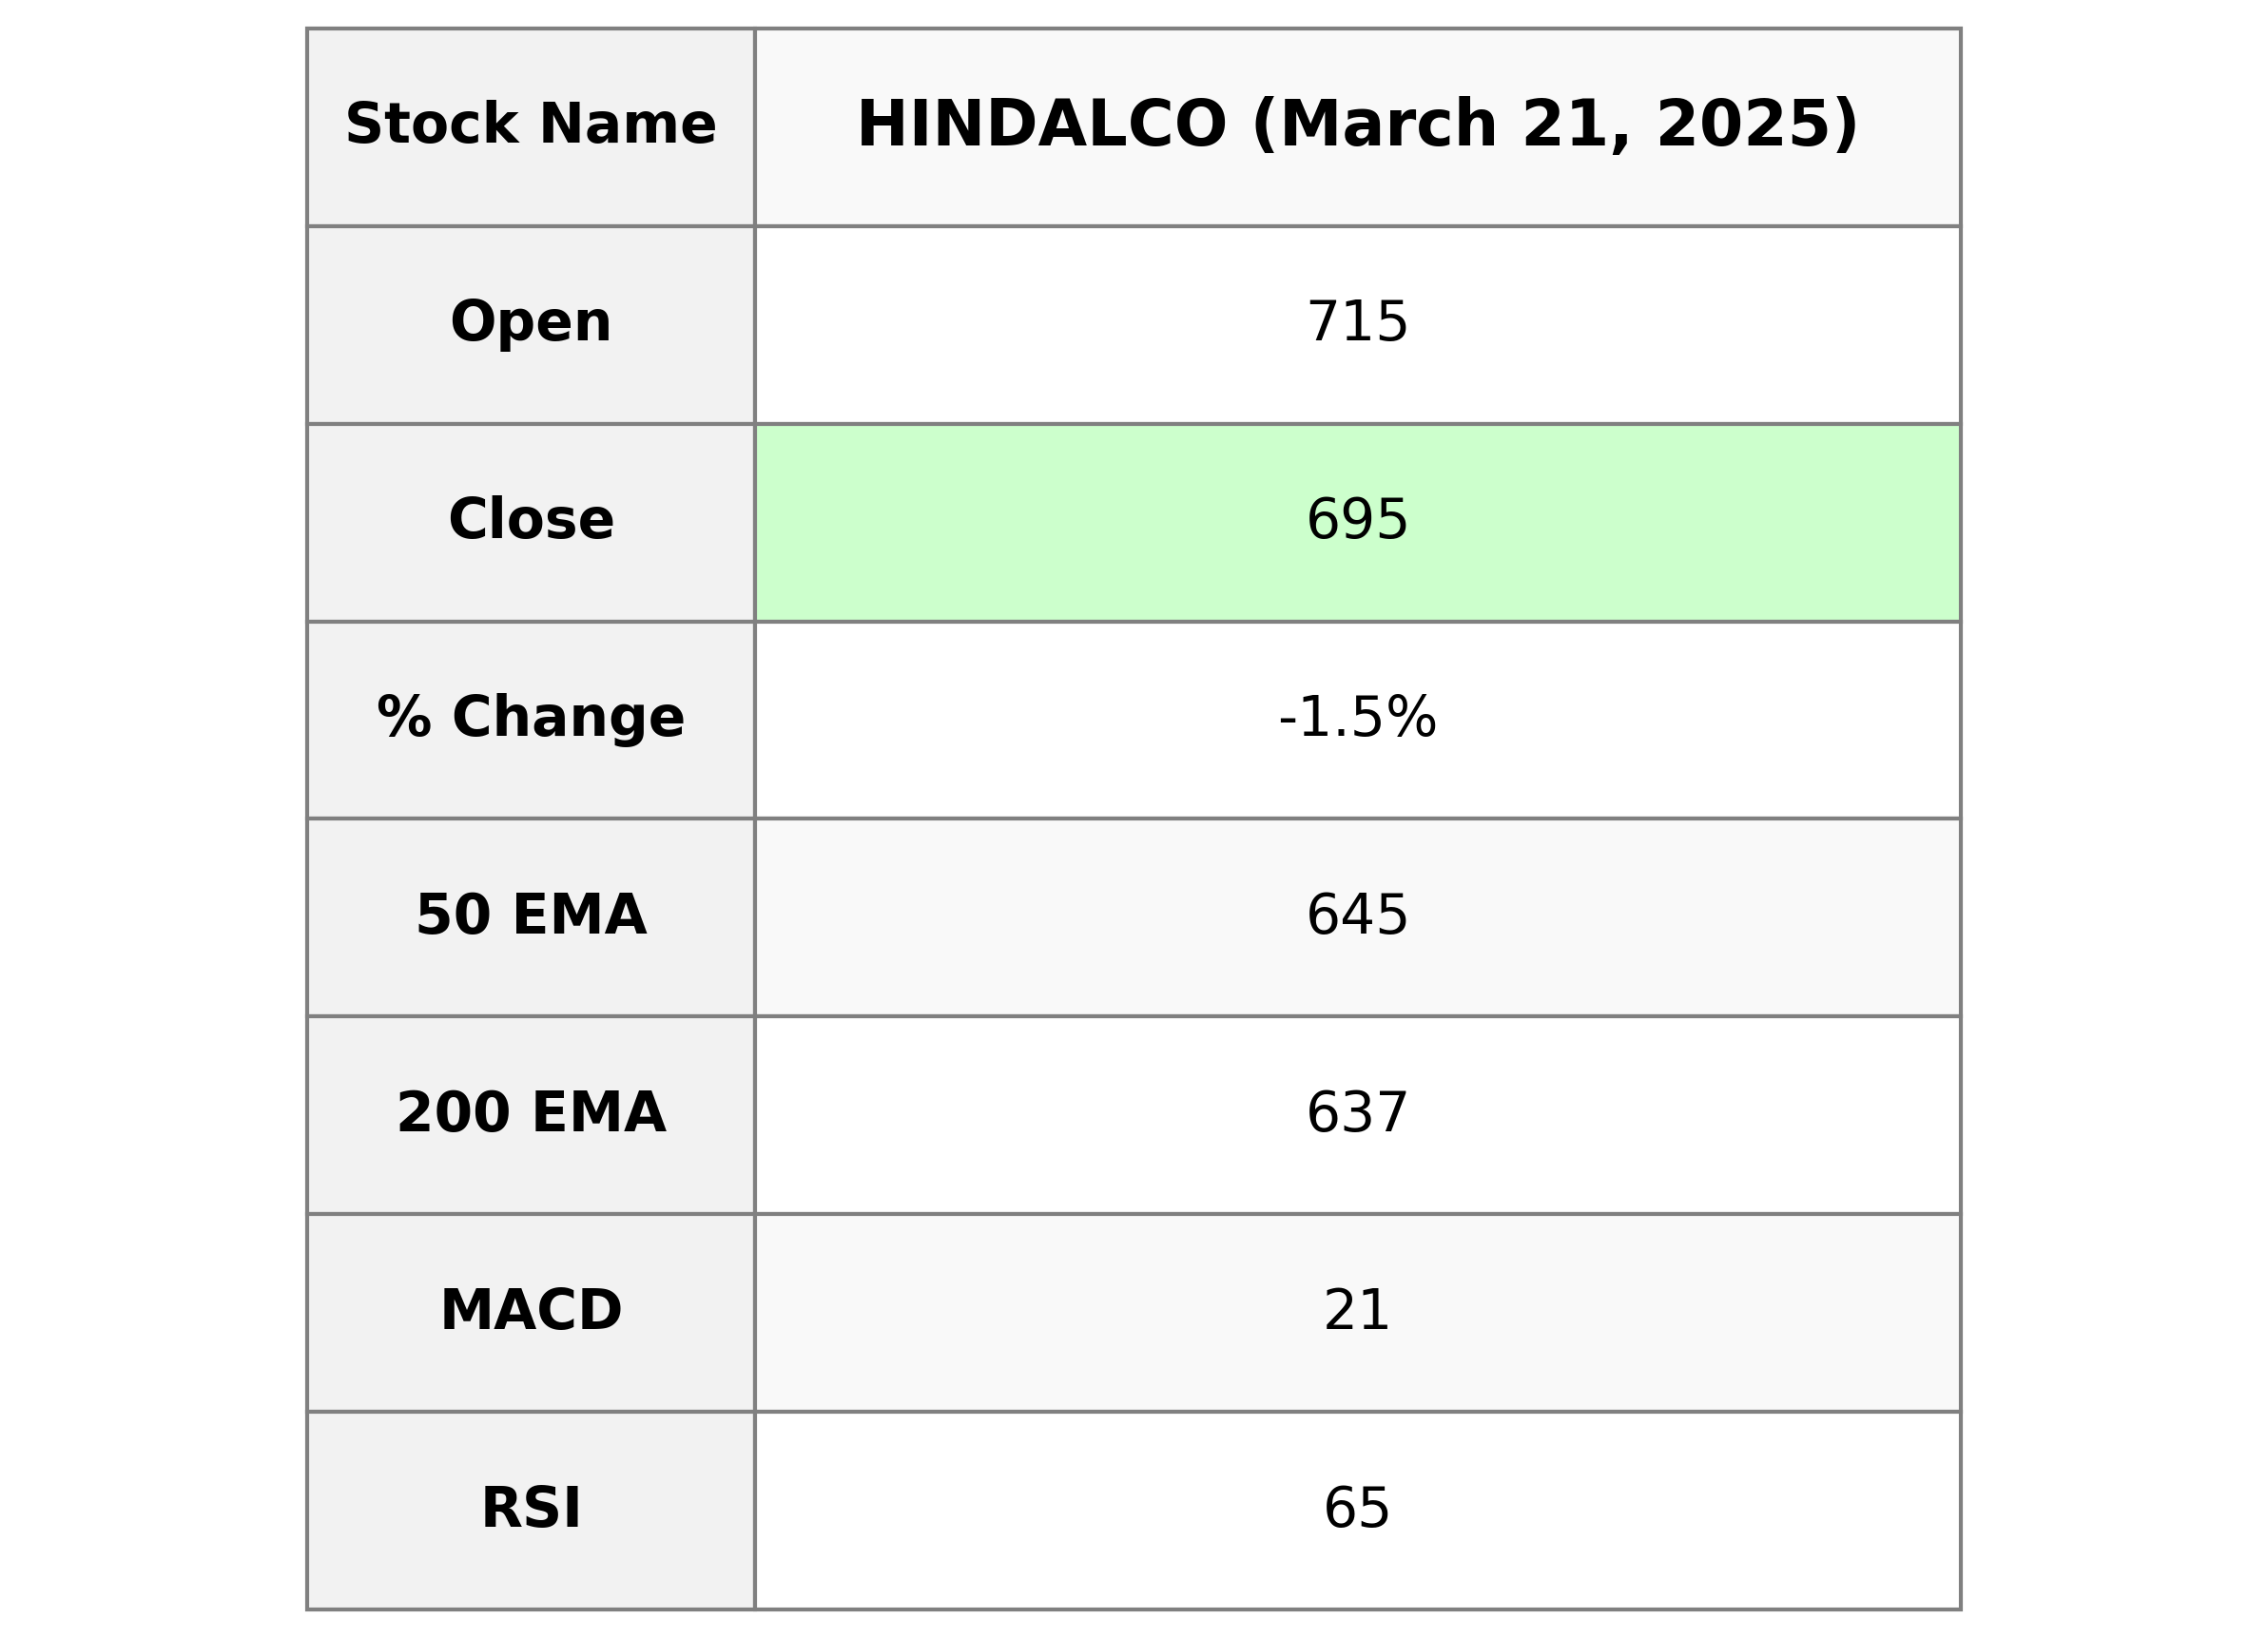
### HINDALCO Performance Hindalco opened at 715.0 and experienced fluctuations within the range of 694.20 to 715.0, closing at 695.35, which represents a decrease of 1.50% from the previous close of 705.95. Despite the decline, the 50-day EMA of 645.01 and 200-day EMA of 636.65 indicate a strong support level, while a current RSI of 65.36 reflects a moderate momentum. The company's PE Ratio stands at 11.14 with an EPS of 62.41, and it has a market cap of 1,543.75 billion INR, positioning it strongly within the Aluminum sector in India.

Relationship with Key Moving Averages
Hindalco's current closing price of 695.35 is above its 50 EMA of 645.01 and 200 EMA of 636.65, indicating a bullish trend in the short to medium term. However, it is slightly above its 10 EMA of 685.94 and 20 EMA of 668.93, suggesting potential short-term volatility.
Moving Averages Trend (MACD)
The MACD for Hindalco shows a positive trend with a value of 21.46, which is above the MACD Signal line at 19.86, suggesting a bullish momentum. This indicates that the stock may experience further upward movement in the near term.

RSI Analysis
Hindalco's RSI is at 65.36, indicating that the stock is approaching overbought conditions but is not quite there yet. Typically, an RSI above 70 suggests overbought conditions, whereas a value below 30 suggests oversold conditions; therefore, the current RSI suggests moderate strength in the stock's momentum.

Analysis for Infosys - March 21, 2025

Infosys Performance: Infosys, a leading entity in India's Information Technology Services sector, exhibited a modest decline in stock performance with a close price of 1,592.55 after opening at 1,577.95. The stock experienced a negative percentage change of -1.42% with a notable volume of 10,072,913 shares. Despite exhibiting a weakened relative strength index (RSI) of 30.56, indicative of being oversold, the company maintains a healthy market cap of over 6.5 trillion rupees.

Relationship with Key Moving Averages
Infosys is currently trading below its key moving averages, including the 10 EMA (1623.84), 20 EMA (1674.10), 50 EMA (1761.67), and 200 EMA (1771.17). This indicates a bearish sentiment as the stock price is below these important levels, suggesting a downtrend in the short to long term.
Moving Averages Trend (MACD)
For Infosys, the MACD value is -64.34, which is below the MACD signal of -60.10. This indicates a bearish trend, suggesting that the stock might continue to experience downward momentum.

RSI Analysis
The RSI (Relative Strength Index) for Infosys stands at 30.56, indicating that the stock is approaching the oversold territory. An RSI below 30 often suggests that the stock may be undervalued, potentially signaling a buying opportunity for investors.

Analysis for Tata Steel - March 21, 2025

Tata Steel Performance: Tata Steel has experienced a slight decline of approximately 1.11% in its stock value, with the closing price at 157.28, down from the previous close of 159.04. Despite the recent decrease, key indicators such as the Relative Strength Index (RSI) at 73 indicate strong momentum, and the stock's performance has been above both the 50 and 200 EMA, suggesting a robust trend. Additionally, the company's high Market Capitalization and a PE Ratio of 71.17 reflect investor confidence and anticipation of growth in the steel sector.

Relationship with Key Moving Averages
Tata Steel's closing price of 157.28 is significantly above its 50-day EMA of 142.67 and its 200-day EMA of 144.83, indicating a bullish trend. Additionally, it is also above the 10-day EMA of 153.05 and 20-day EMA of 148.34, signaling positive short-term and long-term momentum.
Moving Averages Trend (MACD)
The MACD for Tata Steel stands at 5.61, which is above the MACD Signal line of 4.61. This indicates a bullish momentum, suggesting a potential continuation of upward movement in stock price. However, investors might want to consider other indicators as well due to the RSI being on the higher side at 73.05.

RSI Analysis
RSI Analysis for Tata Steel: The Relative Strength Index (RSI) for Tata Steel is 73.05, which indicates that the stock is in the overbought territory. This suggests that the stock may be due for a price correction or consolidation in the short term.

Analysis for Trent - March 21, 2025

Trent Performance Trent's recent market performance shows a slight decline, with a closing price of 5150.05, down by approximately 1.37% from the previous close of 5221.55. The stock's RSI indicates neutral momentum, and its MACD suggests a bearish trend. The company operates in the Consumer Cyclical sector, specifically in Apparel Retail, and is based in India.

Relationship with Key Moving Averages
Trent is currently trading below its key moving averages, as the stock's closing price of 5150.05 is under the 10 EMA of 5116.41, the 20 EMA of 5127.05, the 50 EMA of 5462.71, and the 200 EMA of 5778.11. This positioning suggests a short-term bearish sentiment, as the stock struggles to maintain above these important technical levels.
Moving Averages Trend (MACD)
Trent's MACD value of -68.79 indicates a bearish trend, as it is negative and below the MACD Signal line, which is at -132.09. This suggests that the stock may continue to face downward pressure in the short term.

RSI Analysis
Trent's RSI is at 48.32, which is close to the neutral mark of 50, suggesting that the stock is neither overbought nor oversold. This level indicates potential consolidation and balance in buying and selling pressures.

Analysis for Wipro - March 21, 2025

Wipro has experienced a decline in its stock price with a closing value of 264.30, reflecting a percentage change of -1.38% from the previous close. The RSI is 33.55, indicating a potentially oversold condition, while both the 50-day and 200-day EMAs are higher than the current price, suggesting a bearish trend. The company's market cap stands at 2,764.63 billion INR, positioned in the Technology sector, specifically in Information Technology Services.

Relationship with Key Moving Averages
### Relationship with Key Moving Averages for Wipro The current closing price of Wipro at 264.30 is below the 10-day EMA at 269.76, the 50-day EMA at 288.28, and the 200-day EMA at 274.64, indicating a bearish trend. This suggests that Wipro is currently trading below its recent and long-term average prices.
Moving Averages Trend (MACD)
Wipro's MACD at -10.27, along with the signal line at -8.94, suggests a bearish trend as the MACD line is below the signal line. This indicates potential downward momentum. Investors should cautiously monitor the trend for signs of reversal or further decline.

RSI Analysis
Wipro's RSI is currently at 33.55, indicating that the stock is approaching oversold territory. An RSI below 30 is generally considered oversold, suggesting potential buying opportunities. However, it's essential to consider other factors and indicators before making investment decisions.
