Global stock market indices: How the world markets performed today - 11 March 2025
The international stock market indices showed varied performances on March 11, 2025, reflecting the economic sentiment across different regions.
In this article, we analyze the performance of key global indices including the S&P 500, Dow Jones Industrial Average, NASDAQ Composite, FTSE 100, DAX, CAC 40, IBEX 35, Nikkei 225, Hang Seng, Nifty 50, and BSE Sensex.

Analysis for Sensex - March 11, 2025

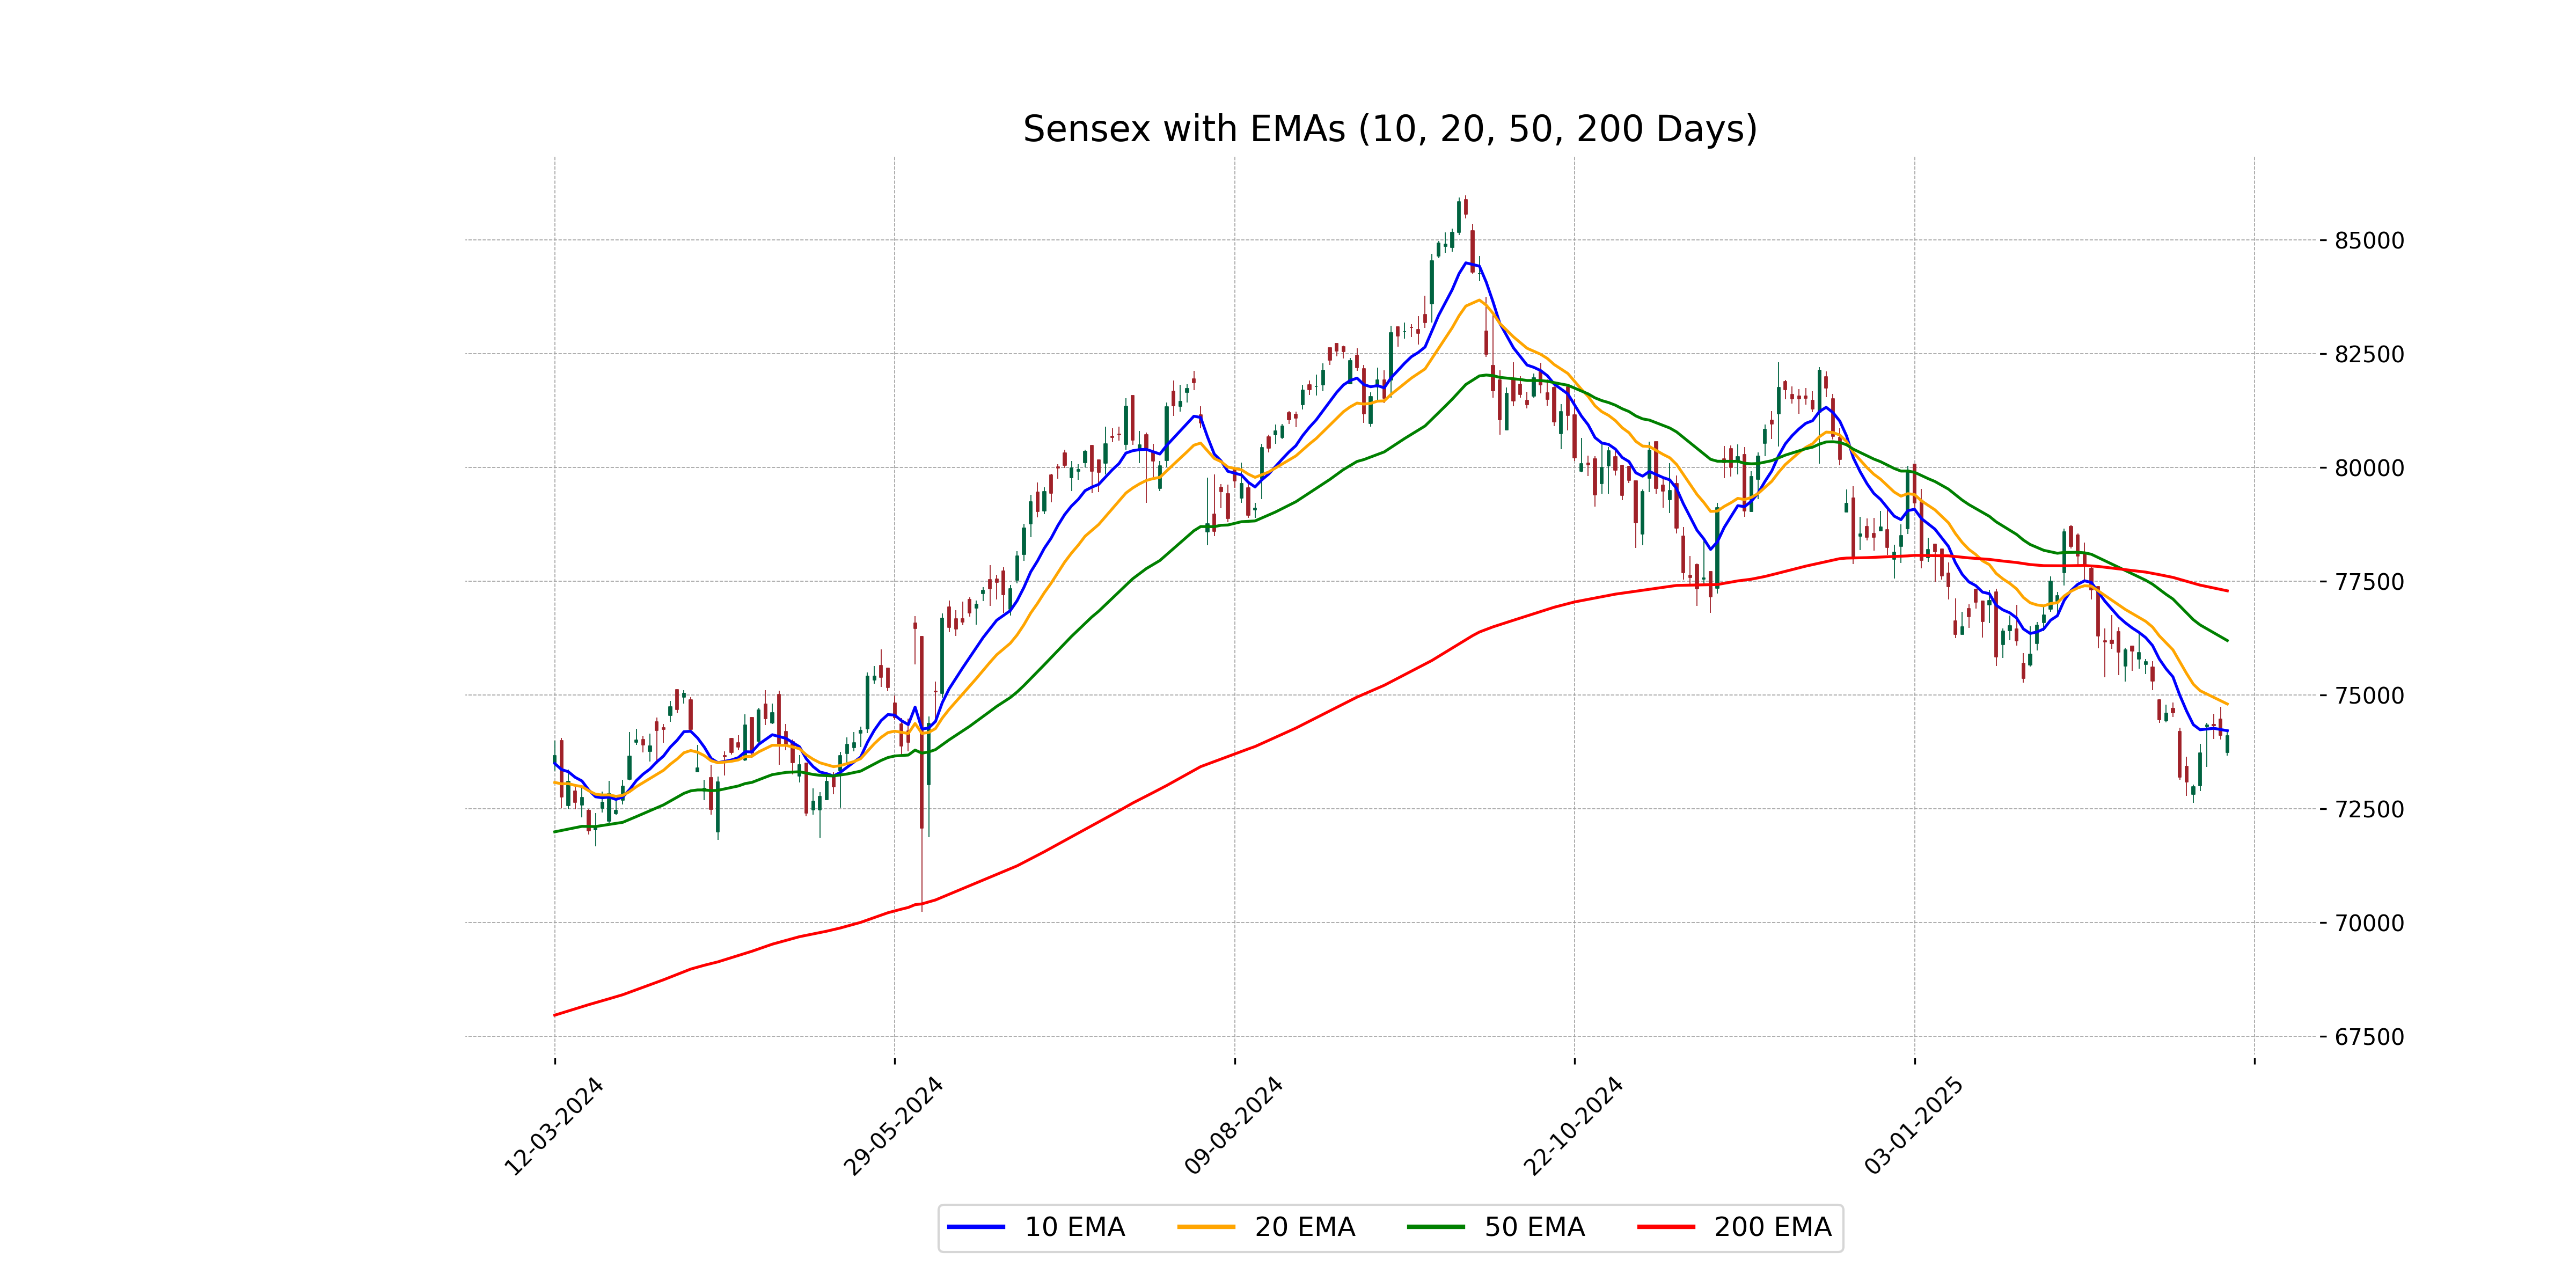
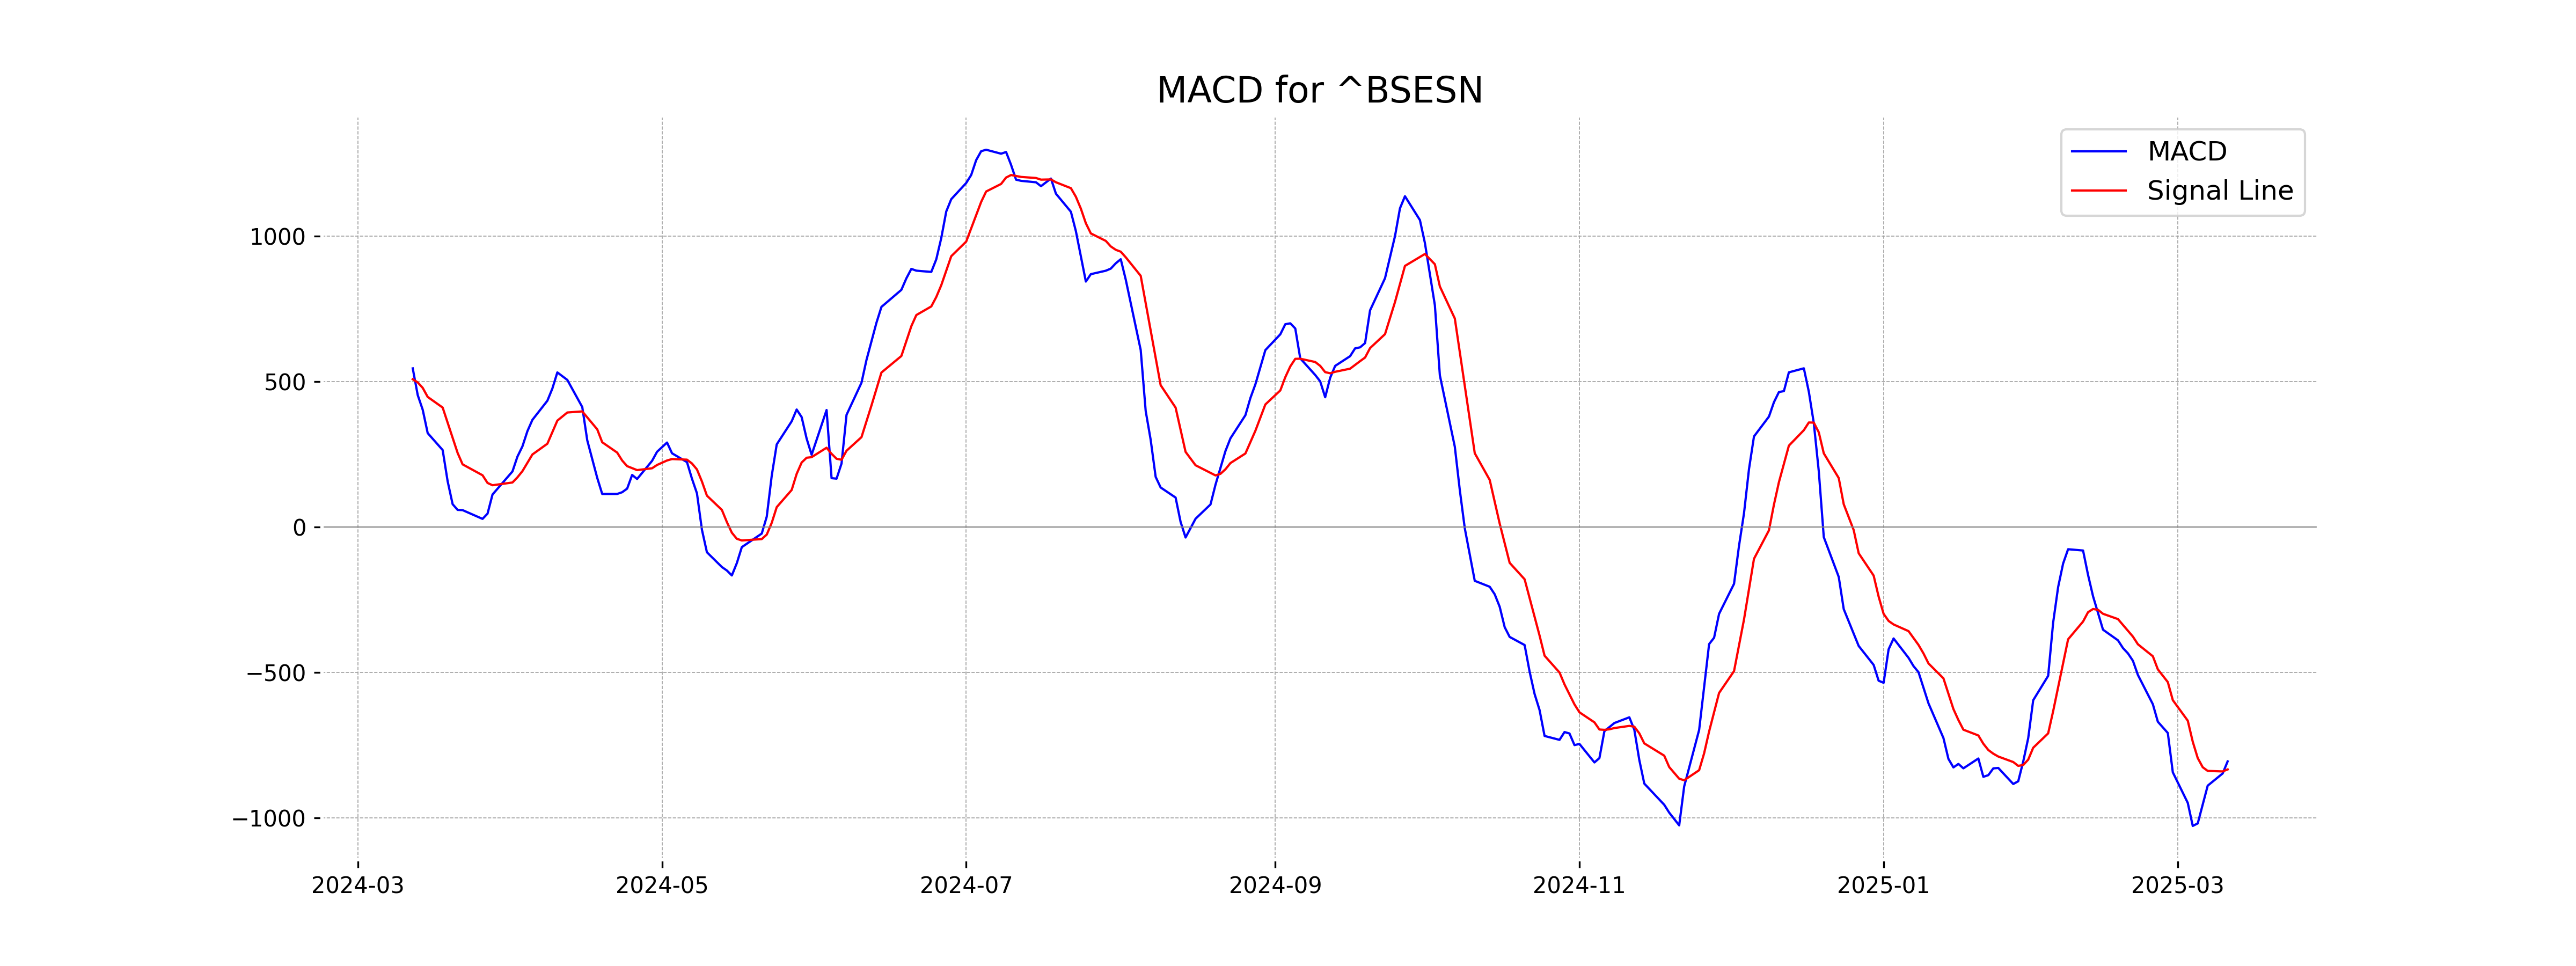
The Sensex experienced a slight decline, closing at 74102.32 with a marginal percentage change of -0.017%. The stock is trading below its 50-day and 200-day EMAs, indicating a bearish trend, with an RSI of 38.35 suggesting the market is nearing oversold conditions. The MACD line is also below the signal line, reinforcing the negative sentiment.
Relationship with Key Moving Averages
The Sensex's current close of 74102.32 is below the 50-day EMA of 76197.70 and the 200-day EMA of 77290.41, indicating a bearish trend with potential resistance from these key moving averages. Additionally, the close is slightly below the 10-day EMA of 74216.32 and significantly below the 20-day EMA of 74803.57, suggesting short-term downward momentum.
Moving Averages Trend (MACD)
The MACD value for Sensex is -805.30 while the MACD Signal is -832.94. This indicates that Sensex is currently exhibiting bearish momentum, as the MACD is below the signal line and both values are negative.
RSI Analysis
Based on the current RSI of 38.35, the Sensex is in the lower range, indicating that the index may be approaching an oversold condition. This suggests a potential buying opportunity, as a low RSI often precedes a market bounce or trend reversal.

Analysis for Dow Jones Industrial Average (US) - March 11, 2025

The Dow Jones Industrial Average (US) opened at 42,507.65 and closed at 41,911.71, experiencing a significant loss with a points change of -890.01 and a percent change of -2.08%. The RSI indicates a potentially oversold market at 33.48, while the MACD suggests bearish momentum.

Relationship with Key Moving Averages
The Dow Jones Industrial Average (US) closed below its 50-day and 200-day EMAs, indicating potential bearish sentiment. Furthermore, the close was significantly under the 10-day and 20-day EMAs, reinforcing the downward trend.
Moving Averages Trend (MACD)
The Dow Jones Industrial Average (US) shows a bearish momentum as reflected by a negative MACD of -425.84, which is below its MACD Signal of -230.29. This suggests downside pressure, indicating a sell signal or weakening price trend in the short term.

RSI Analysis
The RSI for the Dow Jones Industrial Average is currently at 33.48, suggesting that the index is approaching oversold conditions as it is below the typical threshold of 30. This may indicate potential for reversal or a continued bearish trend if other indicators also confirm this sentiment.

Analysis for CAC 40 (France) - March 11, 2025

CAC 40 (France) opened at 8092.02, with a high of 8111.22 and a low of 8056.80, finally closing at 8068.07, representing a 0.25% increase from its previous close. The market showed moderate gains as the RSI indicates a balanced momentum at 51.58, while the MACD suggests a weakening uptrend.

Relationship with Key Moving Averages
The CAC 40 index closed at 8068.07, slightly above its 50-EMA of 7914.75 and 200-EMA of 7662.40, indicating a positive short to medium-term momentum. However, it closed below its 10-EMA of 8107.82 and 20-EMA of 8081.85, suggesting potential short-term resistance.
Moving Averages Trend (MACD)
Based on the stock data for CAC 40 (France), the MACD value is 56.36, which is below the MACD Signal of 81.51. This suggests a bearish trend, as the MACD line is below the signal line, indicating potential selling signals in the market.

RSI Analysis
The Relative Strength Index (RSI) for the CAC 40 is 51.58, indicating a neutral position as it is close to the mid-point of 50. This suggests that the index is neither overbought nor oversold at its current level, providing a balanced market sentiment.

Analysis for FTSE 100 (UK) - March 11, 2025

FTSE 100 (UK) Performance: The FTSE 100 closed at 8589.94, reflecting a slight decline of 0.12% or a drop of 10.26 points from its previous close. The market exhibited a trading range with a high of 8603.93 and a low of 8572.82. The RSI of 42.49 suggests moderately weak momentum, while the MACD of 18.72 indicates a bearish trend compared to its signal line.

Relationship with Key Moving Averages
The closing price of FTSE 100 at 8589.94 is slightly above its 50-day EMA of 8587.94, suggesting a recent stabilization around this average. However, it remains below the 10-day and 20-day EMAs, which are 8685.55 and 8687.99 respectively, indicating short-term bearish momentum. Additionally, the index is well above its 200-day EMA of 8312.77, suggesting a longer-term upward trend is still intact.
Moving Averages Trend (MACD)
The MACD for the FTSE 100 shows a value of 18.72, which is below the MACD Signal value of 48.06. This suggests a bearish trend, indicating potential downward momentum. Additionally, the RSI of 42.49 suggests that the market is neither overbought nor oversold, but close to a bearish sentiment.

RSI Analysis
FTSE 100 RSI Analysis: The Relative Strength Index (RSI) for the FTSE 100 is currently at 42.49, which indicates that the index is in the neutral to slightly oversold range. This suggests there may be some selling pressure, but it is not yet in the oversold territory below 30, where stronger buying signals might emerge.

Analysis for DAX (Germany) - March 11, 2025

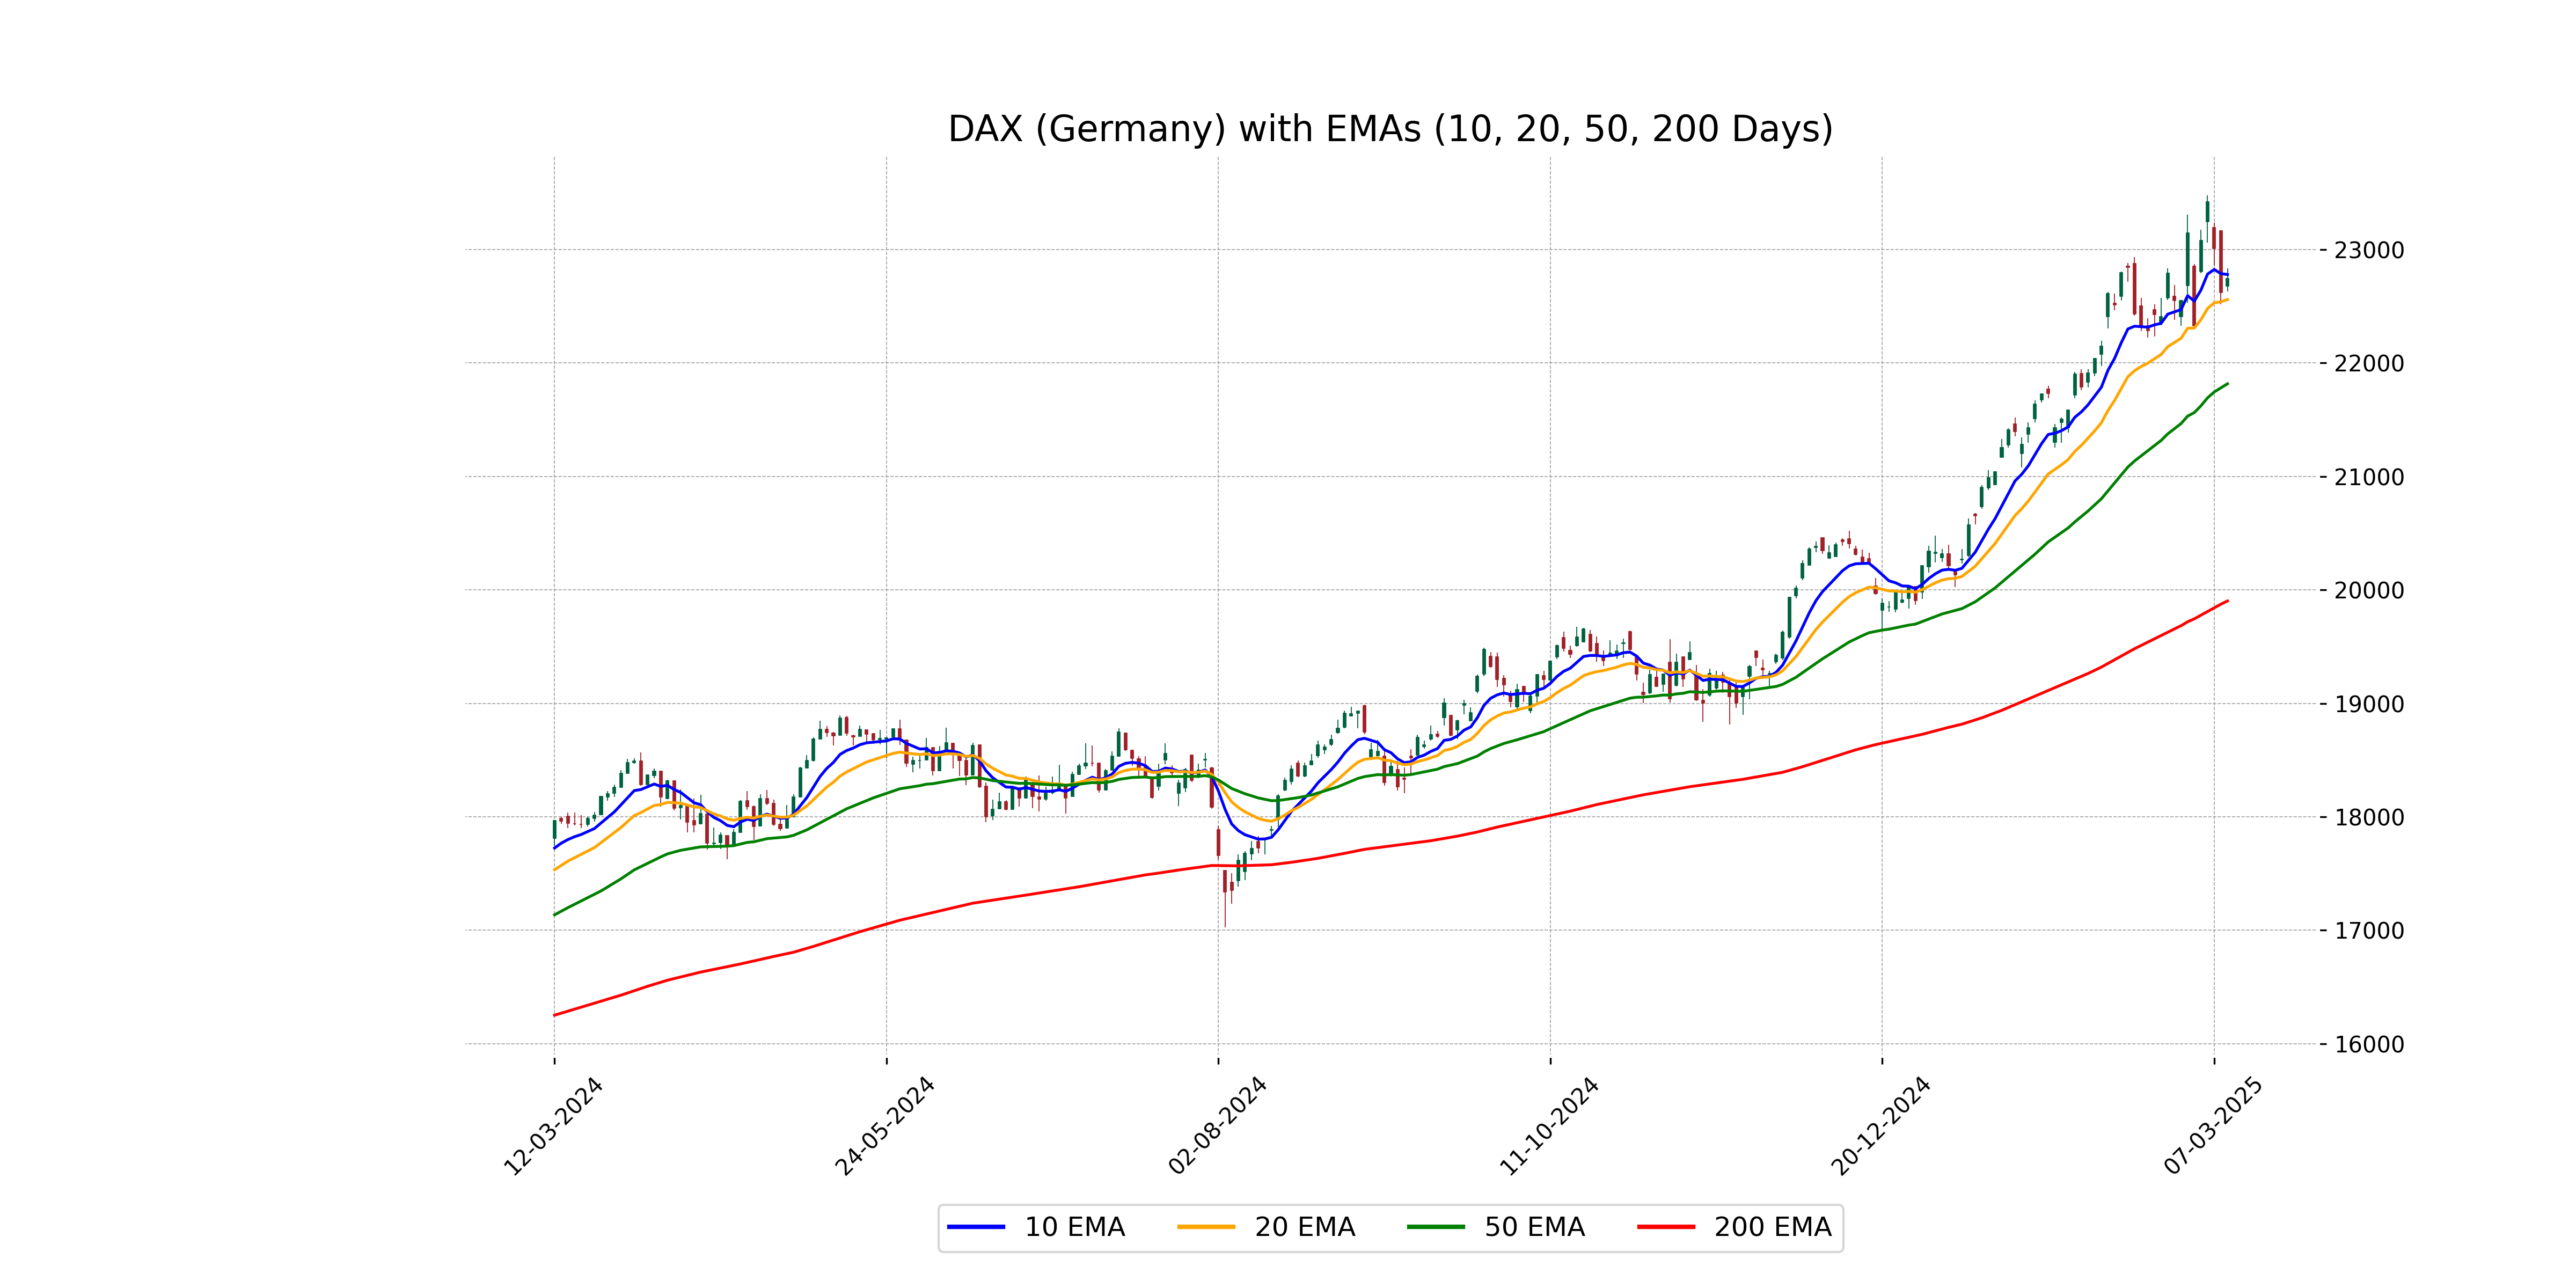
DAX (Germany) closed at 22746.17, marking a 0.55% increase from the previous close of 22620.95 with a points gain of 125.22. The RSI suggests a relatively neutral market sentiment at 55.06, while the MACD indicates a potential slowing momentum with a figure of 340.04 below the signal line of 385.30. The data lacks specific market cap, PE ratio, and additional economic indicators.
Relationship with Key Moving Averages
The DAX (Germany) closed at 22746.17, which is above its 50-day EMA (21816.74) and 200-day EMA (19902.56), suggesting a bullish trend. However, it closed below its 10-day EMA (22780.06) but above its 20-day EMA (22559.02), indicating some recent short-term pressure.
Moving Averages Trend (MACD)
The MACD analysis for DAX indicates a bearish trend as the MACD line (340.04) is below the MACD Signal line (385.30). This suggests that the momentum in the DAX is currently on a slight decline.

RSI Analysis
Based on the given stock data for DAX (Germany), the Relative Strength Index (RSI) is 55.06, indicating a neutral to slightly overbought condition. The RSI is below 70, suggesting there is still room for upward movement before entering overbought territory.

Analysis for S&P 500 (US) - March 11, 2025

S&P 500 (US) Performance: The S&P 500 experienced a decline, with a closing value of 5614.56, representing a -2.70% change from the previous close. The index's RSI of 29.92 indicates oversold conditions, and the MACD suggests a downward momentum trend.

Relationship with Key Moving Averages
The closing price of the S&P 500 is below the 10-day, 20-day, 50-day, and 200-day EMAs, indicating a bearish trend. The RSI is 29.92, suggesting the index is oversold. Additionally, the MACD is negative at -81.32, below the MACD Signal line, reinforcing the bearish sentiment.
Moving Averages Trend (MACD)
MACD Analysis for S&P 500 (US): The MACD for the S&P 500 is currently at -81.32, with a signal line of -42.85, indicating a bearish momentum as the MACD is below the signal line. This suggests that the index may continue to experience downward pressure unless there is a reversal in trend.

RSI Analysis
The RSI of 29.92 for the S&P 500 indicates that the index may be in oversold territory. This suggests a potential buying opportunity if the market reverses. However, investors should be cautious as this low RSI can also point to bearish momentum.

Analysis for Hang Seng Index (Hong Kong) - March 11, 2025

The Hang Seng Index opened at 23,274.86, reaching a high of 23,858.61 and a low of 23,238.36, closing slightly down at 23,782.14 compared to the previous close. The index shows a minor decrease of 0.01% in points from the previous day. The RSI is at 63.11, indicating a moderately strong momentum in the current trend.

Relationship with Key Moving Averages
Hang Seng Index's current close of 23,782.14 is above the 50-day EMA of 21,831.65 and the 200-day EMA of 19,853.39, indicating a bullish trend. Additionally, it is slightly above the 10-day EMA of 23,590.34, suggesting recent strong performance, although the less than stellar MACD value relative to the signal hints at potential consolidation.
Moving Averages Trend (MACD)
MACD Analysis for Hang Seng Index (Hong Kong): The MACD line is at 761.60, while the MACD Signal line is at 785.05, indicating that the MACD is below its signal line. This suggests a bearish momentum or a sell signal in the market.

RSI Analysis
Based on the stock data for Hang Seng Index Hong Kong, the RSI (Relative Strength Index) is 63.11. This indicates a relatively strong momentum, as it's above 50 but still below the overbought threshold of 70. The index seems to be in a moderately bullish phase.

Analysis for IBEX 35 (Spain) - March 11, 2025

IBEX 35 (Spain) experienced a slight decline with a closing value of 13,069.40, down by 0.10% from the previous close of 13,082.70. The index showed a modest intraday range with a high of 13,136.80 and a low of 13,027.30, indicating a relatively stable trading session. The current RSI value of 55.63 suggests neither overbought nor oversold conditions, while the MACD indicates some bearishness as it is below the MACD Signal.

Relationship with Key Moving Averages
The IBEX 35 closed slightly below its 10-day EMA of 13147.61, indicating short-term bearish momentum, but remains above both its 50-day EMA of 12631.46 and 200-day EMA of 11755.83, suggesting a continued overall bullish trend.
Moving Averages Trend (MACD)
The IBEX 35's current MACD of 189.94 is below the Signal Line of 238.24, indicating a bearish outlook as downward momentum might be increasing. Investors might consider monitoring for potential trends before taking action.

RSI Analysis
The current Relative Strength Index (RSI) for IBEX 35 is 55.63, indicating a neutral stance in terms of market momentum. With the RSI neither in overbought conditions above 70 nor oversold conditions below 30, it suggests a balance between buying and selling pressures.

Analysis for NASDAQ Composite (US) - March 11, 2025

The NASDAQ Composite (US) opened at 17,840.32, reached a high of 17,868.08, and closed at 17,468.32, showing a significant decline from the previous close of 18,196.22. The index experienced a 4% drop, losing 727.90 points, with technical indicators such as the RSI at 27.75 suggesting oversold conditions. The volume traded was approximately 8.64 billion.

Relationship with Key Moving Averages
The NASDAQ Composite closed at 17,468.32, which is below its 50 EMA (19,179.59), 200 EMA (18,316.00), 10 EMA (18,413.76), and 20 EMA (18,833.79), indicating a bearish trend. The negative MACD of -447.47, descending RSI of 27.75, and significant points change of -727.90 reinforce the bearish sentiment.
Moving Averages Trend (MACD)
The MACD for the NASDAQ Composite is negative at -447.47, indicating downward momentum, with its signal line at -276.69. The MACD line being below the signal line suggests a bearish trend in the market.

RSI Analysis
The NASDAQ Composite has an RSI of 27.75, indicating that it is currently in an oversold condition. Such a low RSI suggests that the index may be experiencing selling pressure and could potentially be poised for a price correction or rebound if market sentiment changes.

Analysis for Nikkei 225 (Japan) - March 11, 2025

Nikkei 225 (Japan) opened at 36,584.37 with a high of 36,793.11 and a low of 35,987.13, closing at 36,793.11. Compared to the previous close of 37,028.27, it experienced a percentage change of -0.64% and a points change of -235.16. The RSI is at 34.39, suggesting it might be approaching an oversold condition. The MACD value of -555.59, paired with the signal line at -412.21, indicates a bearish trend.

Relationship with Key Moving Averages
The Nikkei 225's current close of 36,793.11 is below its 50-day EMA of 38,503.02, indicating a short-term bearish trend. Additionally, it is also below the 200-day EMA of 38,241.20, suggesting a potential longer-term downtrend. Its 10 and 20-day EMAs are at 37,459.89 and 37,947.79, respectively, both higher than the current close, further supporting the bearish outlook.
Moving Averages Trend (MACD)
The MACD for Nikkei 225 shows a negative value of -555.59, indicating a bearish trend. The MACD line is below the signal line (-412.21), suggesting downward momentum in the market.

RSI Analysis
The RSI for the Nikkei 225 is at 34.39, indicating that the index is approaching oversold territory. This implies that the index might be undervalued and could potentially see a price rebound if buying interest increases. However, caution is advised as RSI suggests weakness in the current momentum.

Analysis for Nifty Bank - March 11, 2025

Nifty Bank opened at 47874.80 and closed slightly lower at 47853.95, marking a decrease of 0.75% or a points change of -362.85 from the previous close of 48216.80. The RSI is at 35.41, indicating potential bearish momentum, while the MACD stands at -371.83, showing a negative trend below the signal line at -319.21.

Relationship with Key Moving Averages
Nifty Bank is trading below its key moving averages, with a current close of 47853.95 compared to its 10 EMA of 48414.72, 20 EMA of 48708.30, 50 EMA of 49383.40, and 200 EMA of 49957.14. This indicates a bearish sentiment in the market as the stock remains under these critical levels.
Moving Averages Trend (MACD)
The MACD for Nifty Bank is -371.83, which is below the MACD Signal Line at -319.21, indicating a bearish trend. This suggests that there may be downward momentum, as the MACD is in negative territory and moving further below the signal line.

RSI Analysis
The RSI for Nifty Bank is 35.41, which indicates that the index is approaching the oversold territory. This suggests that there might be potential for a price bounce or reversal if the current downtrend continues. However, it's essential to consider additional indicators and market conditions before making any investment decisions.

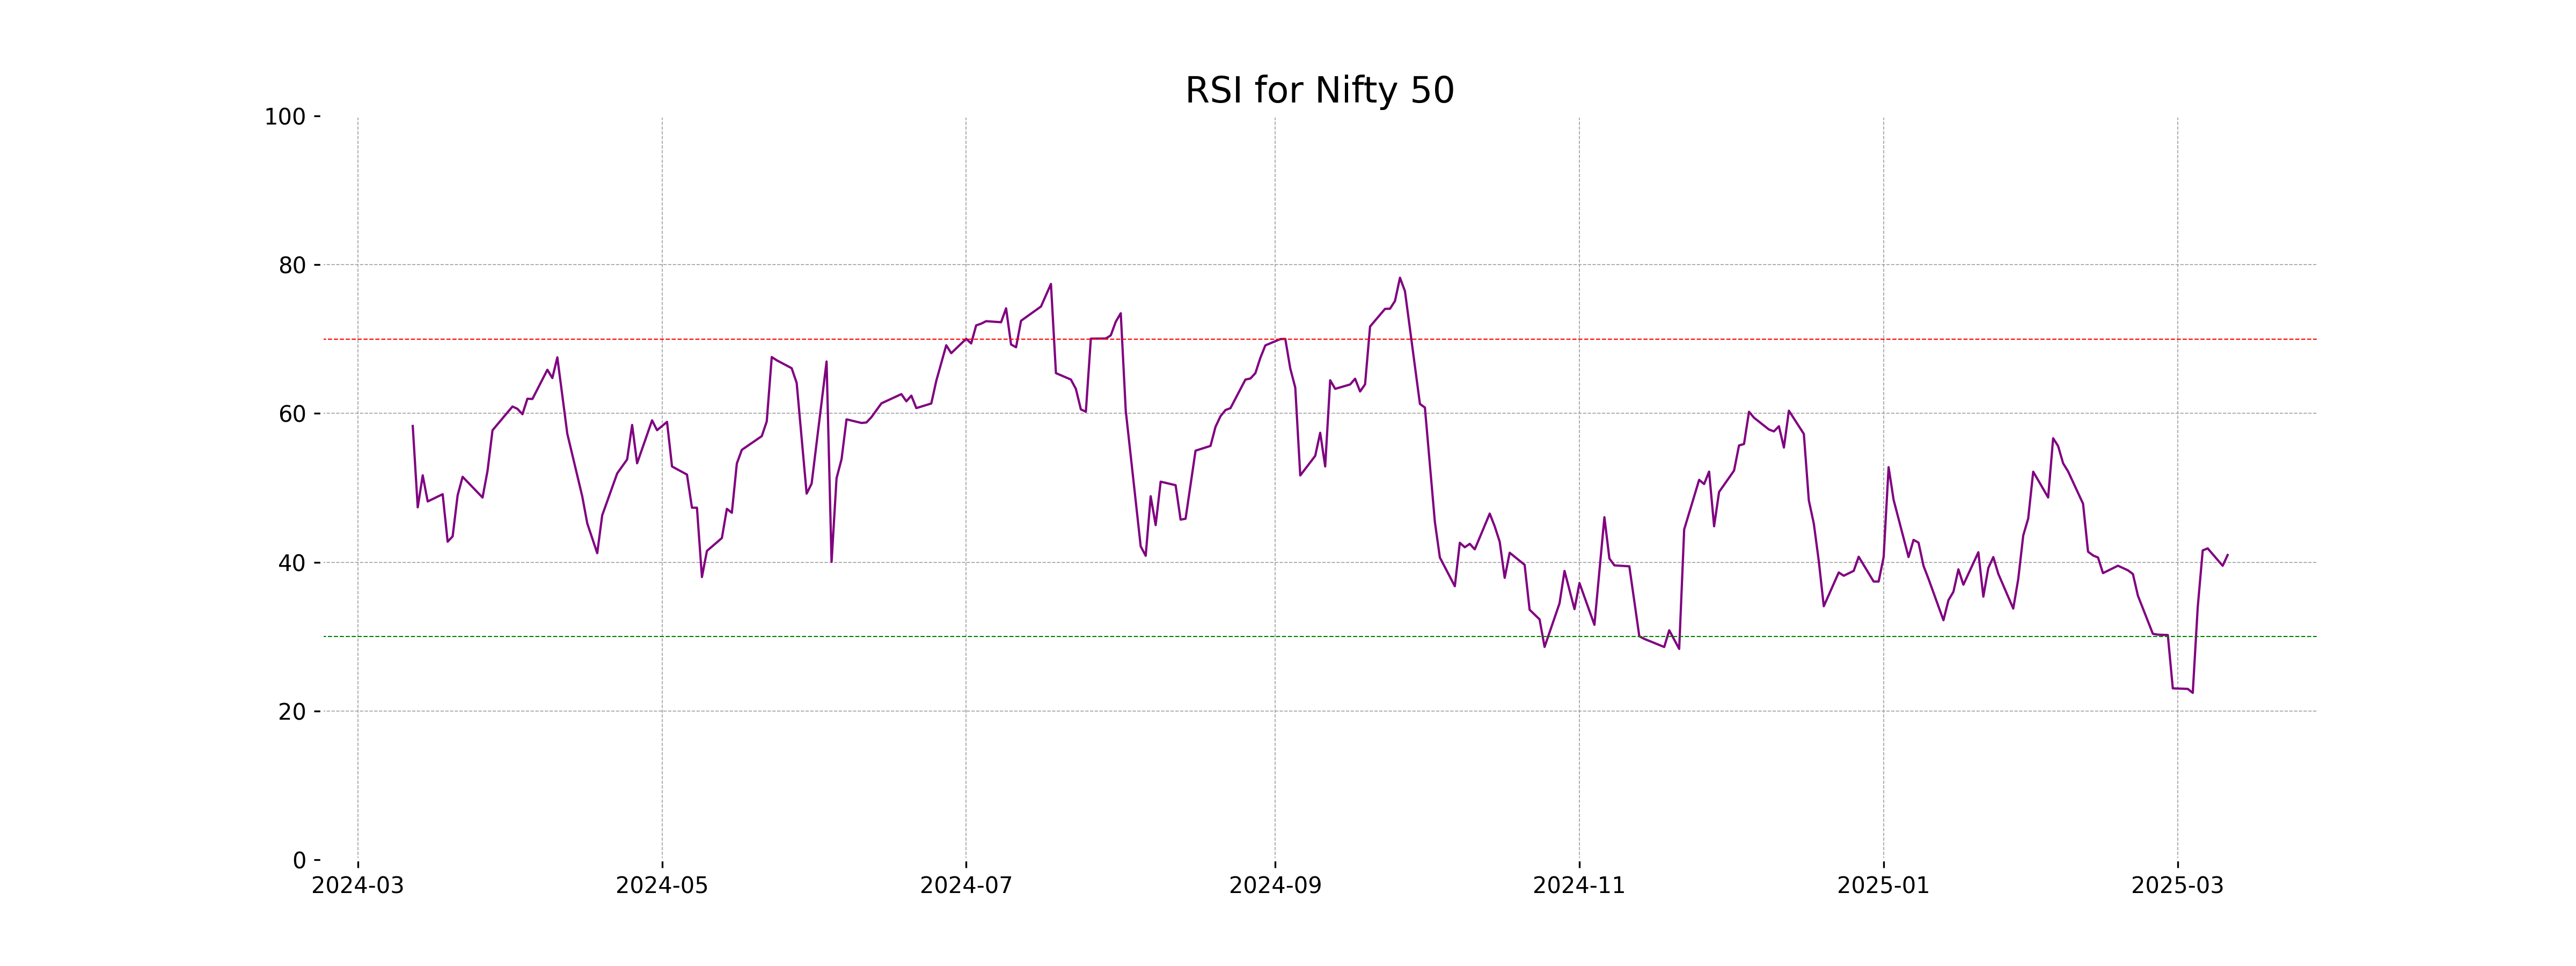
Analysis for Nifty 50 - March 11, 2025

The Nifty 50 opened at 22,345.95 and closed higher at 22,497.90, marking a positive change of 0.17%, equivalent to a gain of 37.60 points. The Relative Strength Index (RSI) is at 40.97, indicating weaker momentum. The Moving Average Convergence Divergence (MACD) shows a negative value of -230.44, suggesting bearish sentiment.

Relationship with Key Moving Averages
The closing price of Nifty 50 at 22497.90 is below its 50-day EMA (23070.12) and 200-day EMA (23443.31), indicating a bearish trend. However, it is slightly above the 10-day EMA (22486.20), which might suggest some short-term bullish momentum.
Moving Averages Trend (MACD)
The MACD for Nifty 50 is negative at -230.44, indicating a bearish momentum as it is significantly below the MACD Signal line, which is at -248.79. This suggests that the recent trend has been downward; however, the slight rise in the percentage change today may suggest some consolidation.

RSI Analysis
The RSI of Nifty 50 is 40.97, which suggests that the index is in a neutral to slightly oversold zone. Typically, an RSI below 30 is considered oversold, so the current value indicates there might be room for further downward movement or consolidation before potential buying interest increases.