Global stock market indices: How the world markets performed today - 12 March 2025
The international stock market indices showed varied performances on March 12, 2025, reflecting the economic sentiment across different regions.
In this article, we analyze the performance of key global indices including the S&P 500, Dow Jones Industrial Average, NASDAQ Composite, FTSE 100, DAX, CAC 40, IBEX 35, Nikkei 225, Hang Seng, Nifty 50, and BSE Sensex.

Analysis for Sensex - March 12, 2025

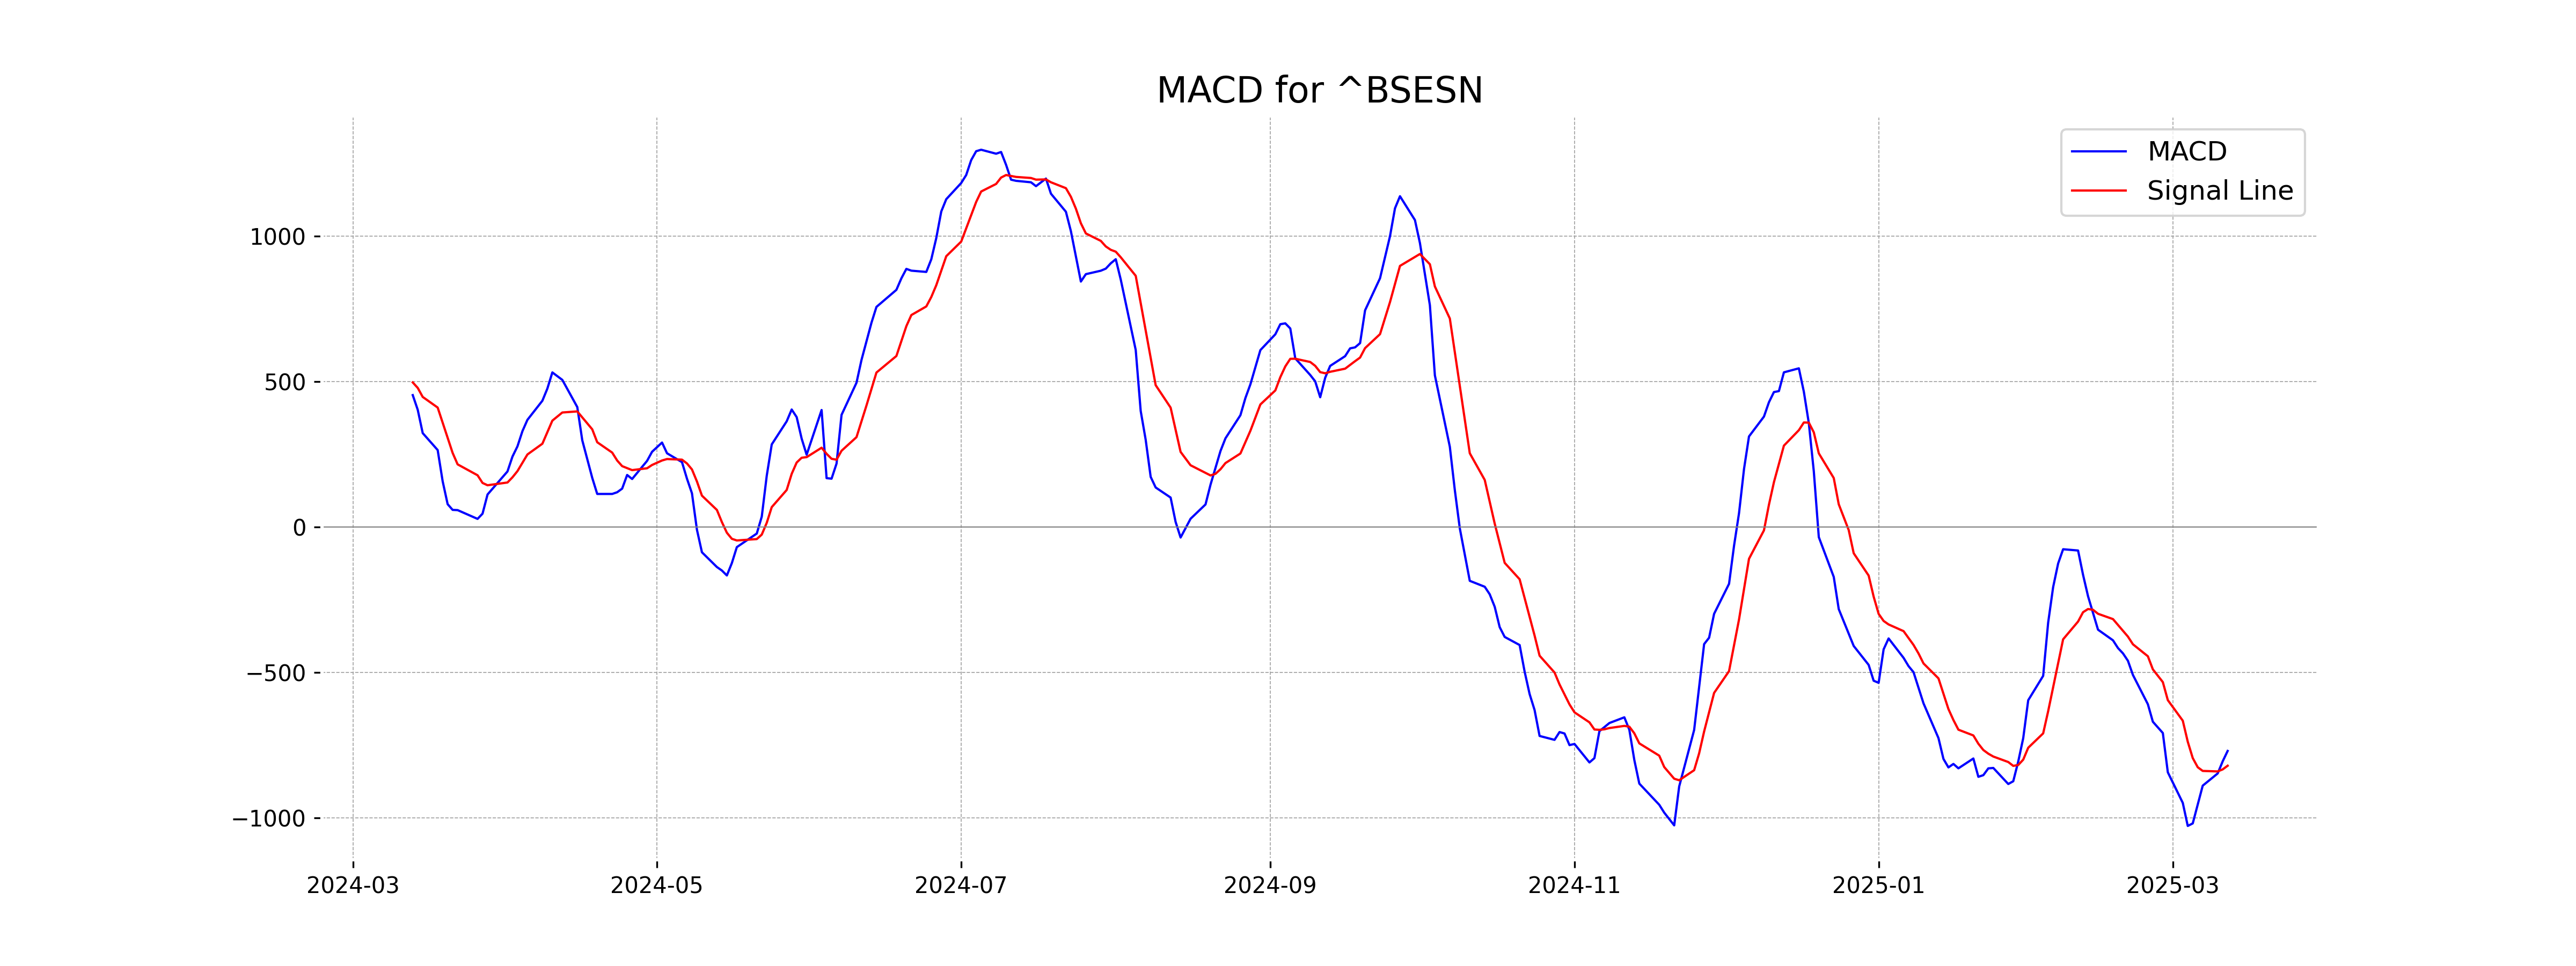
The Sensex opened at 74,270.81 and closed slightly lower at 74,029.76, marking a percentage change of -0.10% with a point drop of 72.56. The Relative Strength Index (RSI) indicates a weaker momentum at 37.76, and the Moving Average Convergence Divergence (MACD) value of -769.40 signifies a bearish trend. Overall, the Sensex traded with low volumes and is positioned below its 50, 10, and 20 EMAs, reflecting short-term downward pressure in the market.

Relationship with Key Moving Averages
Sensex closed at 74029.76, which is below its 50 EMA and 200 EMA, indicating a potential bearish trend. It is also slightly below the 10 EMA but above its previous close. The negative MACD value suggests a weak momentum compared to its MACD Signal.
Moving Averages Trend (MACD)
Sensex MACD Analysis: The current MACD value for Sensex is -769.40, while the MACD Signal is -820.23, indicating a bearish signal as the MACD line is above the signal line. This suggests downward momentum in the market.
RSI Analysis
The Relative Strength Index (RSI) for Sensex stands at 37.76, which is below the typical oversold threshold of 30. This suggests a bearish sentiment but indicates that the stock may be approaching an oversold condition, potentially signaling a buying opportunity if confirmed by other indicators.

Analysis for Dow Jones Industrial Average (US) - March 12, 2025

The Dow Jones Industrial Average (US) closed at 41,433.48, experiencing a decline of 1.14% with a points change of -478.23. The RSI indicates a potentially oversold condition at 30.44, while the MACD shows a bearish trend with a value of -523.69, suggesting a weaker momentum compared to its signal line.

Relationship with Key Moving Averages
The Dow Jones Industrial Average is currently trading below its key moving averages, as indicated by the latest close at 41433.48, which is beneath the 50 EMA at 43500.44, the 200 EMA at 42029.84, the 10 EMA at 42665.98, and the 20 EMA at 43178.92. This suggests potential bearish momentum in the market.
Moving Averages Trend (MACD)
MACD Analysis for Dow Jones Industrial Average (US): The MACD of -523.69 suggests a bearish momentum, indicating potential downward pressure in the market. The MACD line is significantly below the signal line (-288.97), which further reinforces the bearish sentiment.

RSI Analysis
RSI Analysis for Dow Jones Industrial Average (US): The RSI (Relative Strength Index) for the Dow Jones Industrial Average is 30.44, indicating that the index is nearing the oversold territory (typically below 30). This could suggest potential buying opportunities, as it may be undervalued at current levels.

Analysis for CAC 40 (France) - March 12, 2025

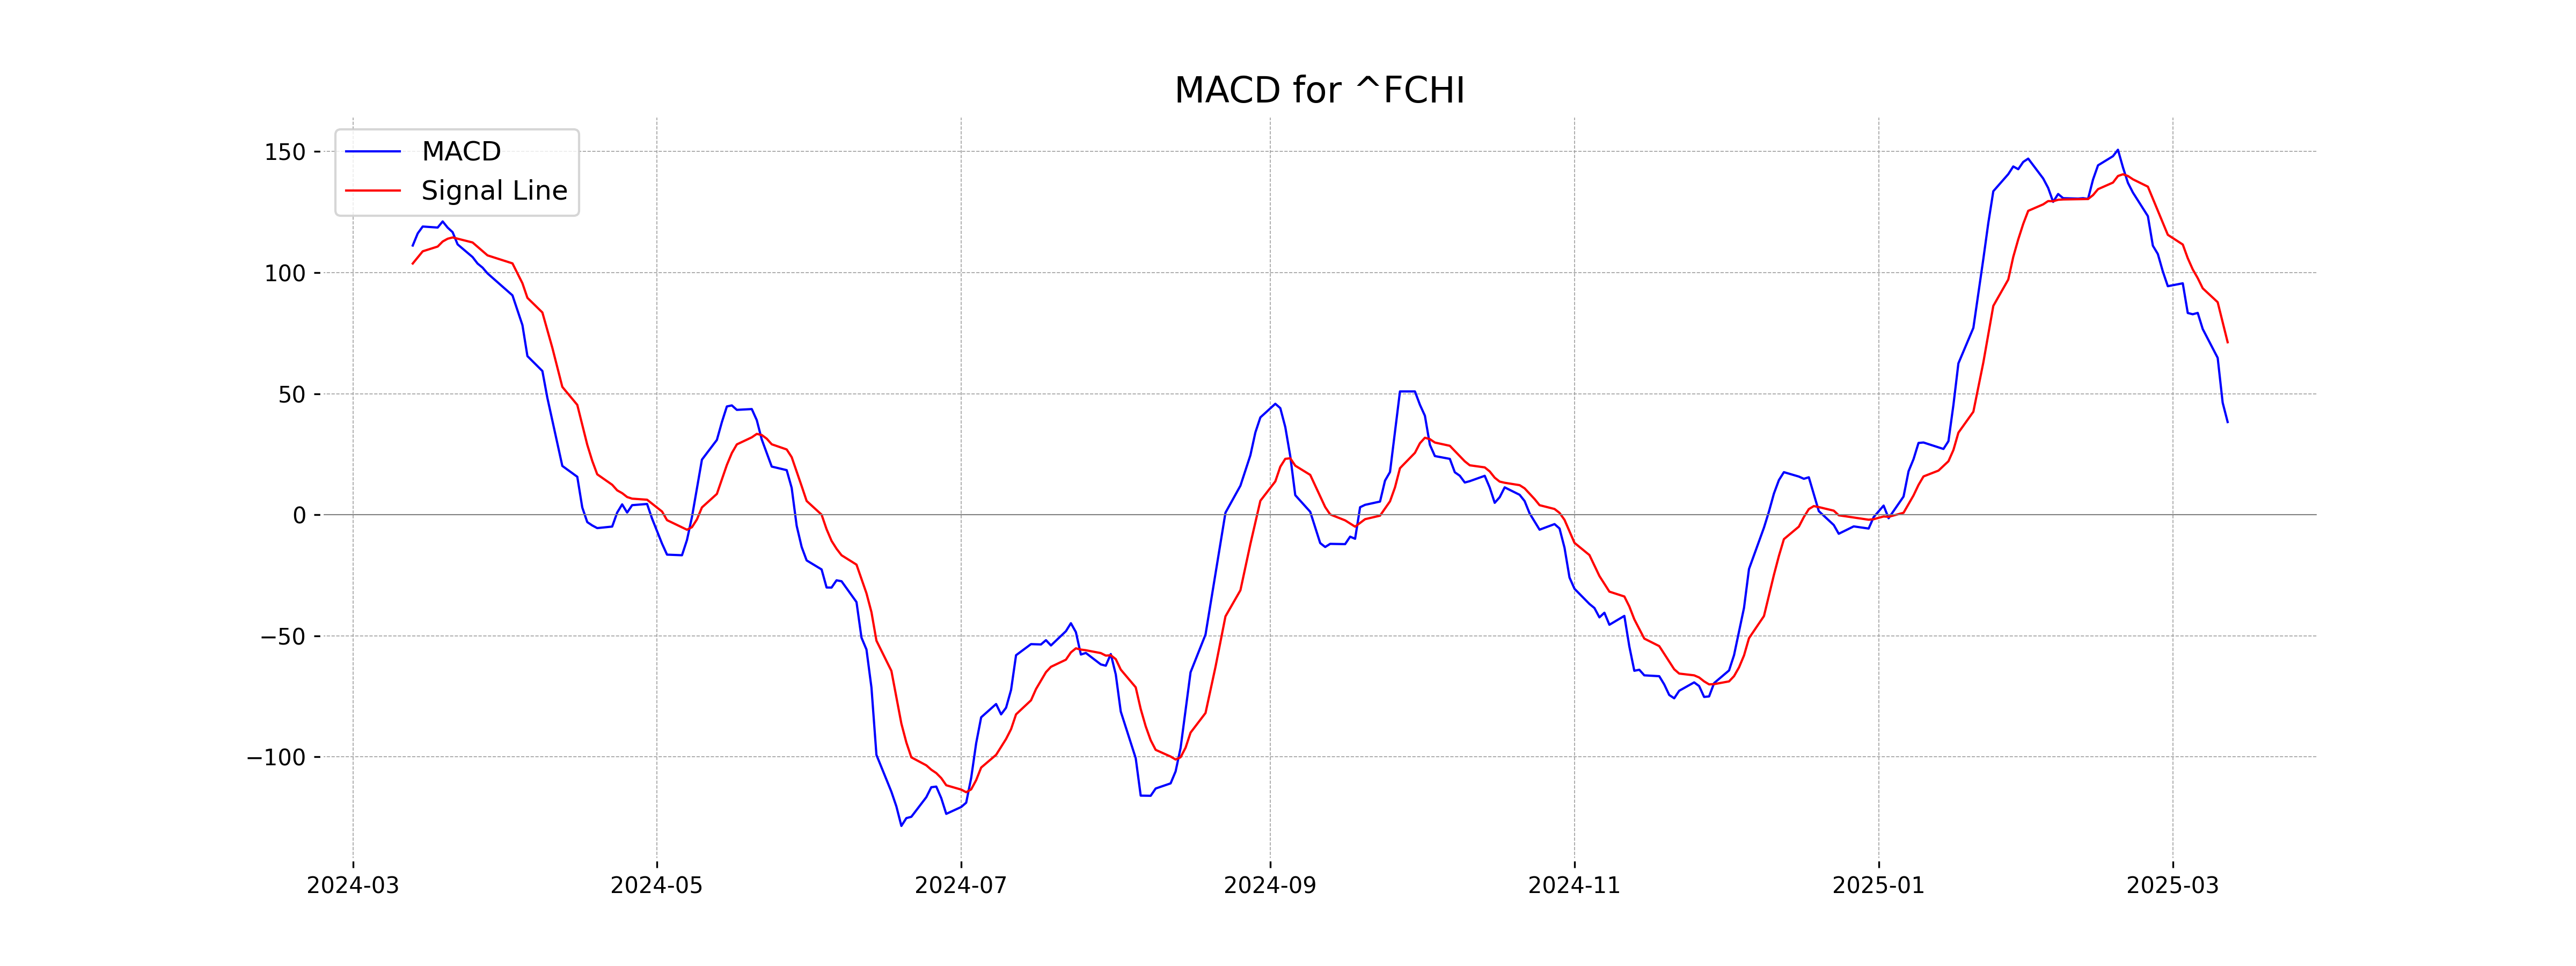
CAC 40 (France) Performance: The CAC 40 index opened at 8006.04 and closed higher at 8030.04, marking a gain of 88.13 points or 1.11% from its previous close of 7941.91. The index experienced an intraday high of 8046.01 and a low of 7994.33. Despite the lack of market volume data, the 50-day and 200-day EMAs indicate an upward trend, with the 50 EMA at 7914.52 and the 200 EMA at 7664.83. The RSI value of approximately 49.69 suggests a neutral market sentiment, while the MACD is below its signal line, indicating potential consolidation or a cautious outlook.

Relationship with Key Moving Averages
The CAC 40 (France) closed at 8030.04, positioned above its 50 EMA of 7914.52 and the 200 EMA of 7664.83 but below its 10 EMA of 8074.91 and 20 EMA of 8066.04. This indicates short-term weakness but potential longer-term strength as it remains above the 50 and 200 EMAs.
Moving Averages Trend (MACD)
The CAC 40 (France) shows a MACD value of 38.30, which is below the MACD Signal line value of 71.25. This indicates a bearish trend, suggesting potential downward momentum in the stock prices.
RSI Analysis
CAC 40 (France) RSI Analysis: The Relative Strength Index (RSI) for CAC 40 is 49.69, which suggests a neutral position. This indicates that the market is neither overbought nor oversold, providing no strong directional cues at this moment.

Analysis for FTSE 100 (UK) - March 12, 2025

FTSE 100 (UK) opened at 8495.99, reaching a high of 8551.52 and closing at 8533.84, marking a 0.45% increase with a 37.84 point change from the previous close. The RSI is at 40.14, indicating the index is in the lower range of strength, while the MACD is negative at -0.98, with the signal line at 37.05 suggesting bearish momentum. The volumes were reported at zero and the 50-day EMA stands below the 20-day EMA, hinting at potential underperformance.

Relationship with Key Moving Averages
FTSE 100's closing price of 8533.84 is below its 10 EMA of 8643.99 and 20 EMA of 8665.22, indicating potential bearish momentum. However, it remains above the 200 EMA of 8314.06, suggesting long-term bullishness despite short-term pressure.
Moving Averages Trend (MACD)
The MACD value for FTSE 100 is -0.98, which is below the MACD Signal line at 37.05. This suggests a bearish trend as the MACD line is positioned below the signal line, indicating potential downward momentum.

RSI Analysis
The FTSE 100's RSI is at 40.14, suggesting the index is approaching oversold territory. A reading below 30 typically indicates oversold conditions, where the asset might be undervalued. Current levels may hint at potential buying opportunities if downward momentum continues.

Analysis for DAX (Germany) - March 12, 2025

DAX (Germany) opened at 22,525.74 and closed at 22,664.51, marking a 1.50% increase with a points change of 335.74. The index showed a slight upward momentum with a 50-day EMA of 21,834.26 and an RSI of 53.83, indicating neutral market conditions.

Relationship with Key Moving Averages
The closing price of DAX (Germany) at 22,664.51 is slightly below the 10-day EMA of 22,696.96, indicating a short-term bearish sentiment. However, it's above both the 50-day EMA of 21,834.26 and the 200-day EMA of 19,926.01, suggesting a longer-term bullish trend. The RSI is at 53.83, reflecting a neutral momentum.
Moving Averages Trend (MACD)
DAX (Germany) MACD Analysis: The MACD value of 282.83 is below the MACD Signal line of 359.48, suggesting a bearish trend or potential downward momentum. Traders might look for further confirmation before making decisions, given the current MACD analysis.

RSI Analysis
The RSI value for DAX (Germany) is 53.83, which indicates a neutral position since it is close to the midpoint of the 0-100 scale. This suggests that the index is neither overbought nor oversold, which may imply balanced market conditions without strong bullish or bearish momentum.

Analysis for S&P 500 (US) - March 12, 2025

The S&P 500 (US) experienced a decline, closing at 5572.07 with a daily points change of -42.49 and a percentage change of -0.76%. It opened at 5603.65, reaching a high of 5636.30 and a low of 5528.41. The relative strength index (RSI) is at 28.35, indicating potential oversold conditions, while the MACD is negative at -96.62, suggesting bearish momentum.

Relationship with Key Moving Averages
The S&P 500 (US) closed at 5572.07, positioned below its 50-day EMA (5934.31) and 200-day EMA (5709.69), indicating a bearish trend alignment. Additionally, the close is also under the 10-day EMA (5772.64) and 20-day EMA (5866.32), reinforcing short-term downward momentum.
Moving Averages Trend (MACD)
MACD Analysis for S&P 500 (US): The MACD for the S&P 500 is at -96.62, while the MACD Signal is at -53.60. The negative values and the MACD being below the signal line indicate a bearish sentiment, suggesting downward momentum in the market.

RSI Analysis
The Relative Strength Index (RSI) for S&P 500 is 28.35, indicating that the market is currently in oversold territory. This suggests that the index may be experiencing a downward trend, and potential buying opportunities could arise if investor sentiment shifts.

Analysis for Hang Seng Index (Hong Kong) - March 12, 2025

Hang Seng Index (Hong Kong) Performance: On the given day, the Hang Seng Index opened at 23,859.23, reached a high of 23,962.03, and recorded a low of 23,363.98, closing at 23,600.31. The index experienced a decline of 0.76%, reflecting a decrease of 181.83 points from the previous close of 23,782.14. Notably, the index's RSI is 60.50, suggesting a moderately strong momentum, with a MACD value below its signal line, indicating a bearish sentiment.

Relationship with Key Moving Averages
The Hang Seng Index closed at 23,600.31, which is above its 10-day EMA of 23,592.15, 20-day EMA of 23,092.91, 50-day EMA of 21,901.01, and 200-day EMA of 19,890.70. This suggests a strong upward trend compared to medium to long-term averages.
Moving Averages Trend (MACD)
MACD Analysis for Hang Seng Index (Hong Kong): The MACD value of 714.26 is below the MACD Signal value of 770.89, indicating a bearish momentum. This suggests potential short-term downward pressure on the index.

RSI Analysis
The RSI for Hang Seng Index is 60.50, indicating a moderately strong momentum, but not yet overbought. An RSI above 70 would typically suggest overbought conditions, while below 30 suggests oversold. At this level, the index might still have room for more movement before reaching typical overbought levels.

Analysis for IBEX 35 (Spain) - March 12, 2025

The IBEX 35 index opened at 12,944.30 and closed at 12,809.80, marking a decrease of 0.52% with a points change of -67.5. The index is below its 10-day and 20-day EMAs but above the 50-day and 200-day EMAs, with an RSI of 46.50 indicating neutral momentum.

Relationship with Key Moving Averages
The closing price of IBEX 35 is 12809.80, which is above its 50 EMA of 12631.22 and its 200 EMA of 11764.47, indicating a longer-term uptrend. However, it is below the 10 EMA of 13057.61 and the 20 EMA of 12995.64, suggesting short-term bearish momentum.
Moving Averages Trend (MACD)
The IBEX 35 (Spain) has a MACD value of approximately 138.24, which is below its MACD signal line of approximately 215.78. This suggests a bearish trend, indicating that the momentum may be declining and a potential sell signal could be present.

RSI Analysis
The RSI for IBEX 35 is currently at 46.50, indicating a neutral position. It suggests that the index is neither overbought nor oversold, hinting at a potential consolidation phase or a possible reversal in trend direction.

Analysis for NASDAQ Composite (US) - March 12, 2025

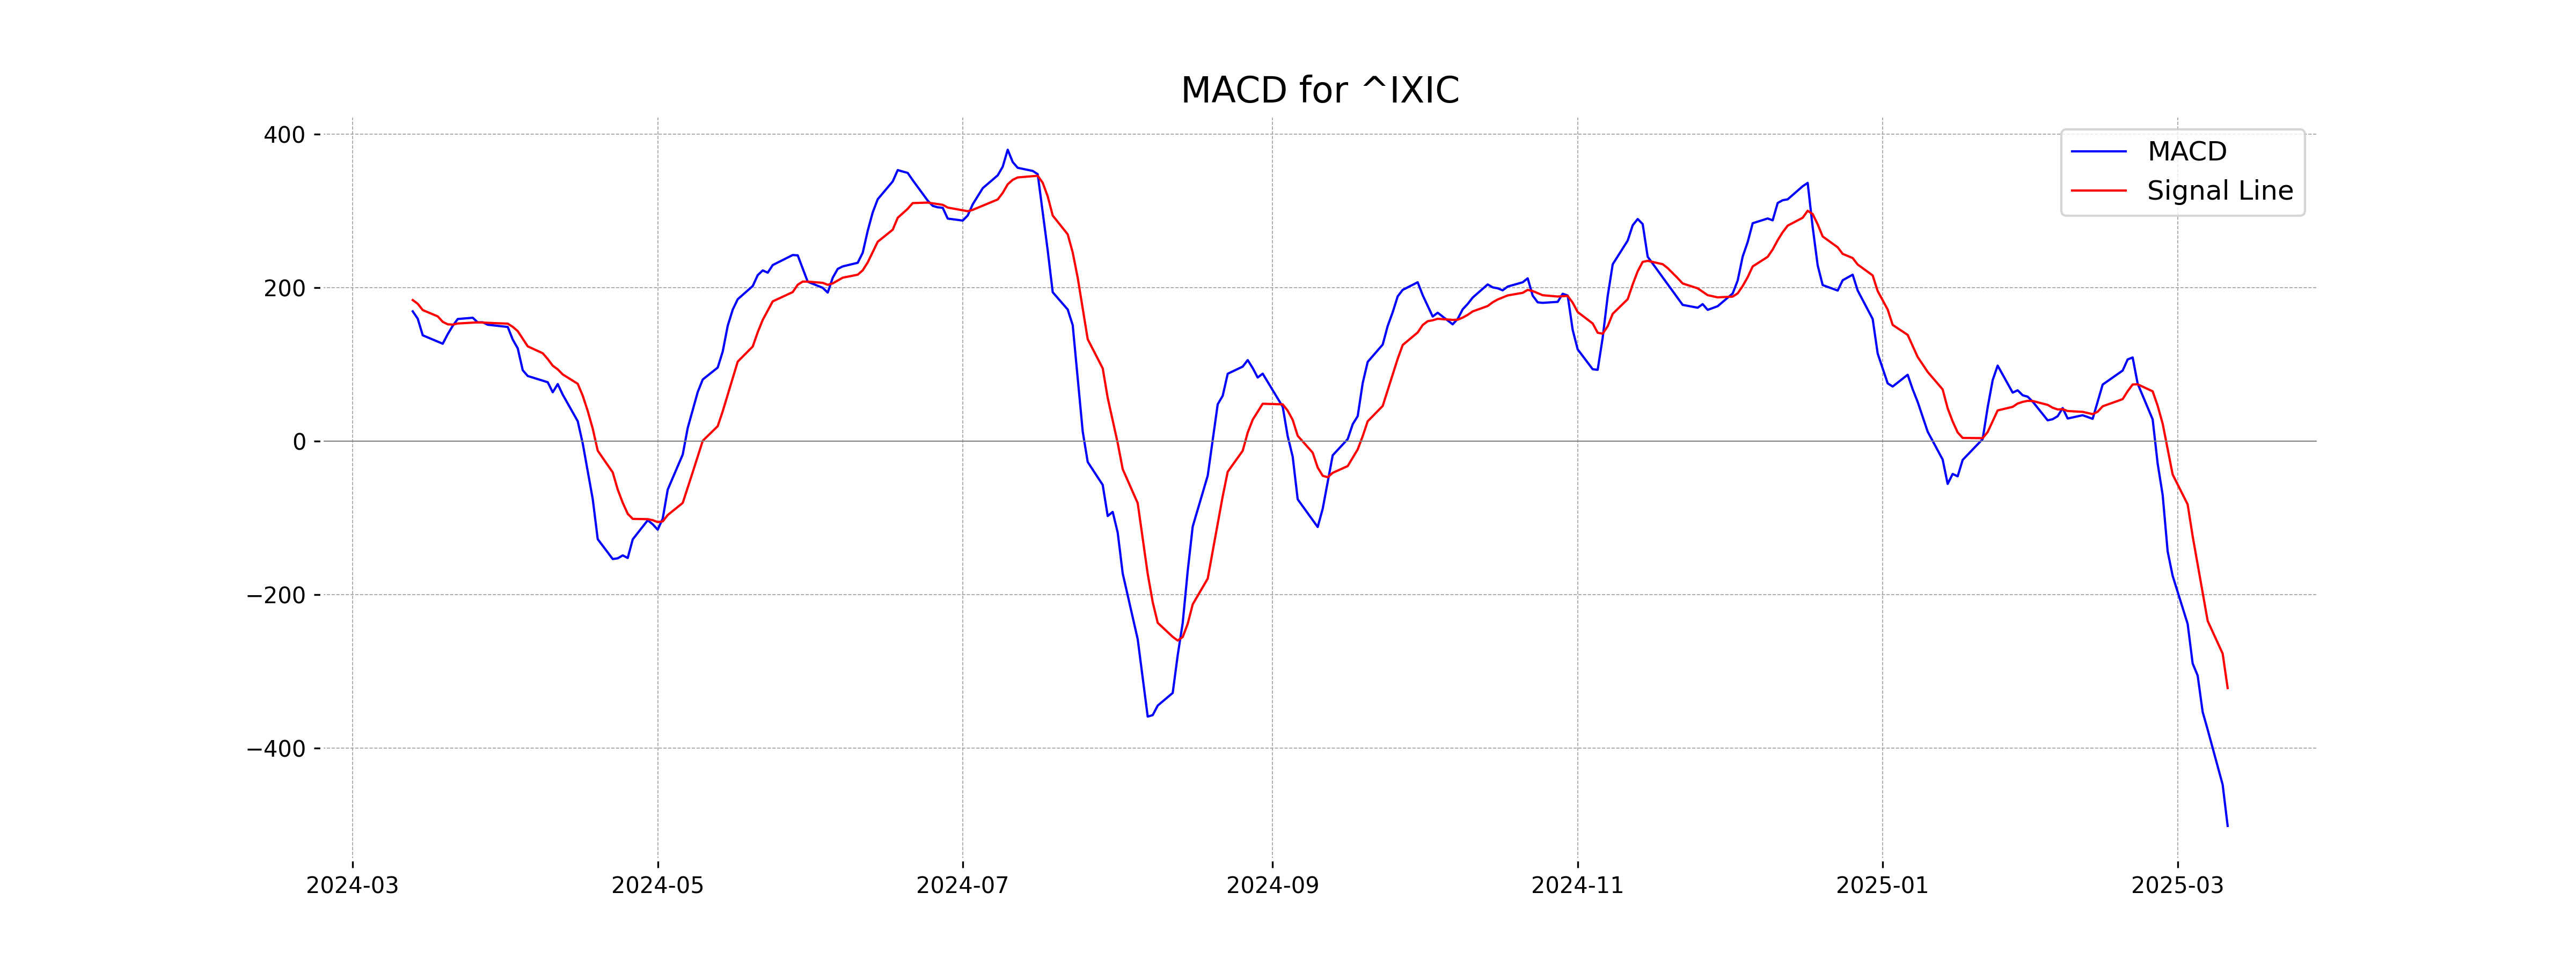
NASDAQ Composite (US) Performance: The NASDAQ Composite opened at 17,443.09 and closed slightly lower at 17,436.10, marking a small decline with a points change of -32.22. The RSI is at a low 27.49, indicating potential oversold conditions, while the MACD remains negative, suggesting a bearish trend.

Relationship with Key Moving Averages
The NASDAQ Composite closed below all its key moving averages, with a close of 17,436.10, indicating bearish momentum. The 10-day EMA is at 18,236.00, the 20-day EMA is at 18,700.67, the 50-day EMA is at 19,111.22, and the 200-day EMA is at 18,307.32. Additionally, a low RSI of 27.49 further supports a heavily oversold condition.
Moving Averages Trend (MACD)
The MACD value for the NASDAQ Composite is currently at -501.19, which is below the MACD Signal line of -321.59. This suggests a bearish trend, indicating potential continued downside momentum in the short term.
RSI Analysis
NASDAQ Composite RSI Analysis: The RSI (Relative Strength Index) for NASDAQ Composite is 27.49, which indicates that the index is in the oversold territory. This suggests that the market might be experiencing a period of downward pressure, and a potential rebound could occur if buying interest increases.

Analysis for Nikkei 225 (Japan) - March 12, 2025

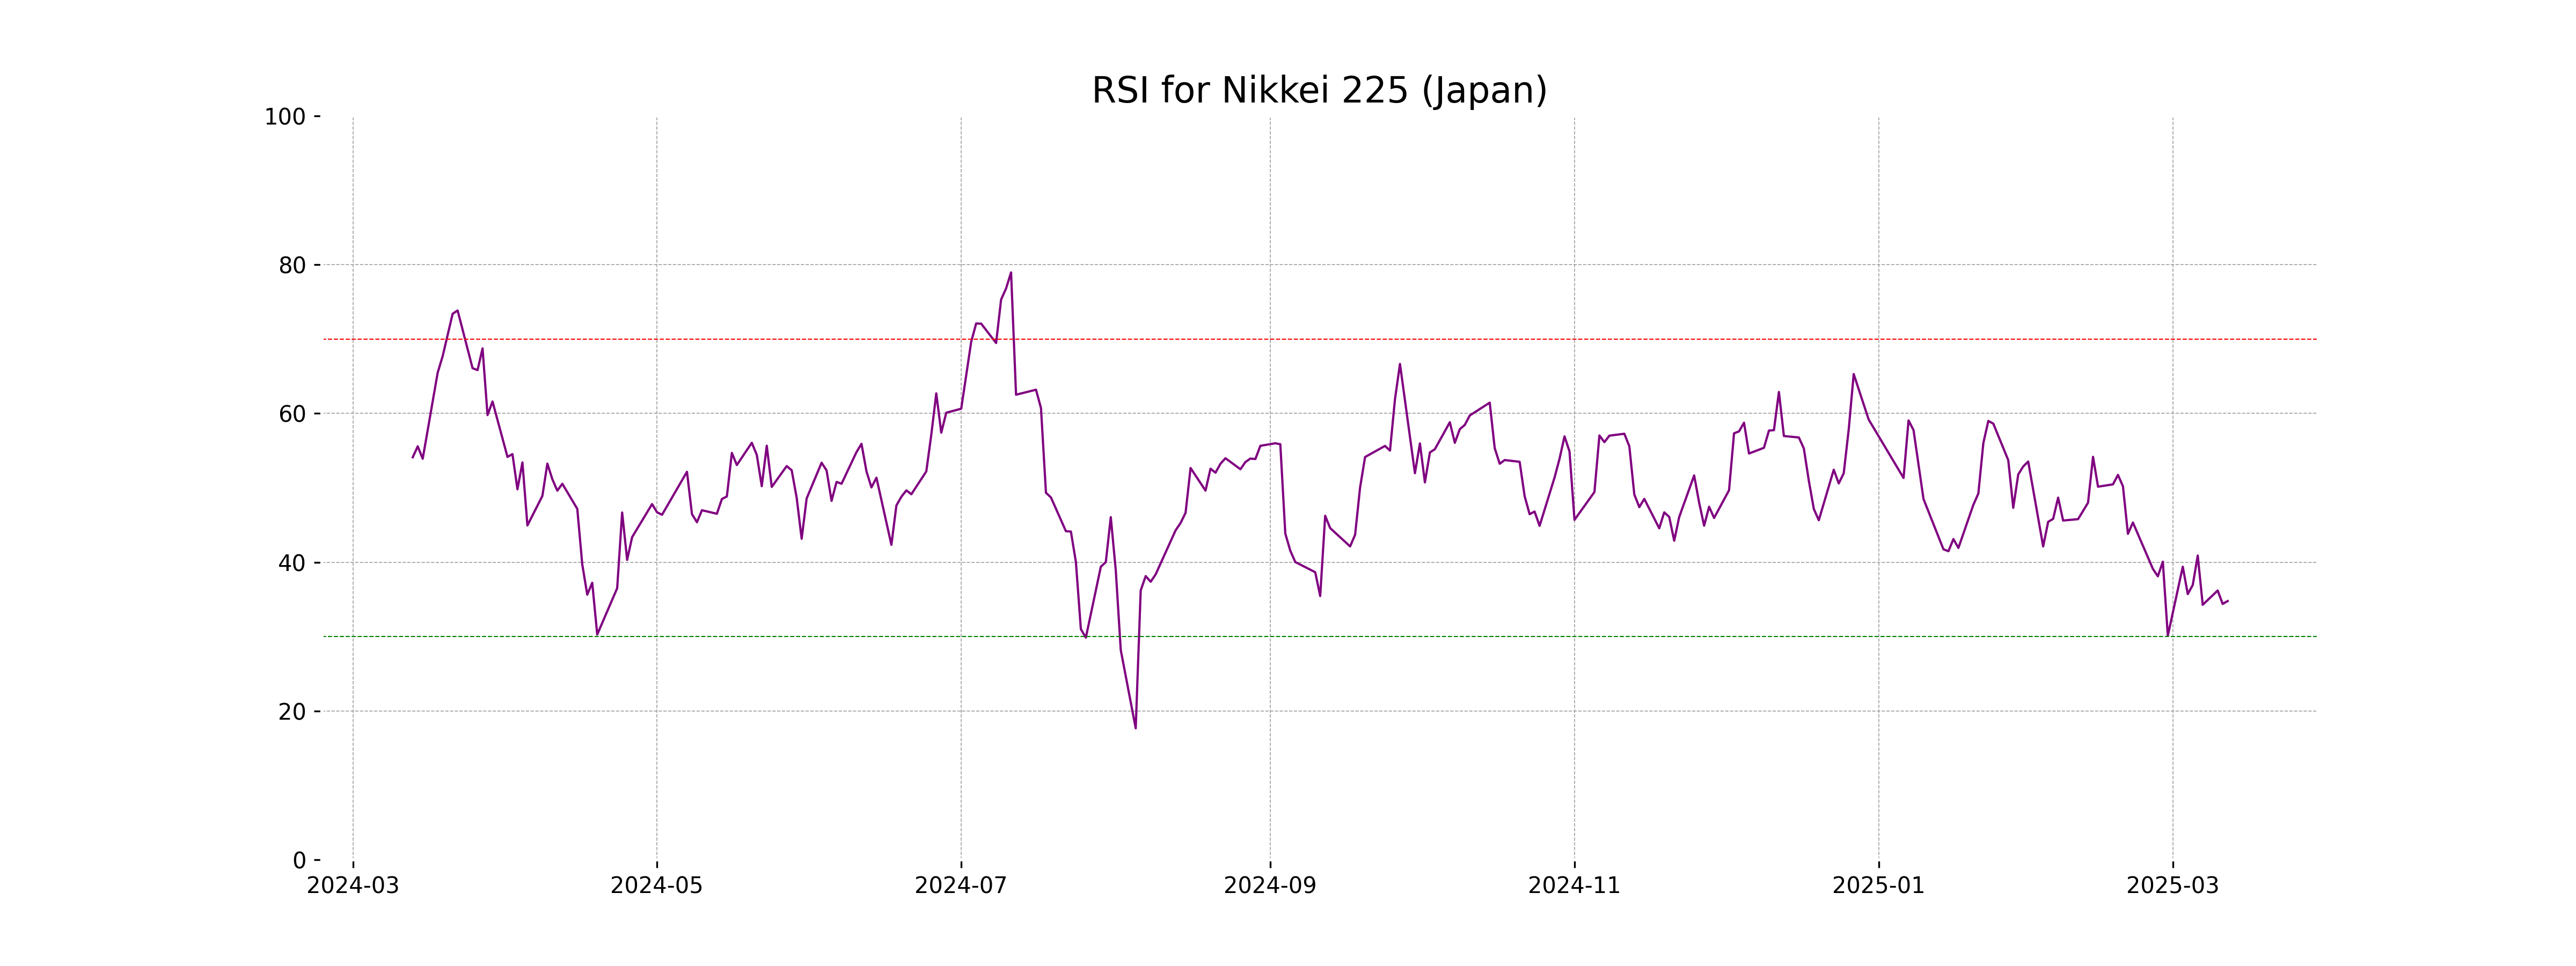
The Nikkei 225 (Japan) opened at 36,763.10 and closed slightly higher at 36,819.09, marking a small increase with a points change of 25.98 and a percentage change of 0.07%. The RSI stands at 34.78, indicating potential bearish conditions, while the MACD shows a bearish signal with a value of -575.11 compared to the signal line at -444.79.

Relationship with Key Moving Averages
Nikkei 225 is trading below key moving averages with the latest closing price of 36,819.09 being under the 10 EMA at 37,343.38, the 20 EMA at 37,840.30, the 50 EMA at 38,436.98, and the 200 EMA at 38,227.18. This indicates a potential bearish trend.
Moving Averages Trend (MACD)
Nikkei 225 MACD Analysis: The MACD value of -575.11, which is below the signal line at -444.79, indicates a bearish trend for the Nikkei 225. This suggests downward momentum, as the MACD is negative and below its signal line.

RSI Analysis
The RSI value of 34.78 for Nikkei 225 indicates that the index is approaching the oversold territory, suggesting potential for a price reversal or a buying opportunity if the trend continues. Typically, an RSI below 30 is considered oversold, so it's important to monitor this condition closely.
Analysis for Nifty Bank - March 12, 2025

Nifty Bank opened at 47,894.40 and closed at 48,056.65, with a daily high of 48,222.15 and a low of 47,844.95, marking a 0.42% increase. The index has a RSI of 38.94, indicating a possible oversold condition, and a negative MACD of -378.26, suggesting bearish momentum.

Relationship with Key Moving Averages
The closing price of Nifty Bank at 48056.65 is below its 10 EMA (48349.62), 20 EMA (48646.24), 50 EMA (49331.37), and 200 EMA (49938.41) indicating a bearish position in relation to these key moving averages. Additionally, the RSI of 38.94 suggests it may be approaching oversold conditions.
Moving Averages Trend (MACD)
MACD Analysis for Nifty Bank: The MACD value of -378.261 indicates a bearish momentum as it is below the MACD Signal line of -331.017, suggesting a potential downtrend in the short-term. With the RSI at 38.94, it nears the oversold territory, indicating potential buyer interest soon.

RSI Analysis
The RSI for Nifty Bank is 38.94, indicating that the index is currently in the oversold territory. Typically, an RSI below 30 suggests oversold conditions, while above 70 indicates overbought. A value of 38.94 suggests Nifty Bank is nearing the oversold zone, which might signal a potential buying opportunity if the downtrend continues.

Analysis for Nifty 50 - March 12, 2025

Nifty 50 opened at 22,536.35, reaching a high of 22,577.40 and a low of 22,329.55, before closing at 22,470.50. The index experienced a slight decline, with a decrease of 27.40 points from the previous close. The RSI indicates a bearish sentiment at 40.21, while MACD shows a negative trend with a value of -216.94 against its signal line.

Relationship with Key Moving Averages
The current close of Nifty 50 is 22470.5, which is below its 50-day EMA of 23046.60 and 200-day EMA of 23433.71, indicating a bearish trend in the medium to long term. Additionally, it is slightly below the 10-day EMA of 22483.34 and the 20-day EMA of 22632.18, suggesting short-term weakness.
Moving Averages Trend (MACD)
MACD Analysis for Nifty 50: The MACD value is -216.9363, while the MACD Signal is -242.4178, indicating a bullish crossover is developing as the MACD line is above the MACD Signal line. This suggests potential positive momentum, but further confirmation with increasing price action is needed due to the overall declining trend signaled by the negative values.

RSI Analysis
The RSI for Nifty 50 is currently 40.21, indicating a weak momentum as it's below the neutral mark of 50. This suggests that the index is hovering near the oversold territory, potentially signaling a buying opportunity if the RSI continues to decrease towards 30.
