Indian stock market sector-wise performance today - March 12, 2025
The stock market witnessed varied performances across different sectors and indices on Wednesday (March 12, 2025). Let us delve into the specifics and understand the movements of key sectors.
The BSE Sensex observed a slight decline, closing at 74029.76, with a marginal decrease of 0.0979 percent. The overall sentiment seemed cautious, with investors likely assessing multiple factors influencing the market.
Among the sectors, Nifty Auto experienced a positive day, increasing by 0.4886 percent. This uptrend indicates that investors might be seeing potential in the automotive sector, possibly fueled by anticipated demand recovery or favorable policy expectations.
Nifty Energy also showed a modest rise of 0.2309 percent. The slight positive movement suggests that the energy sector could have been buoyed by stable commodity prices or hopes for robust long-term energy demand.
Conversely, Nifty IT emerged as the most affected sector with a significant decline of 2.9129 percent. This notable drop suggests a possible reaction to global tech sector cues, currency fluctuations, or profit booking by investors after recent rallies.
The sharp decline in the Nifty IT index likely had a broad impact on market sentiment, as technology stocks generally hold substantial weight in portfolios.
Nifty FMCG showed almost no change, with a negligible increase of 0.0112 percent, indicating a stable yet cautious outlook from investors. Consumer goods tend to be considered defensive stocks, suggesting investors' risk-averse stance.
Nifty Infrastructure saw a minor decline of 0.0826 percent. This sector has been fluctuating as it often depends on government policies, infrastructure development announcements, and budget allocations.
Nifty Metal experienced a reduction of 0.4833 percent. The decline might be attributed to fluctuations in global metal prices, impacting investor sentiment towards metal stocks.
Moreover, the banking sector, represented by Nifty Bank, saw a promising increase of 0.4236 percent. This rise could indicate confidence in the financial sector's stability and growth potential, possibly underpinned by favorable banking policies or improving economic indicators.
The Nifty 50 index, a broad representation of the market, noted a slight decrease of 0.1218 percent, reflecting a mixed market sentiment as investors navigated through varying sector performances.
In summary, the trading day was marked by mixed results across sectors. The sharp decline in the Nifty IT index was a standout movement, likely impacting the broader market due to its high influence and investor interest.
External factors such as technological trends, currency dynamics, and international market cues might have played a crucial role in shaping the sector's performance on this day.

Analysis for Sensex - March 12, 2025

Sensex Performance: The Sensex opened at 74,270.81 and closed slightly lower at 74,029.76, marking a decrease of 0.10% or a drop of 72.56 points. With a Relative Strength Index (RSI) of 37.75, it indicates that the index is approaching oversold territory. The MACD is -769.40, suggesting a bearish trend.

Relationship with Key Moving Averages
The Sensex closed at 74,029.76, which is below its 50-day EMA of 76,112.69 and 200-day EMA of 77,258.22, indicating a potential downtrend. It is, however, close to the 10-day EMA of 74,182.40, suggesting a possible support level in the short term.
Moving Averages Trend (MACD)
The current MACD for Sensex is -769.40, with a MACD Signal of -820.23. The negative MACD value and the fact that it is above the MACD Signal suggest a potential continuation of bearish momentum, but the close proximity indicates possible convergence. With an RSI of 37.76, the market may be nearing oversold conditions.

RSI Analysis
The Relative Strength Index (RSI) for Sensex is currently at 37.76, indicating that the index is approaching the oversold territory. Generally, an RSI below 30 suggests that the asset may be undervalued, so if the RSI continues to decline, it could signal a buying opportunity.

Analysis for Nifty Auto - March 12, 2025

Nifty Auto Performance: Nifty Auto opened at 20713.55 and closed higher at 20783.70, indicating a positive movement with a % change of 0.49%. The Relative Strength Index (RSI) suggests a relatively weak momentum at 37.29, while the MACD value of -504.66 indicates a bearish trend, slightly below its signal line.

Relationship with Key Moving Averages
The close price of Nifty Auto is 20,783.70, which is below the 50 EMA of 22,092.54 and the 200 EMA of 22,903.82, indicating a bearish trend based on these averages. However, it is slightly above the 10 EMA of 20,926.78 and well below the 20 EMA of 21,311.21, suggesting a potential short-term recovery but overall weakness.
Moving Averages Trend (MACD)
The MACD for Nifty Auto currently stands at -504.66, with a signal line at -494.13 indicating a bearish trend as the MACD is below the signal line. This suggests that the index could potentially continue to experience downward momentum unless a positive crossover occurs.

RSI Analysis
The Relative Strength Index (RSI) for Nifty Auto is at 37.29, which is below the neutral mark of 50. This suggests that the index is in the lower range and approaching oversold territory, indicating potential buying opportunities if other indicators align.

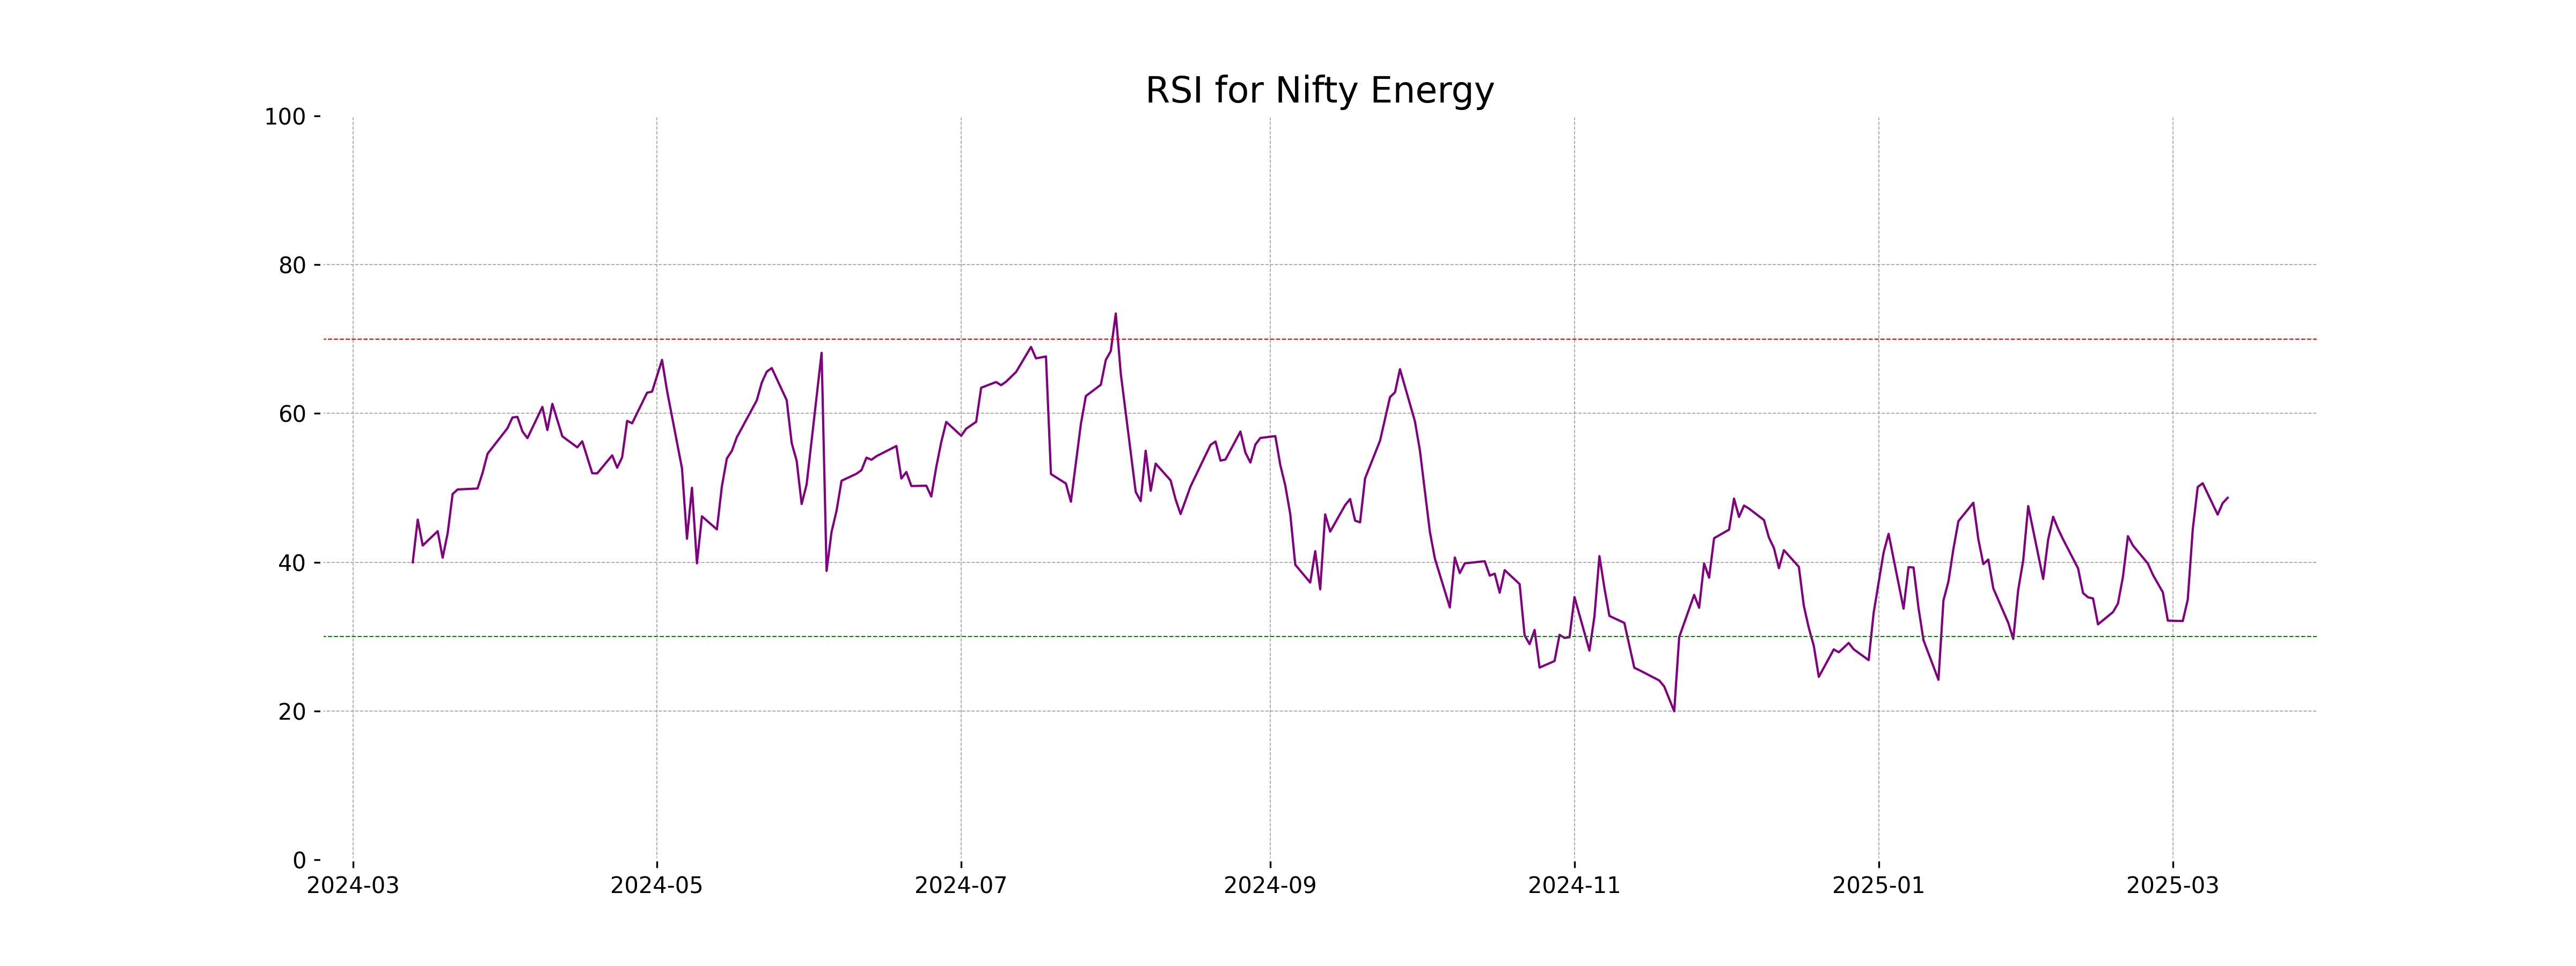
Analysis for Nifty Energy - March 12, 2025

Nifty Energy Performance: The Nifty Energy index opened at 31,638.10 and closed at 31,535.30, observing a slight increase of 0.23% with a points change of 72.65. The RSI stands at 48.66, indicating a neutral momentum. The current price is below the 50 and 200 EMA, suggesting a possible downtrend, although it is above the 10 and 20 EMA, which could imply short-term strength.

Relationship with Key Moving Averages
Nifty Energy closed at 31,535.30, which is below both the 50-day EMA at 32,704.23 and the 200-day EMA at 36,225.71, indicating a bearish trend in the short to medium term. However, it is above the 10-day EMA at 31,269.44 and slightly above the 20-day EMA at 31,415.83, suggesting some recent short-term upward momentum.
Moving Averages Trend (MACD)
MACD Analysis for Nifty Energy: The MACD for Nifty Energy is -362.10, which is above the MACD Signal line at -570.60. This suggests a potential bullish crossover. However, since both values are negative, it indicates that the trend is still weak or bearish overall.

RSI Analysis
The RSI (Relative Strength Index) for Nifty Energy is 48.66. This indicates a neutral position, as it is close to the midpoint of 50, suggesting that the market is not currently in an overbought or oversold condition. A value closer to 30 would indicate potential overselling, whereas a value near 70 would suggest overbuying.
Analysis for Nifty FMCG - March 12, 2025

Nifty FMCG opened at 51973.90 and closed at 51957.25, with a minimal percent change of 0.01%, indicating slight stability in its performance. The Relative Strength Index (RSI) is at 39.69, suggesting the index is in the lower range and possibly undervalued. The MACD indicates a bearish trend with a value of -835.98, which is below the MACD Signal of -1002.72.

Relationship with Key Moving Averages
Relationship with Key Moving Averages for Nifty FMCG: The Nifty FMCG index is currently trading below its key moving averages, specifically the 10 EMA at 51858.09, the 20 EMA at 52398.34, the 50 EMA at 54041.23, and the 200 EMA at 56645.81. This indicates a bearish trend suggesting the index might face resistance at these levels if it attempts to rise.
Moving Averages Trend (MACD)
MACD Analysis for Nifty FMCG: The Nifty FMCG's MACD value of -835.98, with a signal line at -1002.72, indicates a bearish trend as the MACD is above the signal line. However, the negative values suggest ongoing downward momentum.

RSI Analysis
RSI for Nifty FMCG is 39.69, indicating that the index is close to the oversold territory, which is generally considered below 30. This suggests that the index might be due for a potential upward correction or could continue to maintain downward pressure if selling persists.

Analysis for Nifty Infra - March 12, 2025

Nifty Infra opened at 8042.95 and closed at 7983.0. The index experienced a slight decrease of 0.08%, with a points change of -6.60. Key technical indicators show that the 10 EMA is at 7926.57, while the RSI stands at 49.22, suggesting a neutral momentum.

Relationship with Key Moving Averages
The Nifty Infra index's close value at 7983.0 remains below its 50 EMA of 8137.87 and 200 EMA of 8417.27, indicating a bearish sentiment. However, it is slightly above the 10 EMA of 7926.58 and close to the 20 EMA of 7956.16, suggesting some short-term support.
Moving Averages Trend (MACD)
Based on the MACD analysis for Nifty Infra, the MACD line is currently at -62.98 and the MACD Signal line is at -95.53. Since the MACD line is above the Signal line, it may suggest a bullish divergence; however, both being negative indicates that the overall trend may still be bearish.

RSI Analysis
RSI Analysis for Nifty Infra: The Relative Strength Index (RSI) for Nifty Infra is 49.22, which suggests that the stock is currently in the neutral zone. This indicates neither overbought nor oversold conditions, suggesting possible market equilibrium without immediate pressure for big movements up or down.

Analysis for Nifty IT - March 12, 2025

Nifty IT opened at 37181.85 and closed at 36310.65, reflecting a decrease of -2.91% with a points change of -1089.45 from the previous close of 37400.10. The RSI is at 23.35, suggesting oversold conditions, while the MACD indicates negative momentum with a value of -1364.78 compared to the signal line at -1214.61.

Relationship with Key Moving Averages
The Nifty IT closed below its 50 EMA, 200 EMA, 10 EMA, and 20 EMA. This indicates a bearish trend, as the current price of 36,310.65 is significantly lower than all its key moving averages, suggesting downward momentum.
Moving Averages Trend (MACD)
MACD Analysis for Nifty IT: The MACD line at -1364.78 is below the MACD Signal line at -1214.61, indicating a bearish trend. This negative divergence suggests potential continued downwards momentum for Nifty IT.

RSI Analysis
RSI analysis for Nifty IT indicates that with an RSI value of 23.35, the index is in the oversold territory. This suggests that there may be potential for a price reversal or a temporary bounce as it might be considered undervalued at current levels.

Analysis for Nifty Metal - March 12, 2025

Nifty Metal opened at 8941.35 and closed at 8854.30, marking a decrease of 43 points from the previous close, which translates to a percentage change of approximately -0.48%. The trading range for the day saw a high of 8972.60 and a low of 8725.80. The technical indicators show an RSI of 60.85, suggesting moderate strength, with a MACD of 117.82 signaling bullish momentum above its signal line.

Relationship with Key Moving Averages
The closing price of Nifty Metal is currently above its 50-day EMA of 8575.08 and the 20-day EMA of 8581.09 but slightly below its 200-day EMA of 8788.76. This suggests that the index is in a short-term uptrend but may face resistance around the longer-term moving average level.
Moving Averages Trend (MACD)
The MACD value for Nifty Metal is 117.82, which is above the MACD Signal line at 52.36, indicating a bullish momentum. This suggests that there is positive upward movement in the stock's price. However, monitoring for further confirmation of this trend is advised.

RSI Analysis
According to the data, the RSI for Nifty Metal stands at 60.85, indicating a neutral to slightly bullish momentum. An RSI value between 50 and 70 generally suggests that the stock is neither oversold nor overbought, providing room for potential upward movement.

Analysis for Nifty Bank - March 12, 2025

Nifty Bank opened at 47894.40 and closed at 48056.65, recording a percentage change of 0.42% and a points change of 202.70. The RSI value of 38.94 indicates that it is approaching oversold conditions, and a negative MACD suggests a bearish sentiment. The 50-day and 200-day EMAs are above the current closing, suggesting downward momentum.

Relationship with Key Moving Averages
Nifty Bank is currently trading below all its key moving averages, with the current close at 48056.65 compared to its 10 EMA at 48349.62, 20 EMA at 48646.24, 50 EMA at 49331.37, and 200 EMA at 49938.41. This suggests a bearish trend in the short to long term. The RSI of 38.94 indicates that the index may be approaching oversold territory.
Moving Averages Trend (MACD)
MACD Analysis for Nifty Bank: The MACD value is -378.26, and the MACD signal line is at -331.02, indicating that the MACD line is below the signal line. This suggests a bearish momentum for Nifty Bank as the negative divergence indicates potential weakness in the price movement.

RSI Analysis
The RSI value for Nifty Bank is 38.94, which suggests the stock is approaching the oversold territory. Typically, an RSI below 30 is considered oversold, indicating potential buying opportunities, while an RSI above 70 is considered overbought. Presently, the RSI indicates a cautious outlook with potential for reversal if the downtrend continues.

Analysis for Nifty 50 - March 12, 2025

Nifty 50 opened at 22,536.35, reaching a high of 22,577.40 and a low of 22,329.55, closing at 22,470.50. The index declined by 27.40 points with a percentage change of -0.12% compared to the previous close of 22,497.90. The RSI stands at 40.21, indicating mildly bearish momentum, accompanied by a MACD of -216.94, suggesting downward pressure.

Relationship with Key Moving Averages
The Nifty 50 closed at 22,470.5, which is below its 50-day EMA of 23,046.60 and 200-day EMA of 23,433.71, indicating a bearish trend. The index is also slightly below its 10-day EMA of 22,483.34 and 20-day EMA of 22,632.18, suggesting potential short-term weakness.
Moving Averages Trend (MACD)
MACD Analysis for Nifty 50: The MACD value of -216.94, which is above the MACD Signal of -242.42, suggests that although the index is experiencing downward momentum, there might be a narrowing bearish trend. However, further confirmation from other indicators would be needed to ascertain a potential change.

RSI Analysis
The RSI for Nifty 50 stands at 40.21, indicating it is approaching the oversold territory, but not yet at extreme levels. This suggests that the index might be experiencing downward pressure, and traders could be monitoring for potential buying opportunities if the RSI continues to decline towards 30.
