Global stock market indices: How the world markets performed today - 19 March 2025
The international stock market indices showed varied performances on March 19, 2025, reflecting the economic sentiment across different regions.
In this article, we analyze the performance of key global indices including the S&P 500, Dow Jones Industrial Average, NASDAQ Composite, FTSE 100, DAX, CAC 40, IBEX 35, Nikkei 225, Hang Seng, Nifty 50, and BSE Sensex.

Analysis for Sensex - March 19, 2025

Sensex Performance: The Sensex opened at 75,473.17 and closed slightly lower at 75,449.05, marking a positive change of 0.20% or a gain of 147.79 points from the previous close of 75,301.26. Despite this minimal gain, the overall trend suggests a mixed performance with the RSI at 54.58 and a negative MACD of -430.39 indicating potential cautious market sentiment.

Relationship with Key Moving Averages
Sensex closed at 75,449.05, slightly above its 20-day EMA of 74,740.40 but below the 50-day EMA of 75,906.33 and the 200-day EMA of 77,159.04. This suggests a short-term positive momentum relative to the 20-day EMA but an overall weaker position compared to the longer-term 50-day and 200-day EMAs.
Moving Averages Trend (MACD)
The MACD for Sensex stands at -430.39, indicating a bearish trend since it is below the MACD Signal of -677.02. This suggests that the momentum is currently downward, though the gap between the MACD and the Signal line is narrowing, which could hint at potential changes in trend direction.

RSI Analysis
The Relative Strength Index (RSI) for Sensex stands at 54.58, indicating a neutral position, as it lies near the midpoint of the typical 30-70 range. This suggests that Sensex neither shows strong overbought nor oversold conditions at this point.

Analysis for Dow Jones Industrial Average (US) - March 19, 2025

The Dow Jones Industrial Average opened at 41,772.91 and closed at 41,581.31 with a decline of 0.62%, losing 260.32 points. The RSI is at 38.06, indicating potential bearish momentum, and the MACD is below the signal line, suggesting further bearish trends in the short term.

Relationship with Key Moving Averages
The Dow Jones Industrial Average opened at 41,772.91, lower than its 10 EMA (41,911.17) and 50 EMA (43,124.56), but above its 200 EMA (42,000.46). The close at 41,581.31 indicates a downward trend, reflecting the -0.62% change and a negative MACD of -679.04.
Moving Averages Trend (MACD)
The MACD analysis for the Dow Jones Industrial Average indicates a bearish trend, as the MACD of -679.04 is lower than the signal line of -551.98. This suggests a potential downward momentum in the market.

RSI Analysis
RSI Analysis for Dow Jones Industrial Average (US): The RSI value is 38.06, which is below the typical neutral level of 50. This suggests that the index is experiencing bearish momentum and may be heading towards an oversold condition if it continues to decline.

Analysis for CAC 40 (France) - March 19, 2025

CAC 40 (France) opened at 8104.66 and closed at 8154.43, marking a positive change of 0.49% in value, with a points increase of 39.86. The index is trending above its 50-EMA and 200-EMA, indicating a bullish momentum, while the RSI is at 57.2, suggesting a moderately strong buying pressure.

Relationship with Key Moving Averages
CAC 40 (France) is currently trading above its 10 EMA and 20 EMA, indicating positive short-term momentum. It is also above its 50 EMA and 200 EMA, suggesting an overall bullish trend in the medium to long term.
Moving Averages Trend (MACD)
MACD Analysis for CAC 40 (France): The MACD value of 28.31 is currently below the MACD Signal line of 38.49, indicating a bearish sentiment in the short term. Traders may interpret this as a signal to approach with caution until there's a potential upward crossover.

RSI Analysis
The RSI for CAC 40 (France) stands at 57.20, which suggests a neutral momentum, as it is neither overbought nor oversold. This indicates a balanced market sentiment, with neither strong bullish nor bearish conditions prevalent.

Analysis for FTSE 100 (UK) - March 19, 2025

FTSE 100 (UK) opened at 8705.23, reaching a high of 8707.21 and a low of 8662.56, closing at 8697.06. The index experienced a slight decrease with a percentage change of -0.09% and a points change of -8.14. The 50-day and 200-day EMAs indicate a bullish trend, with RSI at 53.81 suggesting a neutral market condition.

Relationship with Key Moving Averages
The FTSE 100 closed at 8697.0596, which is slightly above its 10 EMA of 8658.2176 and its 20 EMA of 8663.1372, indicating a short-term bullish trend. However, it remains well above the 50 EMA of 8595.6039 and the 200 EMA of 8330.6939, showing long-term strength. The RSI of 53.81 suggests a neutral market momentum.
Moving Averages Trend (MACD)
FTSE 100's MACD is at 3.68, which is below its signal line of 10.59, suggesting a bearish signal. This indicates that the momentum in the FTSE 100 may be weakening, and prices could potentially continue to decline if this trend persists.

RSI Analysis
The FTSE 100 has an RSI of approximately 53.81, suggesting that it is in a neutral zone. This indicates that the index is neither overbought nor oversold, reflecting a balanced momentum at present without strong bullish or bearish signals.

Analysis for DAX (Germany) - March 19, 2025

The DAX (Germany) opened at 23,272 and closed slightly lower at 23,329, marking a percentage change of -0.22% from the previous close of 23,380. While the RSI indicates relatively strong momentum at 60.65, the MACD slightly exceeds its signal line, suggesting a minor bullish trend. The trading volume was recorded at zero, possibly indicating a reporting issue.

Relationship with Key Moving Averages
The DAX index is currently trading above its 50 EMA (22,063.92) and 200 EMA (20,080.76), indicating a bullish trend. However, it is close to its 10 EMA (22,988.45), suggesting potential near-term movement.
Moving Averages Trend (MACD)
The MACD for DAX (Germany) indicates a positive trend as it is above the Signal line with a MACD of 318.31 compared to the Signal line at 313.19. This suggests that the momentum is slightly bullish, as the MACD is positive and higher than the Signal line.

RSI Analysis
The RSI value for DAX (Germany) is 60.65, indicating a moderately strong market momentum. Typically, an RSI above 50 suggests bullish conditions, but it is not yet in the overbought range, which usually starts at 70. This suggests potential stability with room for an upward trend.

Analysis for S&P 500 (US) - March 19, 2025

The S&P 500 (US) closed at 5614.66, reflecting a decrease of 1.07% or 60.46 points from the previous close of 5675.12. The index moved between a low of 5597.76 and a high of 5654.53. The Relative Strength Index (RSI) stands at 37.45, indicating the market may be approaching oversold conditions.

Relationship with Key Moving Averages
The S&P 500 is trading below its 50-day EMA, 200-day EMA, 10-day EMA, and 20-day EMA, indicating a bearish trend relative to these key moving averages. With a current RSI of 37.45, the index is approaching the oversold territory, suggesting potential downward momentum. The MACD line being below the signal line confirms this bearish movement.
Moving Averages Trend (MACD)
The S&P 500's MACD is at -109.810, which is below its signal line of -92.636, indicating a bearish trend. This negative MACD value suggests that the momentum is currently shifting downwards.

RSI Analysis
The S&P 500 has an RSI of 37.45, which suggests that the stock is approaching oversold territory. This could indicate a potential buying opportunity as the RSI is below the neutral midpoint of 50. Caution should be taken as other factors might influence the market trend.

Analysis for Hang Seng Index (Hong Kong) - March 19, 2025

The Hang Seng Index opened at 24,697.63 and closed at 24,771.14, exhibiting a slight increase of 0.12% or 30.57 points compared to the previous close. The RSI of 69.59 suggests the index is approaching overbought conditions, while the MACD indicates a bullish trend, as it is above the MACD Signal line.

Relationship with Key Moving Averages
The Hang Seng Index's current price of 24,771.14 is above its 50-day EMA of 22,325.60, 200-day EMA of 20,102.16, and 10-day EMA of 24,070.79, indicating a strong upward trend. The close is also above the 20-day EMA of 23,561.54, suggesting continued bullish momentum. The RSI of 69.59 further supports the strength, nearing overbought territory.
Moving Averages Trend (MACD)
MACD Analysis for Hang Seng Index: The MACD value of 707.95 is slightly above the MACD Signal of 706.03, indicating a potential bullish signal. This suggests that the short-term momentum for the index might be gaining strength compared to the long-term trend.

RSI Analysis
RSI Analysis for Hang Seng Index (Hong Kong): The Relative Strength Index (RSI) is currently at 69.59, indicating that the index is approaching overbought conditions. This suggests that the Hang Seng Index may be due for a potential price correction or consolidation if this trend continues.

Analysis for IBEX 35 (Spain) - March 19, 2025

IBEX 35 (Spain) opened at 13,270.70 and closed slightly lower at 13,346.90, marking a decrease of 0.06% with a point change of -7.80. The overall market movement is steady, with a notable RSI of 62.85 indicating a somewhat bullish trend, despite a slight drop in the MACD compared to its signal line.

Relationship with Key Moving Averages
The IBEX 35 (Spain) is trading above its 10 EMA (13,140.45) and 20 EMA (13,061.06), indicating a short-term bullish trend. However, it is significantly higher than its 50 EMA (12,724.39) and 200 EMA (11,831.61), suggesting an extended upward trend over the medium to long term.
Moving Averages Trend (MACD)
The MACD for IBEX 35 is 131.75, which is below the MACD Signal of 148.39, indicating a bearish crossover. This suggests potential downward momentum in the near term.

RSI Analysis
The RSI for IBEX 35 (Spain) is 62.85, indicating that the index is approaching overbought levels but still falls within the neutral range. Continued monitoring is advised as a rising RSI can signal increasing bullish momentum.

Analysis for NASDAQ Composite (US) - March 19, 2025

NASDAQ Composite (US) Performance: The NASDAQ Composite experienced a downturn, closing at 17,504.12, marking a decrease of 1.71% from the previous close. The index faced a notable drop of 304.54 points with a high trading volume of 6,450,530,000, reflecting bearish sentiments as indicated by an RSI of 35.17 and a negative MACD of -524.73, suggesting downward momentum.

Relationship with Key Moving Averages
The closing price of NASDAQ Composite on the reported day is 17,504, which is below the 10-day EMA (17,839.92), 50-day EMA (18,838.22), and 200-day EMA (18,273.29). This indicates a bearish trend relative to these key moving averages.
Moving Averages Trend (MACD)
MACD Analysis for NASDAQ Composite (US): The MACD value of -524.73, being below the signal line at -463.37, indicates a bearish momentum in the NASDAQ Composite. This suggests a potential continuation of the downward trend in the short term.

RSI Analysis
The RSI for NASDAQ Composite is 35.17, which indicates that the index is nearing the oversold territory typically marked by an RSI below 30. The current RSI suggests bearish momentum, and traders might watch for a possible reversal or continued downward trend.

Analysis for Nikkei 225 (Japan) - March 19, 2025

The Nikkei 225 opened at 37,839.39 and closed slightly lower at 37,751.88, reflecting a daily change of -0.25%. The index experienced a decline of 93.54 points compared to the previous close. The RSI indicates a fairly neutral position at 48.55, while the MACD value suggests a negative trend with a signal difference of -85.66.

Relationship with Key Moving Averages
The Nikkei 225 closed at 37,751.88, which is below its 50 EMA of 38,246.99 and 200 EMA of 38,186.18, suggesting a bearish short-term trend. However, it's above the 10 EMA of 37,424.81 and the 20 EMA of 37,675.17, indicating potential support in the short to medium term.
Moving Averages Trend (MACD)
The MACD for Nikkei 225 is -378.39, which is above its signal line of -464.05. This indicates a potentially positive momentum shift, suggesting a possible trend reversal or strengthening bullish momentum. However, considering other indicators would provide a more comprehensive analysis.

RSI Analysis
Nikkei 225 RSI Analysis: The Relative Strength Index (RSI) for the Nikkei 225 is 48.55, which indicates a neutral trend as it is close to the midpoint of 50. This suggests that the market is neither overbought nor oversold, pointing to a potentially stable price movement in the near term.

Analysis for Nifty Bank - March 19, 2025
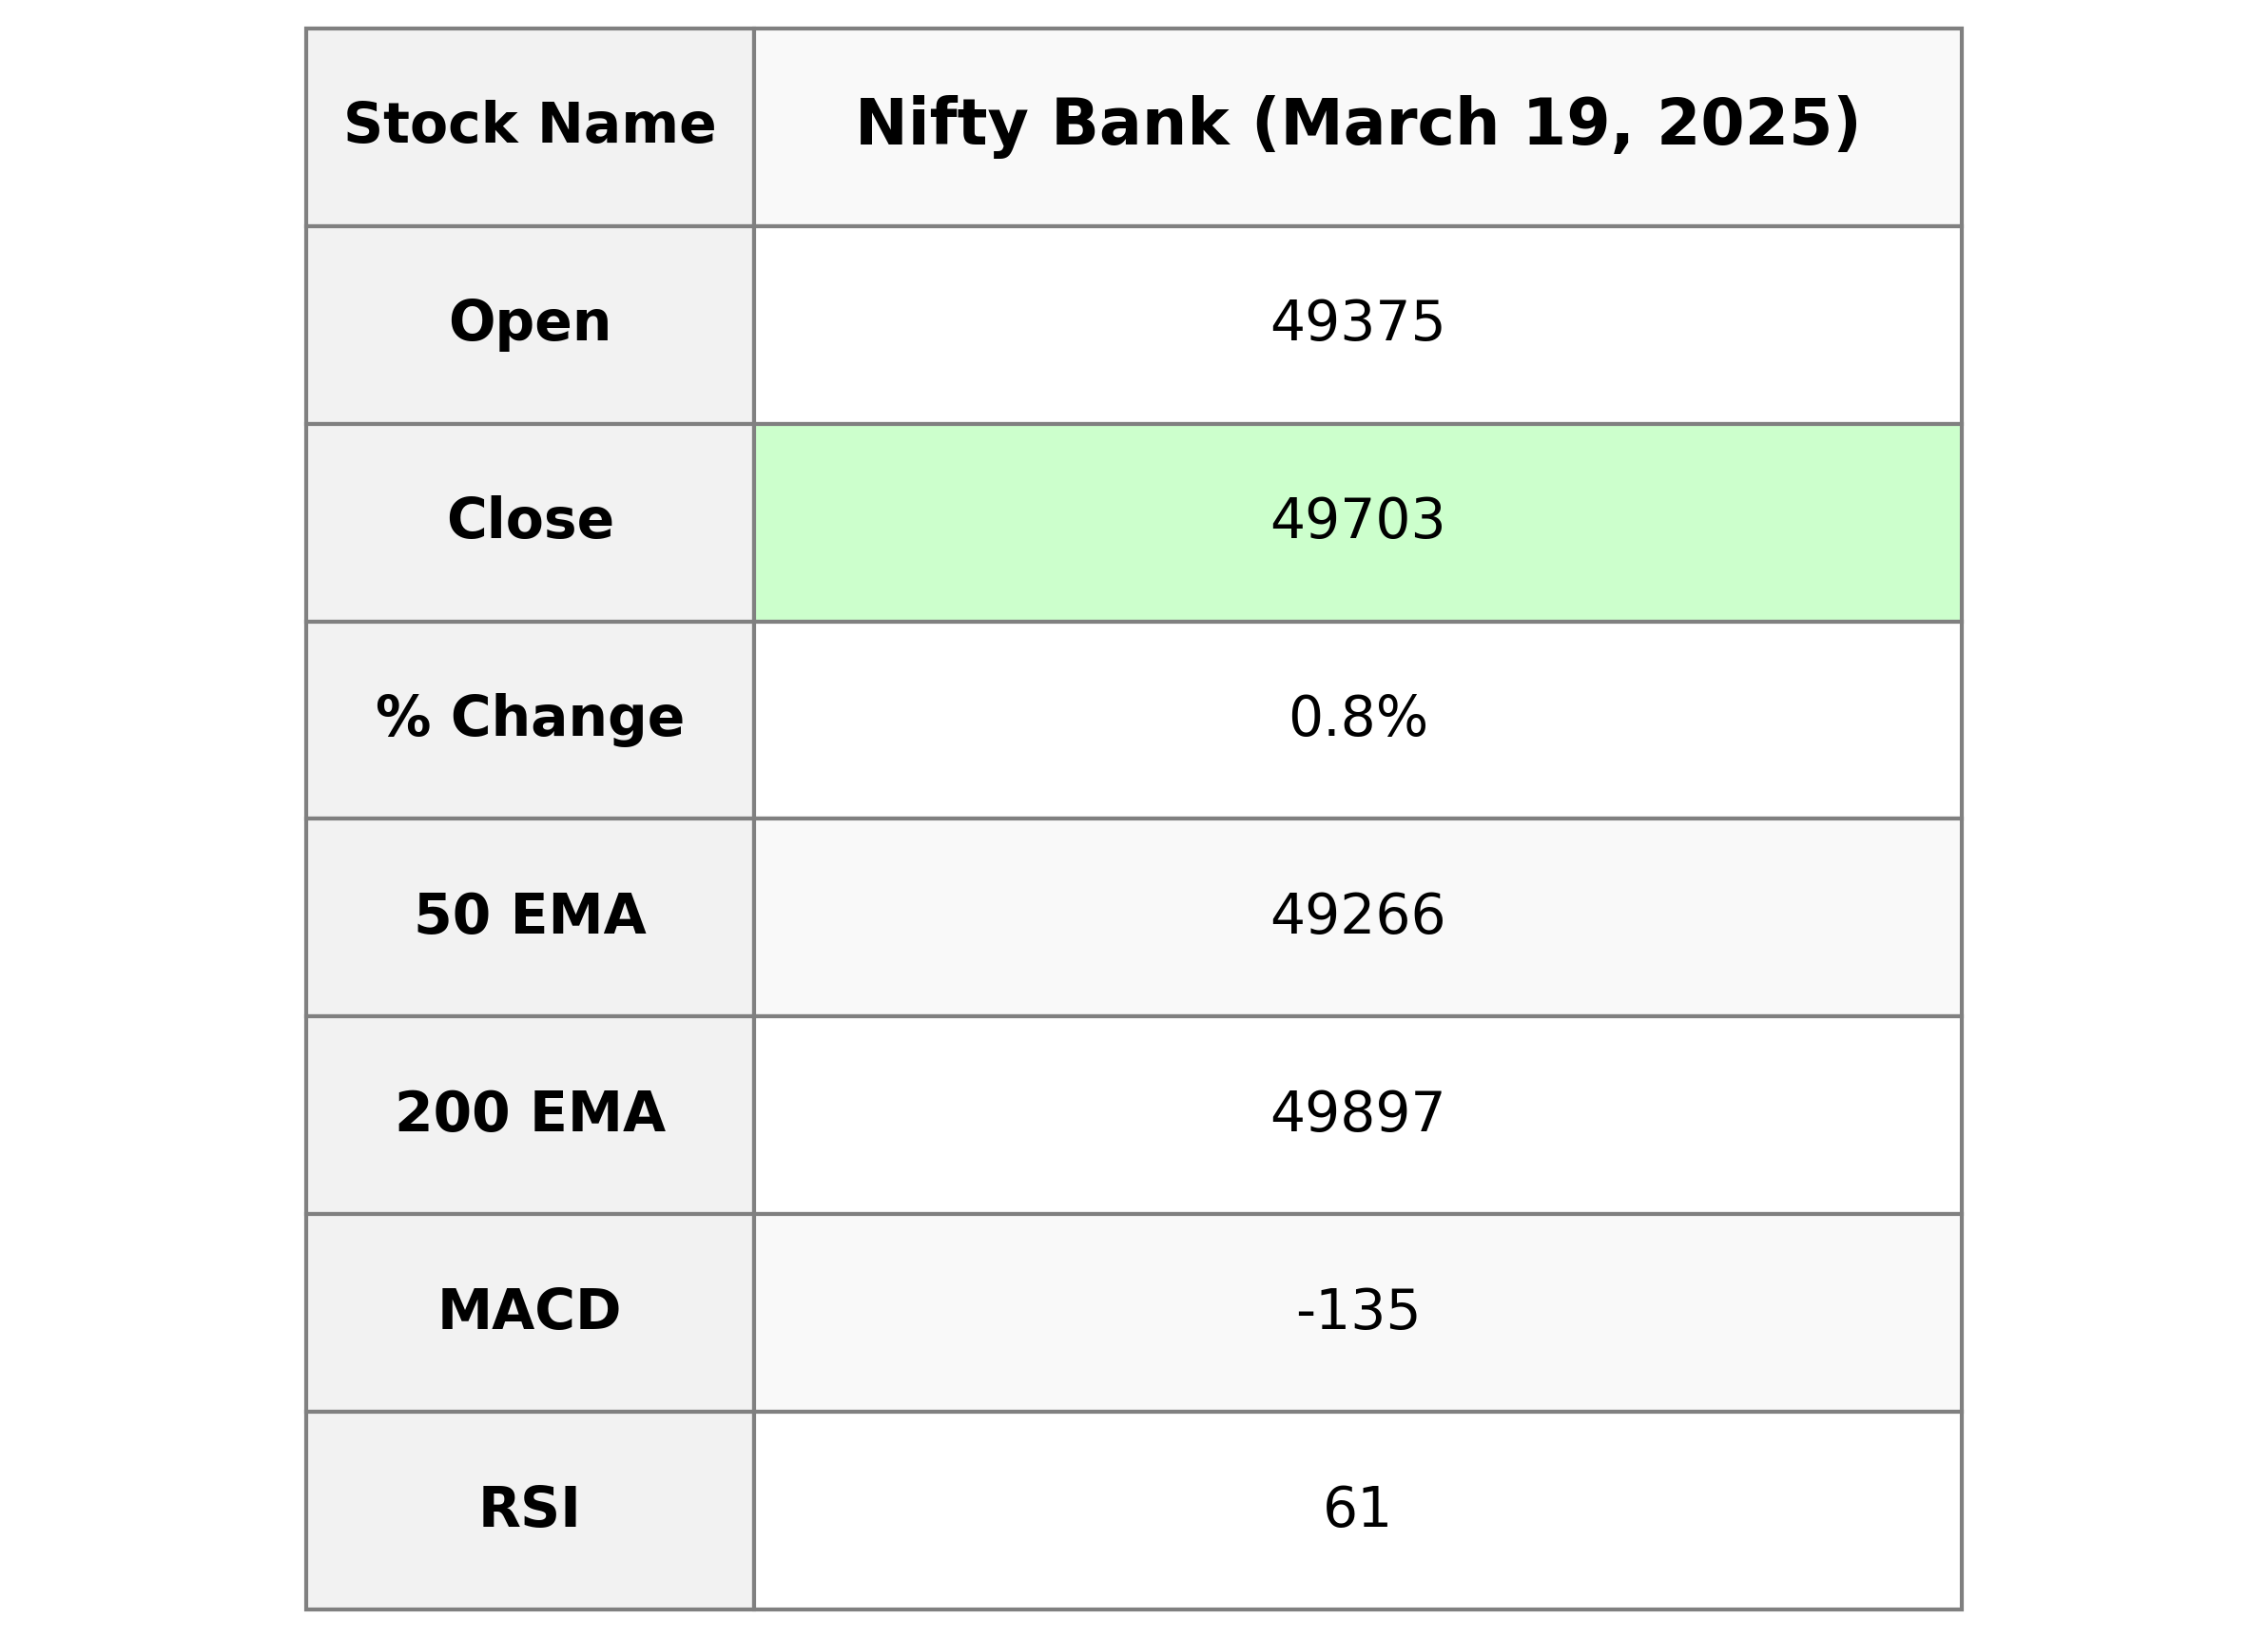
Nifty Bank opened at 49375.40 and closed higher at 49702.60, marking a 0.79% increase from its previous close of 49314.50. While the index experienced a high of 49807.55, the MACD indicates a negative trend at -135.40, though improving from the signal line at -286.28. The RSI at 60.77 suggests a moderately bullish sentiment in the current market dynamics.

Relationship with Key Moving Averages
Nifty Bank closed at 49,702.60, which is above its 50-day EMA of 49,265.71 and also above its 10-day EMA of 48,710.90 but below its 200-day EMA of 49,897.29. This indicates short-term bullish momentum but suggests that it is still below the long-term trend level as per the 200-day EMA.
Moving Averages Trend (MACD)
The MACD value for Nifty Bank is -135.40, while the MACD Signal is -286.28. This indicates that the MACD line is above its signal line, suggesting potential bullish momentum in the short term. However, the negative values denote an overall negative trend that may still be influencing the indicator.

RSI Analysis
RSI Analysis for Nifty Bank: The Relative Strength Index (RSI) for Nifty Bank is 60.77, indicating a moderate momentum in the current trend. RSI values above 70 typically signify overbought conditions, while values below 30 suggest oversold conditions. As Nifty Bank's RSI is closer to 70, it shows a neutral to slightly bullish sentiment.

Analysis for Nifty 50 - March 19, 2025

The Nifty 50 opened at 22,874.95 and closed at 22,907.60, indicating a gain with a 0.32% change from the previous close. The index experienced a high of 22,940.70 and a low of 22,807.95, with a points change of 73.30. The RSI stands at 56.03, and the MACD value is -111.33, suggesting mild bullish conditions.

Relationship with Key Moving Averages
For Nifty 50, the close price of 22907.60 is below the 50 EMA of 22991.09 and the 200 EMA of 23403.96, indicating a short-term downtrend. However, it is above the 10 EMA of 22607.20 and the 20 EMA of 22649.63, suggesting some recent upward movement.
Moving Averages Trend (MACD)
Nifty 50's MACD is -111.33, which is above the MACD Signal of -191.93. This can indicate a potential bullish trend, as the MACD line is trying to move above the signal line. However, it's important to observe further movements for confirmation.

RSI Analysis
The RSI (Relative Strength Index) for Nifty 50 is currently at 56.03, which suggests that it is in a neutral zone. This indicates that there are no immediate overbought or oversold conditions, implying a balanced market sentiment and moderate price momentum.
