Global stock market indices: How the world markets performed today - 27 March 2025
The international stock market indices showed varied performances on March 27, 2025, reflecting the economic sentiment across different regions.
In this article, we analyze the performance of key global indices including the S&P 500, Dow Jones Industrial Average, NASDAQ Composite, FTSE 100, DAX, CAC 40, IBEX 35, Nikkei 225, Hang Seng, Nifty 50, and BSE Sensex.

Analysis for Sensex - March 27, 2025

Sensex opened at 77,087.39, reached a high of 77,747.46, and closed at 77,606.43, marking a 0.41% increase or a gain of 317.93 points from the previous close. The RSI of 65.02 suggests the index is approaching overbought levels, while the MACD value of 510.77 indicates a strong upward momentum.

Relationship with Key Moving Averages
Sensex is trading above its 10 EMA, 50 EMA, and 200 EMA, indicating a strong short-term and long-term bullish trend. The closing price is also higher compared to the previous day, showing positive momentum. The RSI value is 65, suggesting moderately overbought conditions.
Moving Averages Trend (MACD)
Sensex MACD Analysis: The MACD value for Sensex is significantly higher than the MACD Signal at 510.77 compared to 31.65, indicating a strong bullish momentum. The bullish crossover with a positive MACD value suggests that the recent price trend is upward, and this buying momentum may continue if supported by further positive trends in other indicators.

RSI Analysis
The RSI for Sensex is currently at 65.02, which suggests a strong upward momentum and potentially nearing overbought territory. Investors might watch for a level closer to 70 as an indicator of an overbought condition, indicating potential resistance or a pullback in the market.

Analysis for Dow Jones Industrial Average (US) - March 27, 2025

Dow Jones Industrial Average (US) opened at 42,655.85 and closed at 42,454.79, experiencing a decrease of 132.71 points (-0.31%). The day's high was 42,821.83, and the low was 42,326.67. The RSI indicates a neutral market condition at 48.36.

Relationship with Key Moving Averages
The Dow Jones Industrial Average's closing value of 42,454.79 is below its 50-day EMA of 42,942.46, indicating short-term bearish sentiment. However, it is above the 200-day EMA of 42,016.19, suggesting a longer-term bullish trend. The 10-day EMA of 42,206.81 and 20-day EMA of 42,405.55 show mixed trends, highlighting short-term volatility.
Moving Averages Trend (MACD)
The Dow Jones Industrial Average (US) has a MACD value of -342.67, which is higher than the MACD Signal value of -483.08. This suggests that the bearish momentum might be weakening and there may be a potential for a trend reversal to the upside. However, the negative MACD still indicates current bearish conditions.

RSI Analysis
The RSI for the Dow Jones Industrial Average is currently at 48.36, which suggests a neutral market sentiment. Since the RSI is neither in the overbought territory (above 70) nor in the oversold territory (below 30), it indicates that there are no strong buying or selling pressures at the moment.

Analysis for CAC 40 (France) - March 27, 2025

CAC 40 (France): The CAC 40 index opened at 7968.80, reaching a high of 8015.89 and a low of 7926.93, before closing at 8005.21. This represents a decline of approximately 0.32% from the previous close of 8030.68, with a points change of -25.47. Despite the drop, the index remains above its 50-day EMA of 7964.38 and well above its 200-day EMA of 7705.56, indicating a potential overall positive long-term trend. The RSI stands at 47.32, suggesting a neutral momentum.

Relationship with Key Moving Averages
CAC 40 (France) closed at 8005.21, which is above its 50 EMA of 7964.38, indicating short-term strength, but below the 10 EMA of 8054.65 and 20 EMA of 8058.49, suggesting recent downward pressure.
Moving Averages Trend (MACD)
Based on the stock data for CAC 40 (France), the MACD value is 8.76, which is below the MACD Signal value of 22.40. This indicates a potential bearish trend or weakening momentum, suggesting that the price might continue to decline.

RSI Analysis
The RSI for CAC 40 (France) stands at 47.32, indicating a neutral market position as it is between the overbought threshold of 70 and the oversold threshold of 30. This suggests that the stock is neither overbought nor oversold at the moment.

Analysis for FTSE 100 (UK) - March 27, 2025

FTSE 100 (UK) opened at 8689.59 and closed at 8640.53, indicating a decrease of approximately 0.56% or 49.07 points from the previous close of 8689.60. The Relative Strength Index (RSI) stands at 48.22, suggesting a relatively neutral momentum. Despite the slight drop, the 50-day EMA at 8610.27 shows the index is still trending above its longer-term moving average.

Relationship with Key Moving Averages
FTSE 100 is currently trading below its 10-day EMA at 8640.53 compared to 8660.85, indicating short-term bearish momentum. However, it remains slightly above its 50 EMA of 8610.27 and notably above the 200 EMA at 8350.24, suggesting an overall upward trend in the longer term.
Moving Averages Trend (MACD)
The FTSE 100 (UK) shows a MACD value of 2.45, which is below the MACD Signal of 5.59. This indicates a bearish trend, suggesting a potential continuation of the downward movement in its price.

RSI Analysis
The RSI (Relative Strength Index) for FTSE 100 is at 48.22, which suggests that the market is currently neutral and neither overbought nor oversold. Traders might interpret this as a sign of potential indecision in the market.

Analysis for DAX (Germany) - March 27, 2025

DAX (Germany) Performance Summary: The DAX index opened at 22574.46 and closed at 22688.15, marking a decrease of approximately -0.66% from the previous close of 22839.03, with a points change of -150.88. The relative strength index (RSI) is close to the neutral 50 mark at 49.78, indicating a balance between buying and selling pressures. The moving average convergence divergence (MACD) at 177.88 shows a decreasing trend compared to the MACD signal at 248.95, suggesting a potential slowdown in the current trend's momentum.

Relationship with Key Moving Averages
DAX (Germany) closed at 22,688.15, which is above its 50-day EMA of 22,239.30 but below its 10-day EMA of 22,903.44 and 20-day EMA of 22,816.73. The index shows a slight downward movement with a percentage change of -0.66%.
Moving Averages Trend (MACD)
The MACD for DAX (Germany) indicates a bearish trend as the MACD line (177.88) is below the MACD Signal line (248.95). This suggests that the stock may continue to experience downward momentum.

RSI Analysis
Based on the provided stock data, the Relative Strength Index (RSI) for DAX (Germany) is 49.78. This value indicates a neutral stance, suggesting that the index is neither overbought nor oversold at the moment. An RSI value close to 50 typically denotes a balanced momentum in the market.

Analysis for S&P 500 (US) - March 27, 2025

S&P 500 (US) opened at 5771.66, with a high of 5783.62 and a low of 5694.41, closing at 5712.20, indicating a decrease of 1.12% or 64.45 points. The RSI is at 45.46, suggesting a slightly bearish sentiment, while the MACD at -61.46 shows a less pronounced bearish momentum compared to its signal line at -81.55.

Relationship with Key Moving Averages
The S&P 500 is trading below its 50-EMA at 5840.91, indicating a potential downtrend, and is slightly above its 200-EMA at 5705.38, suggesting a critical support level. The index is also close to its 10-EMA at 5706.15, reflecting short-term uncertainty.
Moving Averages Trend (MACD)
MACD Analysis for S&P 500 (US): The MACD value of -61.46 is below its Signal Line of -81.55, indicating a potential bullish crossover scenario. This suggests that momentum is beginning to shift in favor of buyers, despite the current bearish trend.

RSI Analysis
The RSI for S&P 500 is 45.46, indicating that the market is currently in a neutral zone. This suggests that the index is neither overbought nor oversold, and it may continue to fluctuate within its current trend in the short term.

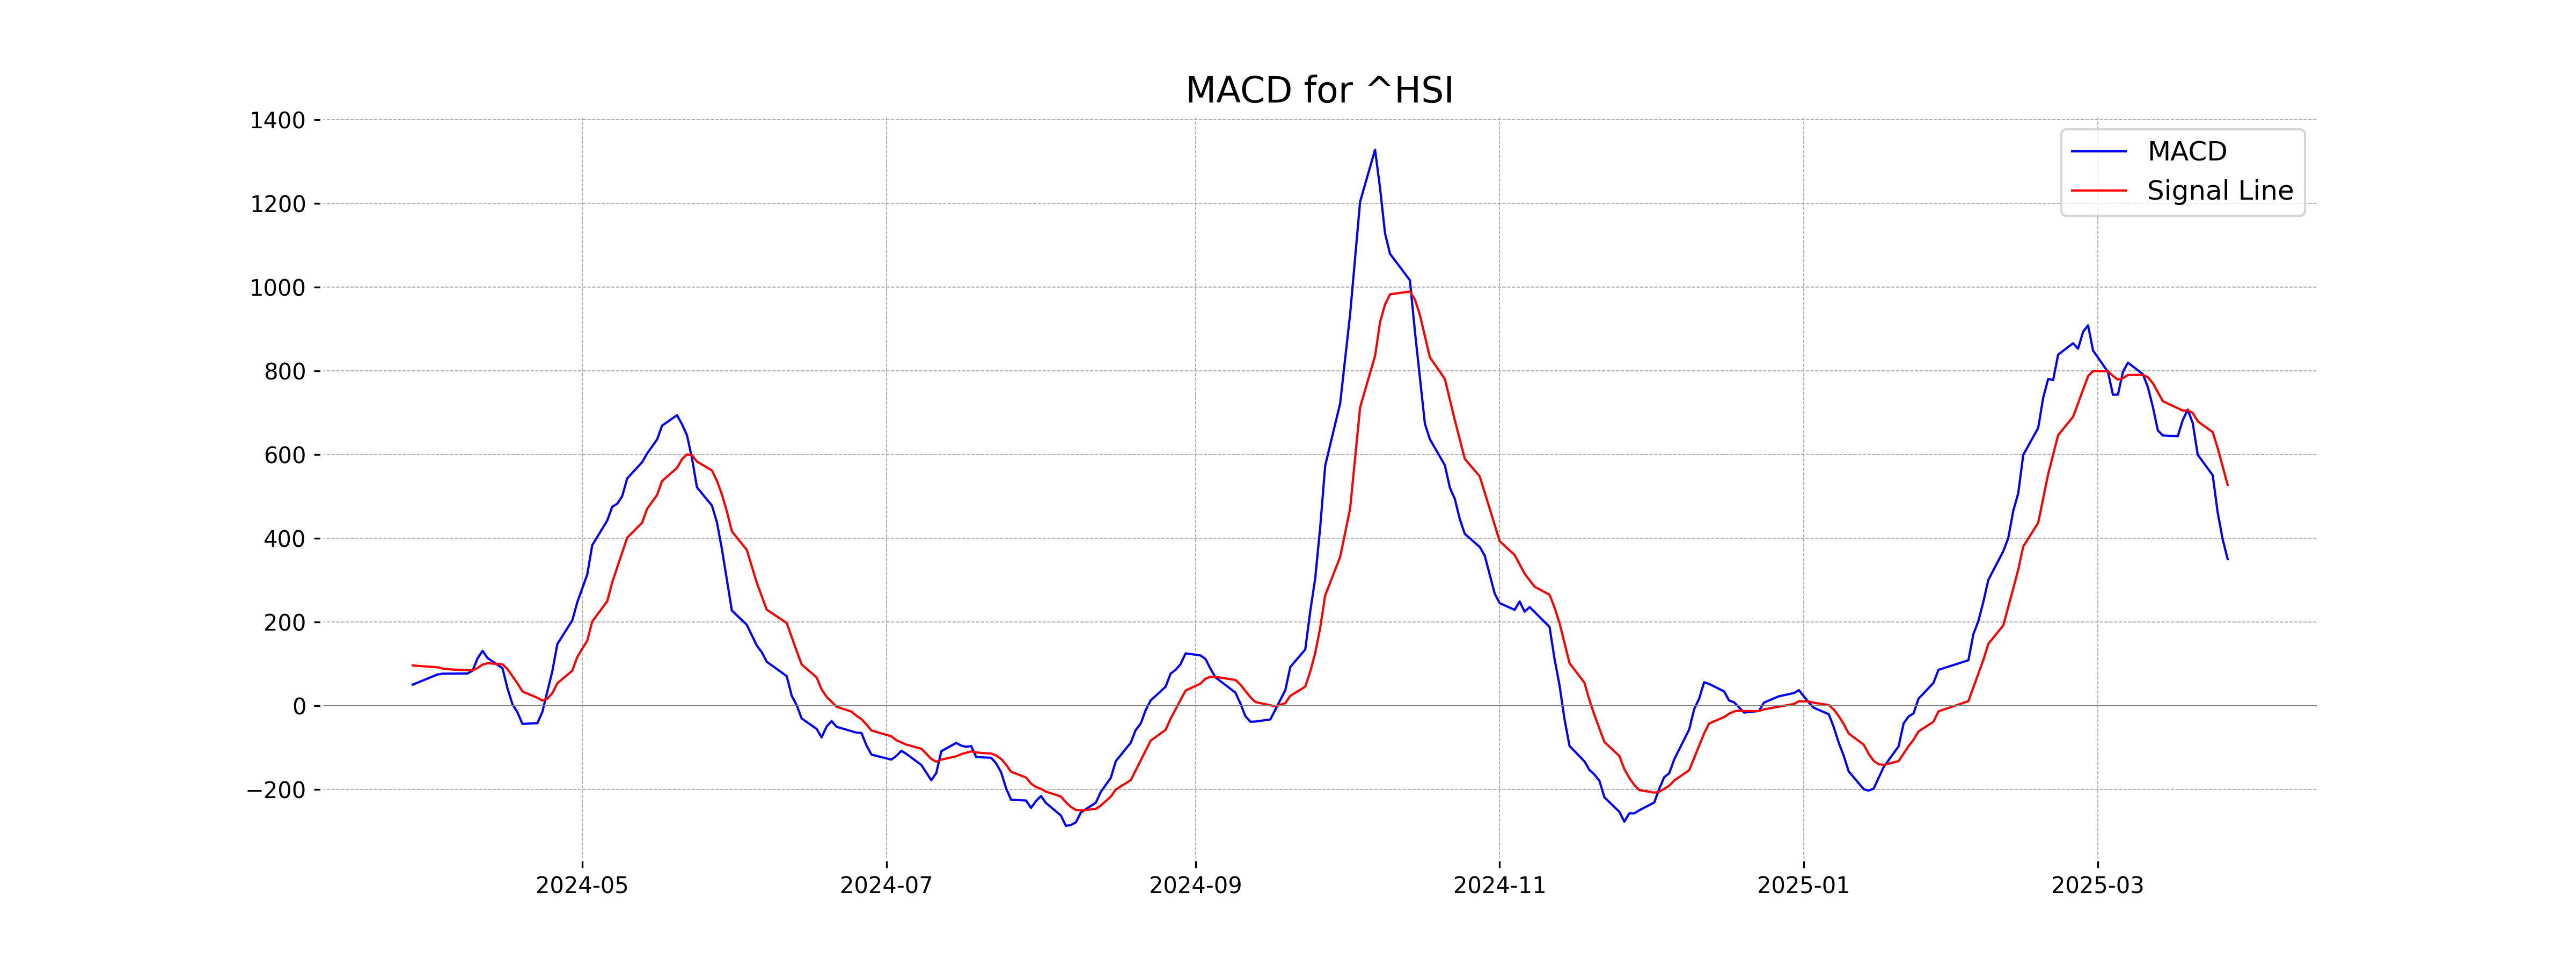
Analysis for Hang Seng Index (Hong Kong) - March 27, 2025

Hang Seng Index (Hong Kong) Performance: The Hang Seng Index opened at 23,543.86 and closed at 23,578.80, marking a slight increase of 0.41% from the previous close of 23,483.32, with a points change of 95.48. Despite no volume data, the index shows a moderate RSI of 52.43, indicating a balanced momentum between buying and selling pressures.

Relationship with Key Moving Averages
Hang Seng Index is trading above its 50-day EMA but below its 10-day and 20-day EMAs, indicating mixed short-term momentum. The proximity to the 50-day EMA suggests some potential support around this level, while its position relative to the shorter-term averages reflects recent downward pressure.
Moving Averages Trend (MACD)
The Hang Seng Index's MACD value is 350.82, while the MACD Signal is higher at 527.92, indicating a bearish signal as the MACD is below the Signal. This suggests potential downward momentum or a consolidation phase.
RSI Analysis
The RSI for the Hang Seng Index (Hong Kong) is 52.43, which suggests a neutral market position, neither overbought nor oversold. This indicates a balanced momentum and no immediate directional bias.

Analysis for IBEX 35 (Spain) - March 27, 2025

IBEX 35 (Spain) opened at 13,329.5 and closed slightly lower at 13,406.7, with a percentage change of -0.19% from the previous close of 13,432.2. The trading volume was 29,116,072, and the RSI indicates a moderately strong position at 61.02. Key EMAs show the 50-day moving average at 12,867.64, while the 200-day stands at 11,922.89.

Relationship with Key Moving Averages
The IBEX 35 closed at 13406.70, which is above its 50-day EMA of 12867.64 and its 200-day EMA of 11922.89, indicating an upward trend in the short to medium term. It also remains close to its 10-day EMA of 13323.80, suggesting recent positive momentum.
Moving Averages Trend (MACD)
The MACD value for IBEX 35 (Spain) is 156.49, which is above the MACD Signal of 151.48, indicating a bullish trend. With the RSI at 61.02, the index is showing strong momentum but is not yet in overbought territory.

RSI Analysis
The current RSI value for the IBEX 35 is 61.02, indicating a moderately strong level of bullish momentum. This suggests that the index is neither overbought nor oversold, implying balanced market conditions.

Analysis for NASDAQ Composite (US) - March 27, 2025

NASDAQ Composite (US) Performance: On the latest trading day, the NASDAQ Composite opened at 18,217.33, reaching a high of 18,236.55 and a low of 17,837.26, closing at 17,899.02. The index fell by 2.04% from the previous close of 18,271.86, representing a points decrease of 372.84. The 50-day and 200-day EMAs suggest a bearish trend, and the current RSI of 43.71 indicates a potentially oversold market.

Relationship with Key Moving Averages
The NASDAQ Composite closed below its 50-day EMA (18646.64) and 200-day EMA (18253.90), indicating a bearish momentum as the close of 17899.02 was significantly lower. Furthermore, the 10-day EMA is close to the current closing price, showing recent volatile market behavior.
Moving Averages Trend (MACD)
The MACD for the NASDAQ Composite is -314.87, with a MACD Signal of -406.59. Since the MACD is higher than the MACD Signal, this indicates that the market may be experiencing a potential reversal or slowdown in bearish momentum for the NASDAQ Composite. However, given that both values are negative, the overall trend still leans bearish.

RSI Analysis
NASDAQ Composite (US) RSI Analysis: The RSI for NASDAQ Composite is at 43.71, indicating a moderately bearish momentum as it is below 50. It suggests that the index is approaching the oversold territory but has not reached it yet, potentially signaling less selling pressure.

Analysis for Nikkei 225 (Japan) - March 27, 2025

Nikkei 225 (Japan) opened at 37,750.66 and closed at 37,799.97, reflecting a points change of -227.32, equivalent to a percentage change of -0.60%. The index experienced a high of 37,859.06 and a low of 37,556.75, with its 10 and 20 EMA values supporting its current position below both the 50 and 200 EMAs. The RSI is close to neutral at 49.41, and the MACD indicates a bearish sentiment.

Relationship with Key Moving Averages
The Nikkei 225 closed at 37,799.97, which is below both its 50-day EMA of 38,163.05 and 200-day EMA of 38,167.17, indicating a bearish trend in the short to medium term. The 10-day EMA at 37,664.79 and 20-day EMA at 37,721.03 show that recent prices are slightly on a downward trend, but still close to the current price.
Moving Averages Trend (MACD)
The MACD for Nikkei 225 stands at -169.74, while the MACD Signal is -308.31. This indicates a potential upward trend as the MACD line is above the signal line, possibly signaling a bullish momentum though still negative.

RSI Analysis
The RSI for Nikkei 225 is 49.41, which indicates a neutral momentum as it is near the midpoint of the RSI range. This suggests that the market is trading without a strong bullish or bearish trend.

Analysis for Nifty Bank - March 27, 2025

Nifty Bank opened at 51,084.70 and closed at 51,575.85, marking a positive change of 0.72% from the previous close of 51,209. The high for the day was 51,714.35, and the low was 51,050.85. The RSI is relatively high at 69.96, indicating potential overbought conditions.

Relationship with Key Moving Averages
Nifty Bank closed above its 50 EMA and 200 EMA, indicating a bullish trend. The close price of 51,575.85 is also above the 10 EMA and 20 EMA, suggesting continued momentum in the upward direction.
Moving Averages Trend (MACD)
Nifty Bank's MACD stands at 608.36, which is above the MACD Signal of 230.21, indicating a potential upward momentum in the stock's price. This suggests a bullish trend as the MACD line is significantly above the signal line.

RSI Analysis
RSI Analysis for Nifty Bank: The RSI for Nifty Bank is 69.96, which is approaching the overbought territory. Typically, an RSI above 70 suggests the asset might be overvalued, potentially indicating a trend reversal or correction in the near future.

Analysis for Nifty 50 - March 27, 2025

The Nifty 50 opened at 23,433.95 and closed higher at 23,591.95, marking a percentage change of 0.45% with a point increase of 105.10 from the previous close of 23,486.85. The index experienced a trading range between a low of 23,412.20 and a high of 23,646.45. Indicators suggest a positive trend with a 50 EMA at 23,099.49, a 200 EMA at 23,409.67, RSI at 66.72, and MACD value of 177.31, highlighting bullish momentum despite no recorded trading volume.

Relationship with Key Moving Averages
The closing price of Nifty 50 is currently above the 50 EMA (23099.49) and 20 EMA (23038.07), indicating a potential bullish trend. It is also above the 200 EMA (23409.67), suggesting a strong longer-term momentum. The 10 EMA (23250.42) supports this trend with its position lower than the current close price.
Moving Averages Trend (MACD)
Nifty 50's MACD value of 177.31 is significantly above its Signal Line value of 28.42, indicating a bullish signal. This suggests strong upward momentum, which could potentially lead to further price appreciation in the near term.

RSI Analysis
Based on the provided stock data, the Relative Strength Index (RSI) for Nifty 50 is 66.72, indicating a strong momentum as it is above the typical midpoint of 50. However, it is approaching the overbought threshold of 70, suggesting that investors should be cautious of potential overvaluation in the short term.
