Indian stock market sector-wise performance today - April 1, 2025
The stock market on Tuesday (April 1, 2025) observed a day of notable fluctuations across various sectors.
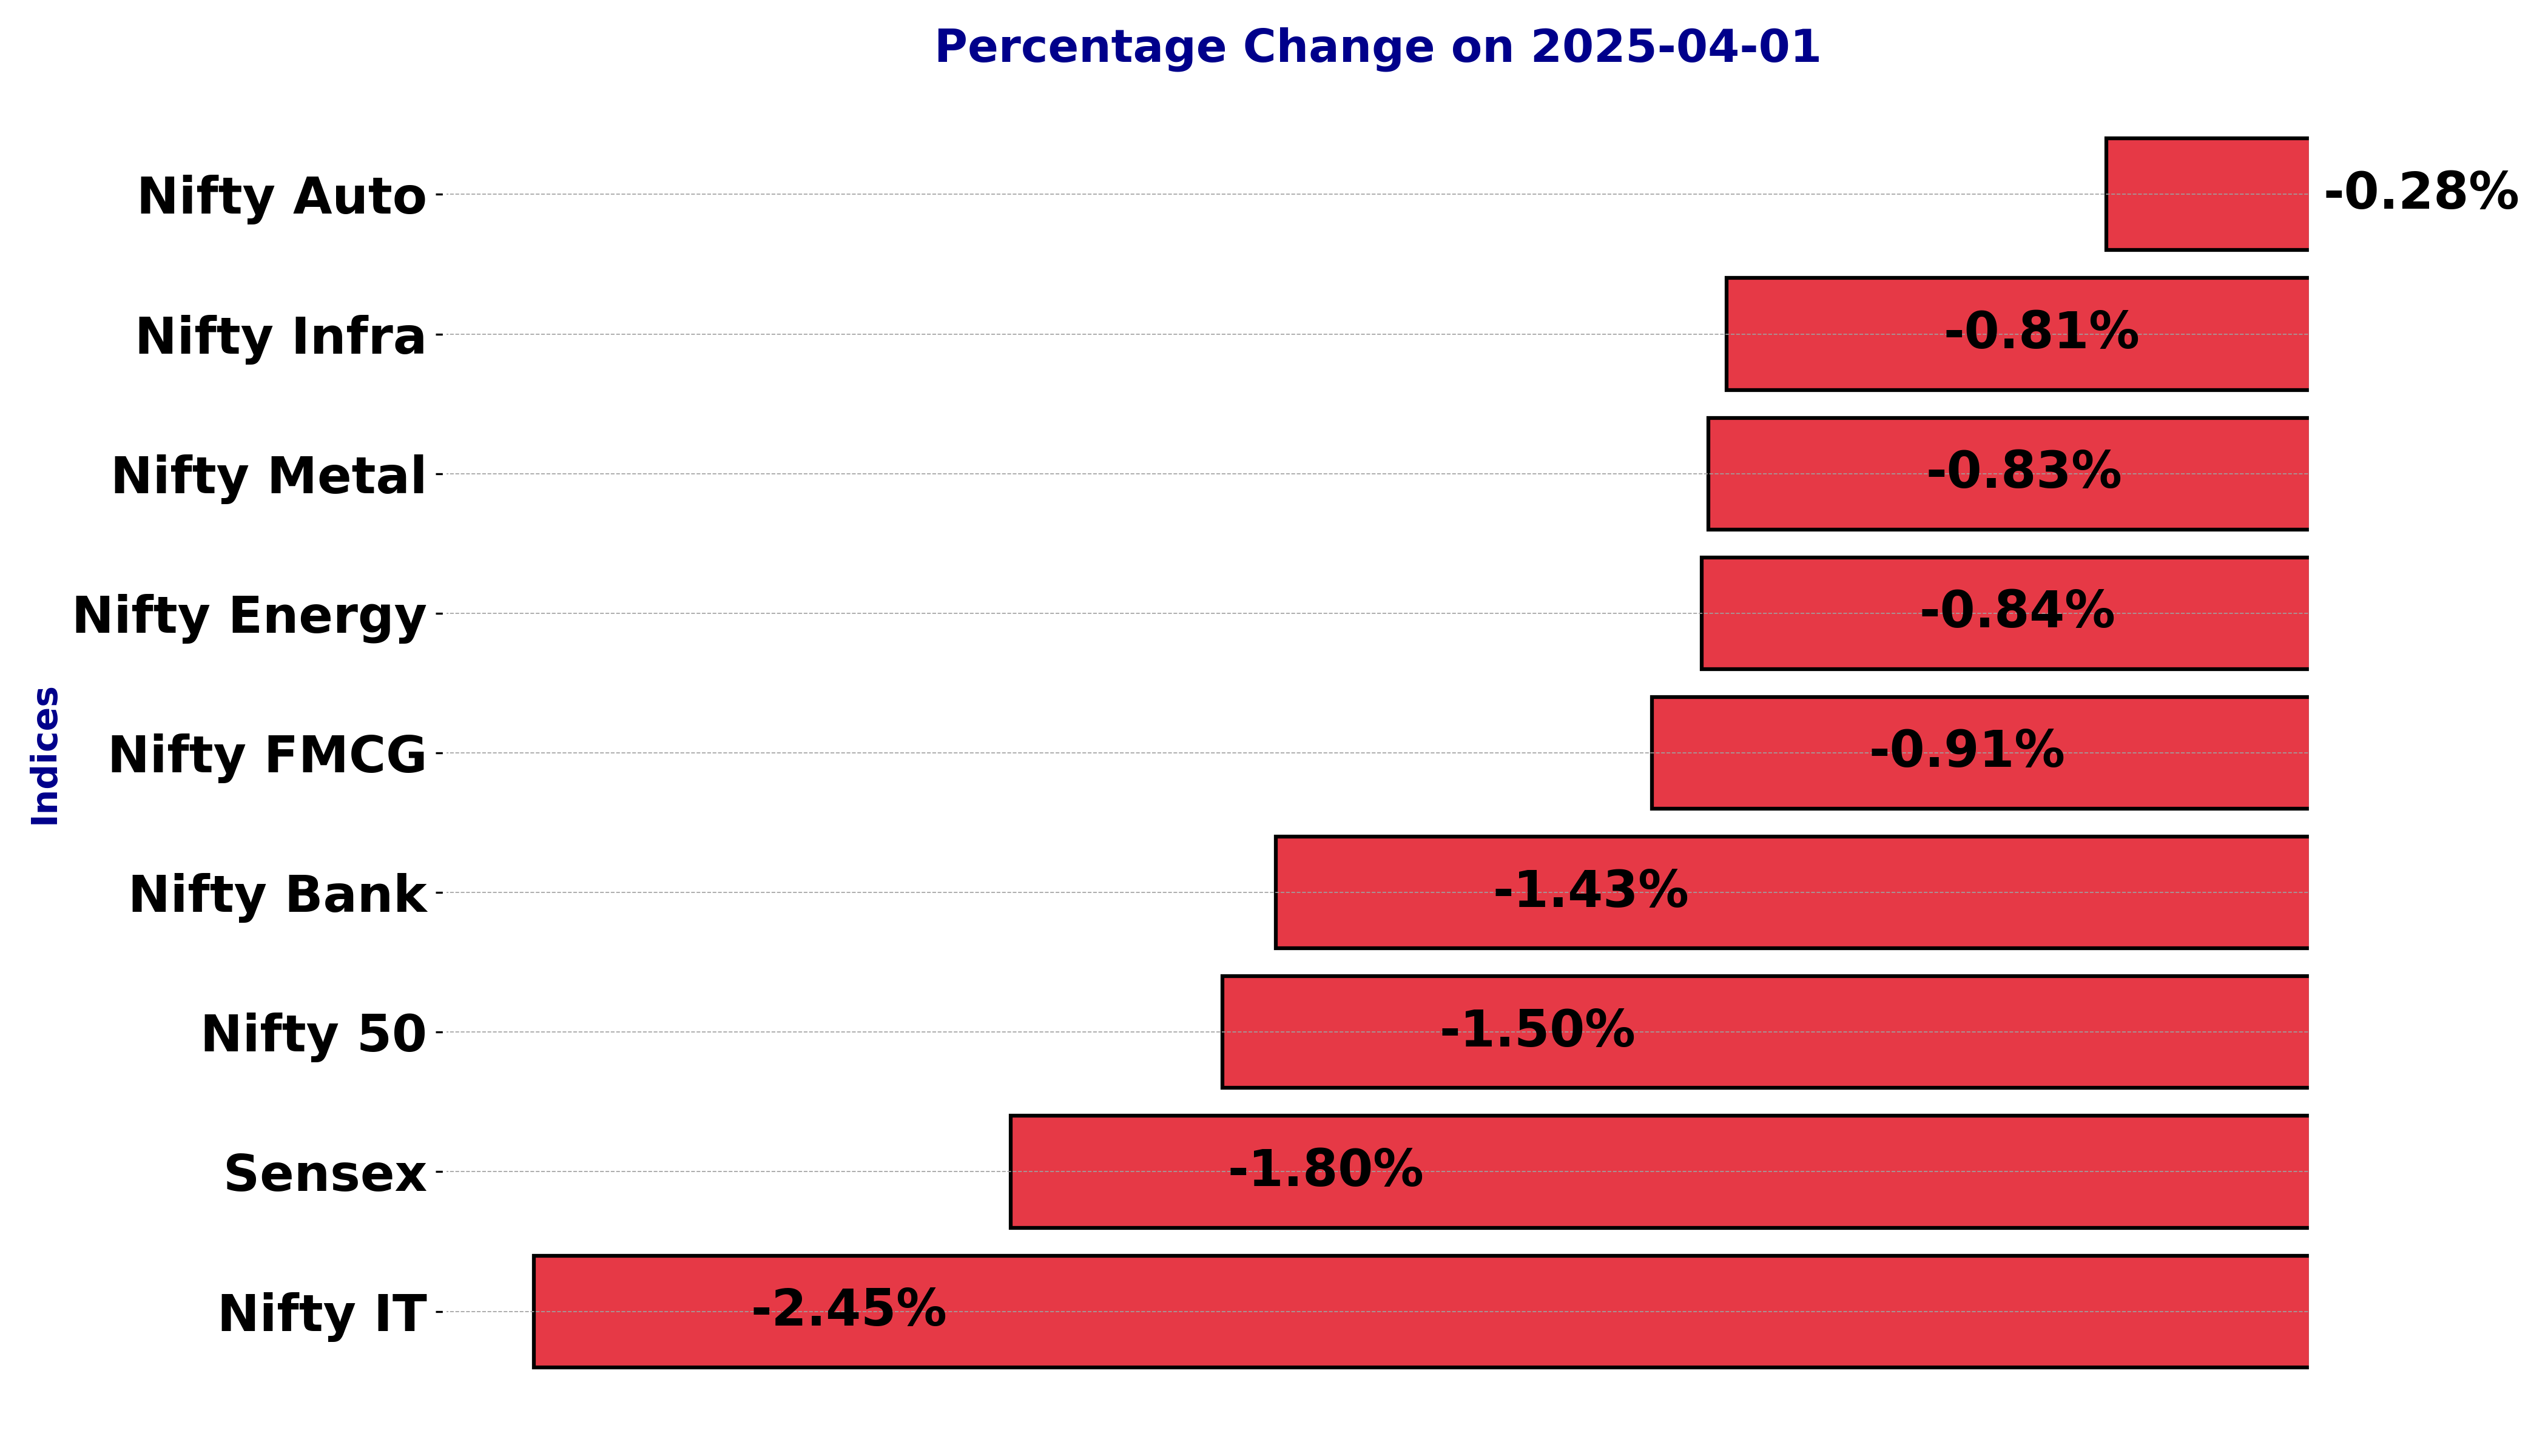
Among the indices, the Nifty IT sector experienced the steepest decline with a percentage change of -2.45%. This notable drop was characterized by a points change of -905.5.
Such a significant decrease in the Nifty IT can be attributed to a combination of factors, including potential investor concerns over global technological trends and cautious sentiments surrounding IT services demand, further compounded by financial outlook revisions from key companies within the index.
Following closely, the BSE Sensex saw a decrease of -1.80%, marking a points change of -1390.41. This movement reflects broader market sentiment concerns, possibly influenced by macroeconomic data releases or geopolitical tensions affecting investor confidence.
Similarly, the Nifty also faced a notable decline of -1.50%, with a points change of -353.65, indicating how these indices collectively impact the broader market perceptions.
In other sectors, the Nifty Bank index fell by -1.43% with a points change of -737.35. The declines in banking performance could suggest apprehensions over interest rate changes or sector-specific policy adjustments influencing investor outlooks.
Meanwhile, the Nifty FMCG reported a decrease of -0.91%, reflecting possible shifts in consumer spending patterns or cost pressures on fast-moving consumer goods.
The Nifty Energy index recorded a decrease of -0.84%, showcasing minor volatility, which could be tied to fluctuating energy prices or regulatory developments impacting energy companies.
Likewise, the Nifty Metal sector saw a decline of -0.83%, indicative of potential supply chain constraints or changes in global metal demand dynamics.
On a different scale, the Nifty Auto index and Nifty Infra index experienced smaller declines at -0.28% and -0.81% respectively. The modest losses in these sectors may be due to mixed industry reports or evolving market conditions affecting auto manufacturers and infrastructure projects.
Despite the widespread declines, the fluctuations in RSI, MACD, and EMA across these indices suggest underlying resilience and potential for recovery as market participants reassess the evolving financial and economic landscape.
The performance of these crucial sectors reflects investor sentiment and strategic adjustments in response to both localized and global market catalysts on that particular day.
Analysis for Sensex - April 01, 2025
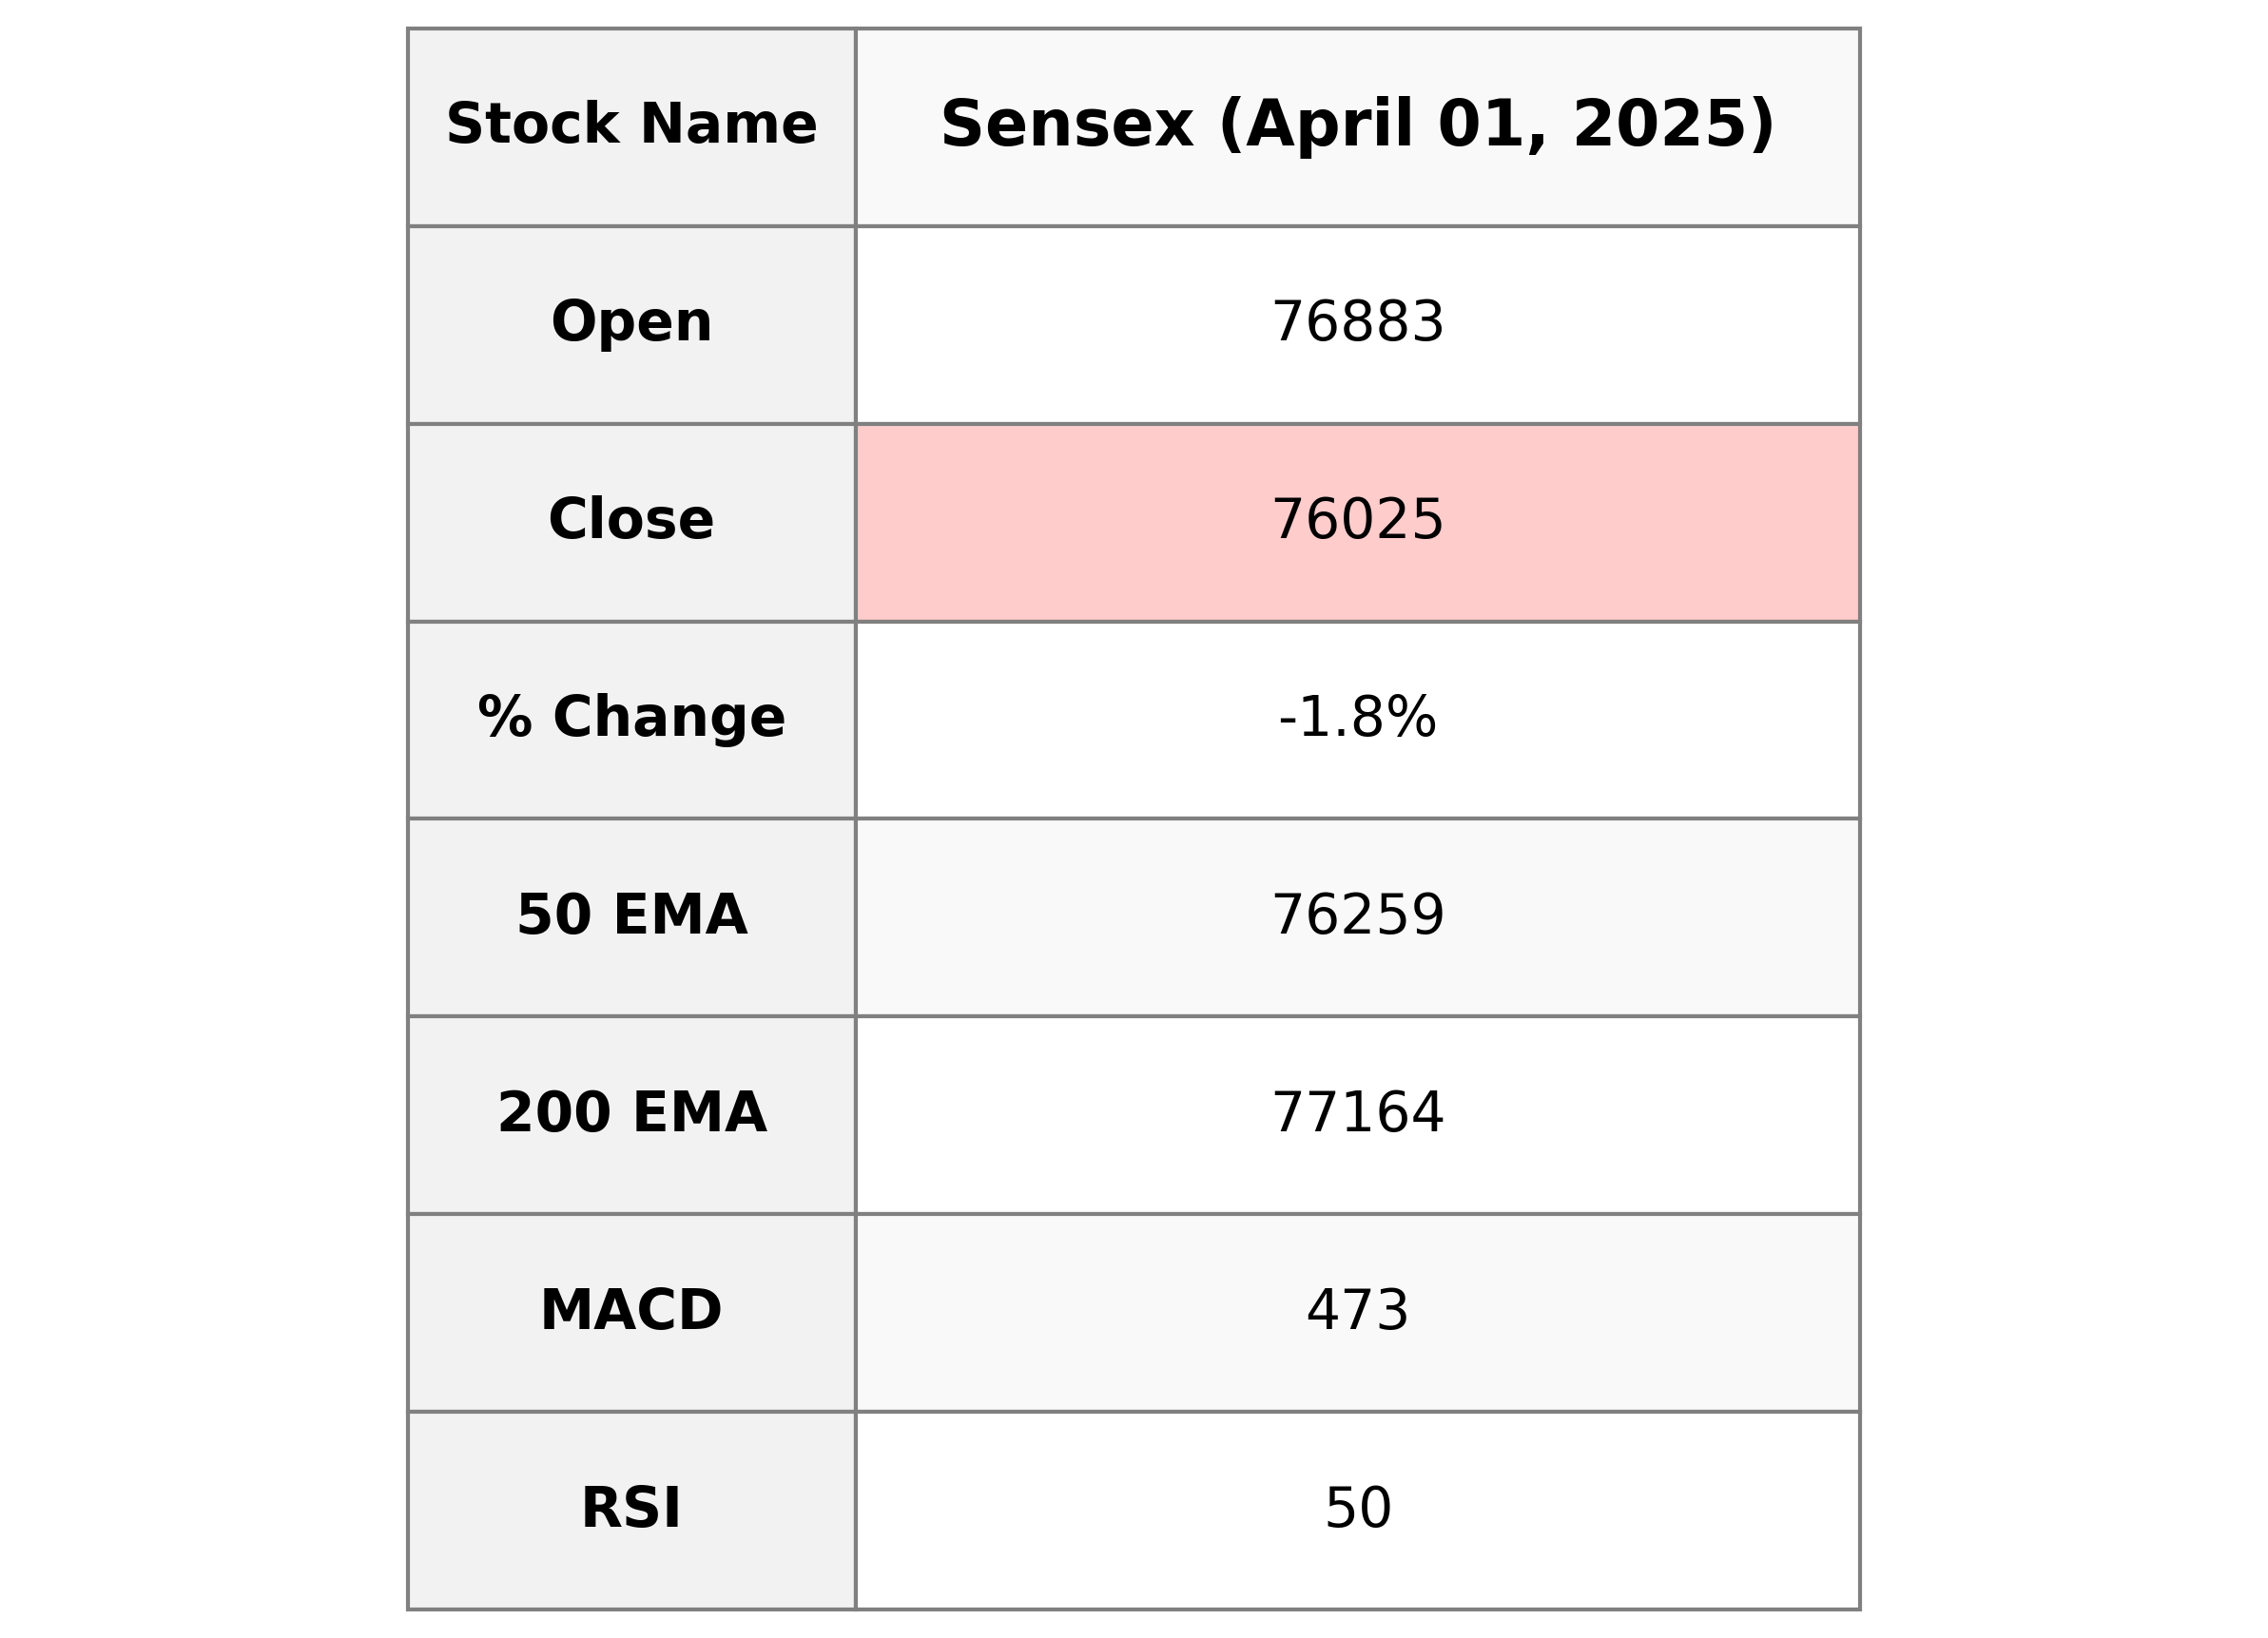
Sensex Performance: The Sensex opened at 76,882.58, reached a high of 77,487.05, and closed lower at 76,024.51. The index saw a decline of 1.80% from the previous close, with a points change of -1,390.41. The RSI indicates a neutral position at 50.33, while the MACD is positive but shows a divergence from the signal line, suggesting a possible slowing momentum.

Relationship with Key Moving Averages
The Sensex closed at 76,024.51, which is below its 50 EMA of 76,258.59 and significantly below its 200 EMA of 77,164.47. It is, however, slightly above its 20 EMA of 76,081.85 but below the 10 EMA of 76,607.63. Overall, the index appears to be in a short-term downtrend, especially as the close is below significant moving averages.
Moving Averages Trend (MACD)
The MACD for Sensex, calculated at 473.19 with a signal line value of 203.77, indicates a bullish trend as the MACD is above the signal line. However, investors should be cautious given the negative price movement and consider other indicators such as the recent % change of -1.80%.

RSI Analysis
The Relative Strength Index (RSI) for Sensex is at 50.33, which is approximately mid-range. This suggests that Sensex is neither in an overbought nor an oversold condition, indicating a potentially balanced market sentiment.

Analysis for Nifty Auto - April 01, 2025

Nifty Auto opened at 21,177.0 and closed at 21,235.25, showing a decrease of 0.28% from the previous close of 21,295.5, with a points change of -60.25. The Relative Strength Index (RSI) is at 45.37, indicating a potential bearish momentum. The Moving Average Convergence Divergence (MACD) is -67.13, which is above the MACD Signal of -150.16, suggesting a bearish trend may be losing strength.

Relationship with Key Moving Averages
The Nifty Auto index closed at 21235.25, which is below its 10-day EMA of 21412.16 and the 20-day EMA of 21403.97, indicating short-term bearish pressure. Additionally, the index is below the 50-day EMA of 21834.93 and the 200-day EMA of 22735.19, suggesting longer-term bearish momentum as well.
Moving Averages Trend (MACD)
Certainly! The Nifty Auto index shows a MACD of -67.13, which is below the MACD Signal of -150.16. This indicates a potential bullish crossover, suggesting that the downtrend might be weakening or a reversal could occur if the MACD crosses above the signal line.

RSI Analysis
The Relative Strength Index (RSI) for Nifty Auto is 45.37, which indicates that the stock is in a neutral zone but approaching the oversold territory (below 30). This suggests that the stock is not exhibiting strong momentum in either direction and could be at a potential pivot point.

Analysis for Nifty Energy - April 01, 2025

The Nifty Energy index opened at 33,381.20 and closed slightly lower at 33,289.15, marking a decrease of 0.84%. The day's trading saw a high of 33,790.35 and a low of 33,190.60. The key technical indicator, RSI, stands at 58.22, suggesting a neutral to slightly bullish momentum, supported by a MACD value of 461.86, well above the signal line.

Relationship with Key Moving Averages
The closing price of Nifty Energy at 33289.15 is above its 10-day EMA (33118.31) and 50-day EMA (32839.97), indicating a short to mid-term bullish trend. However, it remains below the 200-day EMA (35862.26), suggesting that it is in a longer-term bearish phase.
Moving Averages Trend (MACD)
Nifty Energy's MACD of 461.86 is significantly higher than the MACD Signal of 266.92, suggesting strong positive momentum. The positive difference indicates potential continued upward movement in the near term, as the MACD line is well above the signal line.

RSI Analysis
The RSI for Nifty Energy is 58.22, which suggests that the stock is in a neutral zone, neither overbought nor oversold. It indicates that the stock might be trading within its typical range and does not yet show signs of potential trend reversal.

Analysis for Nifty FMCG - April 01, 2025

The Nifty FMCG opened at 53,615.15 and closed slightly lower at 53,101.75, with a percentage change of -0.91%. The index experienced volatility, reaching a high of 54,029.90 and a low of 52,982.80. Despite a negative change in points of -488.05 from the previous close, the RSI indicates a balanced market sentiment at 52.78.

Relationship with Key Moving Averages
Nifty FMCG is currently trading below its 50-day EMA of 53589.15 and significantly below its 200-day EMA of 56214.13, indicating a bearish trend. However, it is slightly above the 10-day and 20-day EMAs, suggesting short-term recovery potential.
Moving Averages Trend (MACD)
The MACD for Nifty FMCG is positive at 26.47, while the MACD Signal is negative at -220.48, indicating a potential bullish divergence. This suggests that momentum might be shifting towards buying pressure, but the strength of this signal could be moderated by other market factors.

RSI Analysis
The RSI value for Nifty FMCG is 52.78, indicating that the stock is currently in a neutral zone. This suggests that the stock is neither overbought nor oversold, implying no significant immediate pressure on the price in either direction.

Analysis for Nifty Infra - April 01, 2025

Nifty Infra opened at 8415.15, reaching a high of 8527.20 and a low of 8371.55, before closing at 8389.5. It experienced a decrease of approximately 0.81%, with a points change of -68.30. The moving averages indicate a short-term trend above both the 50 EMA and 200 EMA, suggesting recent upward momentum. The RSI is at 61.30, indicating moderate strength in the current move.

Relationship with Key Moving Averages
The Nifty Infra index closed at 8389.5, which is above its 10 EMA of 8344.62, indicating short-term strength, but below the 50 EMA of 8205.66, and very close to the 200 EMA of 8404.42, suggesting a neutral to slightly bearish medium-term outlook. The negative change from the previous close contrasts with the index being mostly above the major moving averages, indicating potential volatility.
Moving Averages Trend (MACD)
The MACD for Nifty Infra is 116.18, which is above the MACD Signal of 69.70. This indicates a potential bullish momentum, suggesting that the stock may continue to rise in the near term.

RSI Analysis
The Relative Strength Index (RSI) for Nifty Infra is 61.30, which suggests that the stock is in a neutral to slightly overbought region. Typically, an RSI value between 30 and 70 indicates that the stock is neither overbought nor oversold. With the RSI leaning towards the upper part of this range, there might be a potential for a short-term pullback if the trend does not continue upward.

Analysis for Nifty IT - April 01, 2025

Nifty IT opened at 36422.85 and closed at 35980.65, experiencing a decline of 2.45% with a points change of -905.5. The RSI is at 33.14, indicating potential oversold conditions, while the MACD is -854.04, suggesting a bearish trend. The 50 EMA and 200 EMA are at 39226.34 and 40017.02, respectively, showing a downward momentum compared to shorter-term averages.

Relationship with Key Moving Averages
The Nifty IT index is currently trading below its key moving averages. Its close price of 35980.65 is below the 10 EMA of 36938.66, the 20 EMA of 37468.41, the 50 EMA of 39226.34, and the 200 EMA of 40017.02, indicating a bearish trend in the short to long term.
Moving Averages Trend (MACD)
The MACD for Nifty IT is at -854.04, with a MACD Signal of -1016.42. This suggests a bearish trend, as the MACD line is above the signal line and both values are negative, indicating weakening momentum in the price.

RSI Analysis
Nifty IT RSI Analysis: The Relative Strength Index (RSI) for Nifty IT is 33.14, which suggests the index is approaching oversold territory. This indicates potential buying interest, but caution is advised for further confirmation.

Analysis for Nifty Metal - April 01, 2025

Nifty Metal opened at 9015.85 and closed at 9016.85, showing a marginal decline with a change of -0.83% or a decrease of 75.65 points from the previous close of 9092.5. The Relative Strength Index (RSI) stands at 55.98, indicating a neutral momentum, while the Moving Average Convergence Divergence (MACD) is slightly below its signal line, suggesting a potential weakening trend.

Relationship with Key Moving Averages
Relationship with Key Moving Averages for Nifty Metal: Nifty Metal closed at 9016.85, which is above its 50 EMA of 8772.56 and 200 EMA of 8823.24, indicating a short-term bullish trend. However, it is below the 10 EMA of 9068.41, suggesting recent downward momentum.
Moving Averages Trend (MACD)
### MACD Analysis for Nifty Metal The MACD value of 164.44 is below the MACD Signal line of 171.17, indicating a bearish momentum. This suggests that the Nifty Metal index may experience further downward pressure. The RSI value is 55.98, which is relatively neutral, showing neither overbought nor oversold conditions.

RSI Analysis
The RSI value for Nifty Metal is 55.98, which is considered a neutral position, indicating that the stock is neither overbought nor oversold. This mid-range RSI suggests a balanced momentum, hinting at a potential continuation of the current trend unless disrupted by other factors.

Analysis for Nifty Bank - April 01, 2025

Nifty Bank opened at 51,178.15, reaching a high of 51,683.85 and a low of 50,742. It closed at 50,827.50, showing a decline of -1.43% from the previous close, with a points change of -737.35. The index's moving averages indicate a slightly bearish trend, with the 10 EMA at 50,716.42 and the 20 EMA at 50,091.20. The RSI is 59.81, suggesting moderately strong momentum, while the MACD indicates potential upward momentum.

Relationship with Key Moving Averages
Nifty Bank closed at 50,827.5, which is below its 50 EMA of 49,785.97 and 200 EMA of 49,995.36, indicating a potential downward trend. However, it remains above its 10 EMA of 50,716.42, suggesting short-term resistance. The 20 EMA stands at 50,091.20.
Moving Averages Trend (MACD)
Based on the given data for Nifty Bank, the MACD (640.62) is above the MACD Signal (381.65), indicating a bullish momentum. Despite the negative points change in the closing price, the positive MACD suggests potential upward movement if supported by other factors.

RSI Analysis
The RSI (Relative Strength Index) for Nifty Bank is 59.81, which suggests a moderately strong position but below overbought levels. Typically, a reading above 70 indicates overbought conditions, while below 30 indicates oversold conditions. Therefore, Nifty Bank is not currently in an overbought or oversold state.

Analysis for Nifty 50 - April 01, 2025

The Nifty 50 index opened at 23,341.10 and closed at 23,165.70, marking a decline of approximately 1.50% compared to the previous close of 23,519.35. The index experienced a points change of -353.65 and had a trading range with a high of 23,565.15 and a low of 23,136.40. The Relative Strength Index (RSI) stands at 53.02, indicating a moderately stable momentum.

Relationship with Key Moving Averages
The close price of Nifty 50 at 23165.6992 is above the 50 EMA of 23117.9015 and the 20 EMA of 23091.6974, indicating a positive short-term trend. However, it is below the 200 EMA of 23408.5882, suggesting a potential resistance in the longer-term trend. The close price is also below the 10 EMA of 23275.0229.
Moving Averages Trend (MACD)
{"Nifty 50": "The MACD value of 171.26 is above the MACD Signal of 82.99, which typically suggests a bullish trend. This indicates potential upward momentum for the index."}

RSI Analysis
The current RSI for Nifty 50 is 53.02, suggesting that the market is in a neutral state. An RSI near 50 typically indicates neither overbought nor oversold conditions, suggesting a balance between market buying and selling pressures.
