Indian stock market sector-wise performance today - March 11, 2025
The Indian stock market on Tuesday (March 11, 2025) exhibited a mixed performance with varied reactions across different indices.
Among the notable indices, Nifty IT witnessed a significant decline, falling by 0.65%, marking it as one of the largest losers. The sector saw a decrease in value as investors responded to economic variables and global cues impacting the technology sector.
The decline in Nifty IT, with a drop of 244.30 points, reflects ongoing concerns about growth rates and profit margins within the technology industry. RSI for Nifty IT has taken a dip to 28.03, potentially indicating oversold conditions.
Contrarily, indices such as Nifty Auto and Nifty FMCG experienced smaller losses with declines of 0.34% and 0.11%, respectively. Nifty Auto lost 70.15 points, while Nifty FMCG saw a reduction of 54.95 points.
The subtle drops suggest market participants are watching these sectors closely, perhaps holding back in anticipation of more concrete economic forecasts or policy shifts.
On a more positive note, Nifty Metal and Nifty Infrastructure showed resilience with slight gains. Nifty Metal gained 0.53%, translating to a rise of 47.00 points.
The strength in Nifty Metal could be attributed to speculations or developments regarding industrial demands or expansions in infrastructure projects.
In addition, Nifty Infrastructure advanced by 0.76%, with a gain of 60.05 points, underlining investor interest in infrastructure development and investment as a growth catalyst.
Nifty Energy also recorded an increase, growing by 0.51%, a reflection of fluctuations in commodity prices and energy needs that have positively impacted energy stocks.
For the flagship index, the Nifty 50, a modest increase was observed, with a rise of 0.17% or 37.60 points. This slight movement indicates a cautiously optimistic stance from investors, balancing gains and losses across sectors.
The banking index, Nifty Bank, however, registered a notable decrease of 0.75%, losing 362.85 points. Such movement in financial stocks may signal caution among investors regarding interest rate fluctuations or impending regulatory measures.
In summary, while certain sectors like Nifty IT faced a tough session due to altering economical and technological dynamics, sectors like Nifty Metal and Nifty Infrastructure contributed positively to the day's overall market performance.
The financial backdrop, geopolitical developments, and commodity price shifts heavily influenced these market movements, directing the flow of capital and investor sentiment across various sectors.

Analysis for Sensex - March 11, 2025

The Sensex opened at 73,743.88 and closed at 74,102.32, experiencing a slight drop with a percentage change of -0.017%. The RSI stands at 38.35, indicating a potentially oversold condition, while the MACD shows a negative value, suggesting bearish momentum. The trading volume was recorded as zero, which may affect the analysis.

Relationship with Key Moving Averages
The Sensex has closed at 74102.32, which is below its 10-day EMA of 74216.32, 50-day EMA of 76197.70, and 200-day EMA of 77290.41, indicating a short-term downtrend. The stock is also experiencing a negative MACD value, further emphasizing bearish momentum as reflected in the RSI of 38.35, which is below the neutral level of 50.
Moving Averages Trend (MACD)
Based on the MACD analysis for the Sensex, the current MACD value of -805.30 is below the MACD Signal line of -832.94. This indicates a weakening bearish momentum, suggesting that the downtrend might be slowing down. However, the negative value still signals caution.

RSI Analysis
Based on the provided data, Sensex's RSI is at 38.35, which indicates that it is approaching an oversold condition. Generally, an RSI below 30 is considered oversold, so the current RSI suggests slight bearish momentum but not yet reaching critical oversold levels.

Analysis for Nifty Auto - March 11, 2025

Nifty Auto closed at 20,682.65, marking a decrease of 0.34% from the previous close of 20,752.80, with a points change of -70.15. The Relative Strength Index (RSI) stands at 35.24, indicating potential bearish momentum. The sector seems to be underperforming, as suggested by the MACD value of -522.62 being below the MACD signal at -491.49.

Relationship with Key Moving Averages
The closing price of Nifty Auto is 20682.65, which is below the 50 EMA at 22145.96 and the 200 EMA at 22925.01, indicating a potential bearish trend. The 10 EMA at 20958.58 and the 20 EMA at 21366.74 are also above the current closing price, further supporting potential downward momentum.
Moving Averages Trend (MACD)
The MACD for Nifty Auto is currently at -522.62, while the MACD Signal is at -491.49. This indicates a bearish momentum, as the MACD line is below the signal line, suggesting the potential for continued downward movement.

RSI Analysis
The RSI for Nifty Auto is currently at 35.24, which suggests that the index is nearing the oversold territory. This indicates that the index might be undervalued and could potentially see a price correction or a bounce back in the near future if buying pressure increases. RSI values below 30 typically signal oversold conditions, while values above 70 indicate overbought conditions.

Analysis for Nifty Energy - March 11, 2025

Nifty Energy Performance: The Nifty Energy index opened at 31,023.90 and closed at 31,462.65, marking a positive change with a gain of 160.45 points, equivalent to a 0.51% increase. The index's momentum indicators show it is currently below both the 50-day and 200-day Exponential Moving Averages, with a Relative Strength Index (RSI) of 47.94, indicating neutral momentum.

Relationship with Key Moving Averages
The Nifty Energy index closed at 31,462.65, which is above its 10 EMA of 31,210.35 and 20 EMA of 31,403.26, indicating short-term bullish momentum. However, it is below the 50 EMA of 32,751.94 and the 200 EMA of 36,272.77, suggesting a longer-term bearish trend.
Moving Averages Trend (MACD)
The MACD for Nifty Energy is -418.66, indicating bearish momentum as it is below the signal line of -622.73. However, the MACD is approaching the signal line, suggesting potential weakening of the bearish trend.

RSI Analysis
RSI Analysis for Nifty Energy: The RSI (Relative Strength Index) for Nifty Energy is 47.94, indicating a neutral position. Being close to the midpoint (50), it suggests that the index isn't currently strongly overbought or oversold, implying a balanced momentum.

Analysis for Nifty FMCG - March 11, 2025

The Nifty FMCG index opened at 51,670.30 and closed slightly lower at 51,951.45, marking a decline of 0.11%. The index experienced a points change of -54.95, with the RSI at 39.61 suggesting weak momentum. The index's MACD is -905.09, below its signal line of -1044.40, indicating bearish sentiment.

Relationship with Key Moving Averages
Nifty FMCG closed at 51951.45, which is below its 50-day EMA of 54126.29 and 20-day EMA of 52444.77, but slightly above its 10-day EMA of 51836.05. This positioning indicates a short-term bearish trend as it remains under most of its key moving averages.
Moving Averages Trend (MACD)
Based on the MACD analysis, Nifty FMCG is currently experiencing a bearish trend. The MACD line at -905.09 is above the MACD Signal line at -1044.40, indicating a potential shift, but the negative values point to a continued downward momentum.

RSI Analysis
The RSI for Nifty FMCG is 39.61, which is below the neutral 50 level. This suggests that the index may be experiencing selling pressure, and is closer to being oversold, indicating potential downside momentum. However, it is not yet in the oversold territory, which typically starts below 30.

Analysis for Nifty Infra - March 11, 2025

Nifty Infra opened at 7898.70 and closed at 7989.60, reflecting a positive change of 0.757%. The index experienced a high of 8000.35 and a low of 7862.10. The RSI is at 49.59, indicating a nearly neutral momentum, while the MACD is at -73.73, and the signal line is at -103.67, showing a lessening negative momentum.
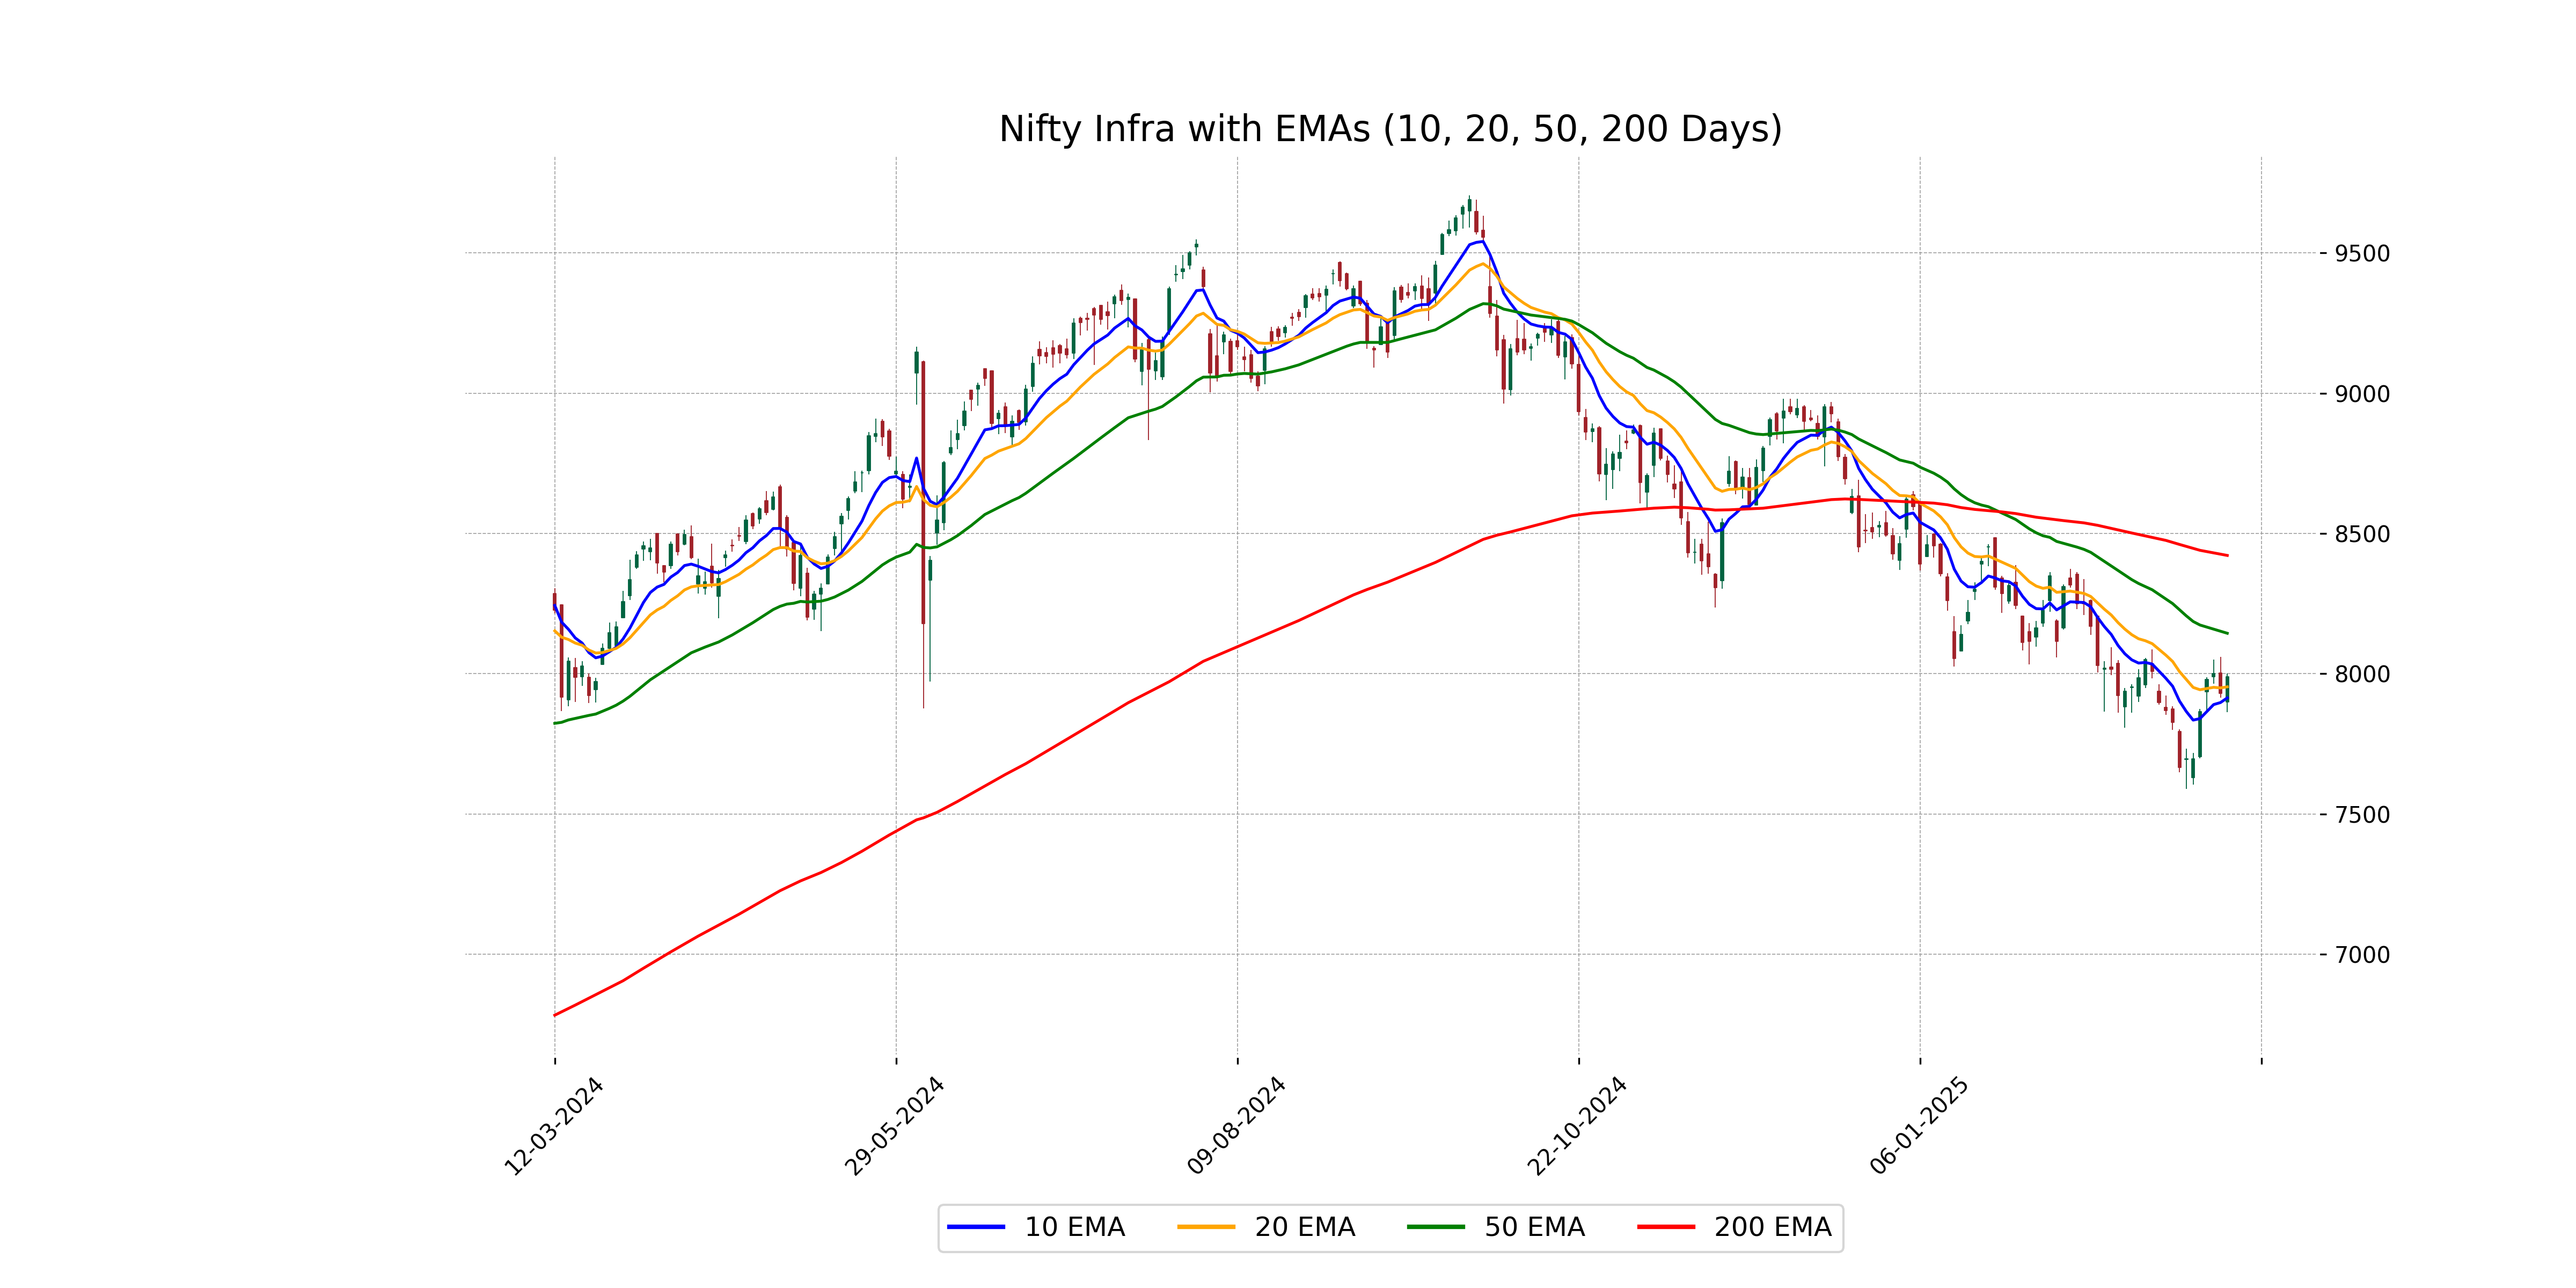
Relationship with Key Moving Averages
The Nifty Infra index closed at 7989.60, which is below its 50-day EMA of 8144.20 and 200-day EMA of 8421.60, suggesting a bearish trend in the short to mid-term. However, it is trading above its 10-day EMA of 7914.04 but below the 20-day EMA of 7953.33, indicating some short-term recovery potential.
Moving Averages Trend (MACD)
MACD Analysis: The MACD value for Nifty Infra stands at -73.73, which is above its MACD Signal of -103.67. This suggests a potential bullish momentum, as the MACD line is crossing above the signal line, indicating a possible trend reversal or upward movement in the near term.

RSI Analysis
Nifty Infra: The Relative Strength Index (RSI) for Nifty Infra is 49.59, which suggests that the index is currently in a neutral zone. An RSI value close to 50 indicates a balance between bullish and bearish momentum, without a clear trend direction. Monitoring further RSI movements or other indicators may provide more insights into impending price movement.

Analysis for Nifty IT - March 11, 2025

Nifty IT opened at 37185.25 and closed at 37400.10, reflecting a decline of 0.65% from the previous close. It experienced a notable downward movement with a points change of -244.30. The RSI indicates a bearish momentum with a value of 28.03, accompanied by negative MACD readings.

Relationship with Key Moving Averages
Nifty IT is currently trading below its key moving averages, with its close at 37,400.10. This is significantly lower than the 50-day EMA of 40,904.75, the 20-day EMA of 39,232.11, and slightly below the 10-day EMA of 38,207.20, indicating a bearish trend.
Moving Averages Trend (MACD)
MACD Analysis for Nifty IT: The MACD value of -1291.60, which is below the MACD signal line of -1177.07, indicates a bearish trend. This suggests downward momentum, and with an RSI of 28.03, Nifty IT may be considered oversold.

RSI Analysis
The RSI for Nifty IT is 28.03, indicating that it is in the oversold territory. This suggests potential buying interest as the index may be undervalued. However, one should consider other technical indicators and market conditions before making investment decisions.

Analysis for Nifty Metal - March 11, 2025

Nifty Metal opened at 8739.90 and closed at 8897.30, showing a percentage change of 0.53% with a points change of 47. The index traded between a low of 8715.15 and a high of 8915.85, indicating a modest upward movement. The RSI of 62.63 suggests mildly overbought conditions, while the MACD value of 108.44, compared to the Signal line at 36.00, indicates positive momentum.

Relationship with Key Moving Averages
The closing price of Nifty Metal at 8897.30 is above its 50 EMA of 8563.68 and 200 EMA of 8788.05, indicating a bullish trend. However, it is also above its 10 EMA (8671.38) and 20 EMA (8552.34), suggesting continued upward momentum.
Moving Averages Trend (MACD)
The MACD for Nifty Metal is 108.44, which is significantly above the MACD Signal line of 36.00, indicating a bullish trend. This suggests a potential for upward momentum in the stock price.

RSI Analysis
The RSI for Nifty Metal is 62.63, indicating that the stock is in a relatively strong position but not yet overbought. An RSI above 70 would suggest overbought conditions, while below 30 would indicate oversold conditions. In this case, Nifty Metal may still have room for upward movement without nearing overbought territory.

Analysis for Nifty Bank - March 11, 2025

Nifty Bank opened at 47,874.80 and closed at 47,853.95, showing a decrease of 0.75% with a points change of -362.85. The RSI is at 35.41, indicating potential oversold conditions, while the MACD suggests bearish momentum, as it is below the signal line.

Relationship with Key Moving Averages
The current close price of Nifty Bank is 47,853.95, which is below its 50-day EMA (49,383.40) and 200-day EMA (49,957.14), indicating a bearish trend. Additionally, it is also below the 10-day EMA (48,414.72) and 20-day EMA (48,708.30), suggesting short-term bearish momentum.
Moving Averages Trend (MACD)
MACD Analysis for Nifty Bank: The MACD value of -371.83, which is lower than the Signal line value of -319.21, suggests a bearish momentum in the current market trend for the Nifty Bank. Also, with the RSI at 35.41, the index is approaching oversold territory, indicating potential continued downward pressure.

RSI Analysis
RSI for Nifty Bank is 35.41, which indicates that it is approaching the oversold territory as it is below the typical RSI threshold of 30. This suggests that the stock might be undervalued and could potentially rebound if it reaches or goes below 30. However, further analysis and consideration of other indicators are recommended before making investment decisions.

Analysis for Nifty 50 - March 11, 2025

Nifty 50 Performance: The Nifty 50 index opened at 22,345.95 and closed at 22,497.90, marking a slight positive change of 0.17% from its previous close. Even though the index showed modest gains, it remains under its short-term and long-term exponential moving averages, with an RSI of approximately 40.97 indicating prevailing bearish momentum.

Relationship with Key Moving Averages
The Nifty 50 closed below its 50 EMA and 200 EMA, indicating potential bearish momentum, as it is also below the 20 EMA but slightly above its 10 EMA. The close price at 22497.90 suggests short-term weakness but slight improvement compared to the 22486.20 level of 10 EMA.
Moving Averages Trend (MACD)
MACD Analysis for Nifty 50: The MACD for Nifty 50 is -230.44, while the MACD Signal is -248.79, indicating that the MACD line is above the Signal line. This suggests a potential bullish crossover, although the MACD is still in the negative territory, indicating that the overall trend may still be bearish.

RSI Analysis
The RSI for Nifty 50 stands at 40.97, which suggests that the index is nearing the oversold territory, as RSI values below 30 typically indicate oversold conditions. This may point to potential buying opportunities if the index approaches or drops below the 30 threshold. Keep in mind that RSI is just one indicator and should be assessed in conjunction with other market factors.
