Indian stock market sector-wise performance today - March 19, 2025
The stock market on Wednesday (March 19, 2025) displayed a varied performance, with distinct percentage changes across key indices and sectors.
The BSE Sensex opened at 75,473.17 and closed at 75,449.05, demonstrating a minor increase of 0.20%, but gaining 147.79 points overall.
Meanwhile, the Nifty Auto sector saw a more significant uptick with a 0.40% rise, closing at 21,319.50, accumulating an 84.55 point increase from its previous close.
A notable highlight was the performance of the Nifty Energy sector, which experienced the most substantial gain among all sectors. It surged by 1.77%, closing at 32,735.05, marking a remarkable 569.55 point increase.
The day's market was further bolstered by the Nifty Infra index, which advanced by 1.47%, closing at 8,163.95 with an addition of 118.30 points. However, not all indices shared this upward momentum.
The Nifty FMCG sector faced a decline, falling by 0.55% and ending at 52,184.10, losing 290.90 points. Similarly, the Nifty IT index witnessed a significant drop of 1.08%, closing at 36,223.50 and shedding 395.85 points.
The robust performance of the Nifty Energy sector was pivotal in driving the market upwards. This increase can be attributed to a variety of factors, including positive sentiments surrounding energy stocks, potentially influenced by favorable government policies or market speculation on future energy demands.
Additionally, a recovery in global oil prices might have contributed to the optimism in the energy sector, which significantly affected market dynamics on this specific day.
Overall, the stock market illustrated mixed results with certain sectors like Energy and Infrastructure exhibiting notable gains, while others such as FMCG and IT sectors experienced declines.

Analysis for Sensex - March 19, 2025

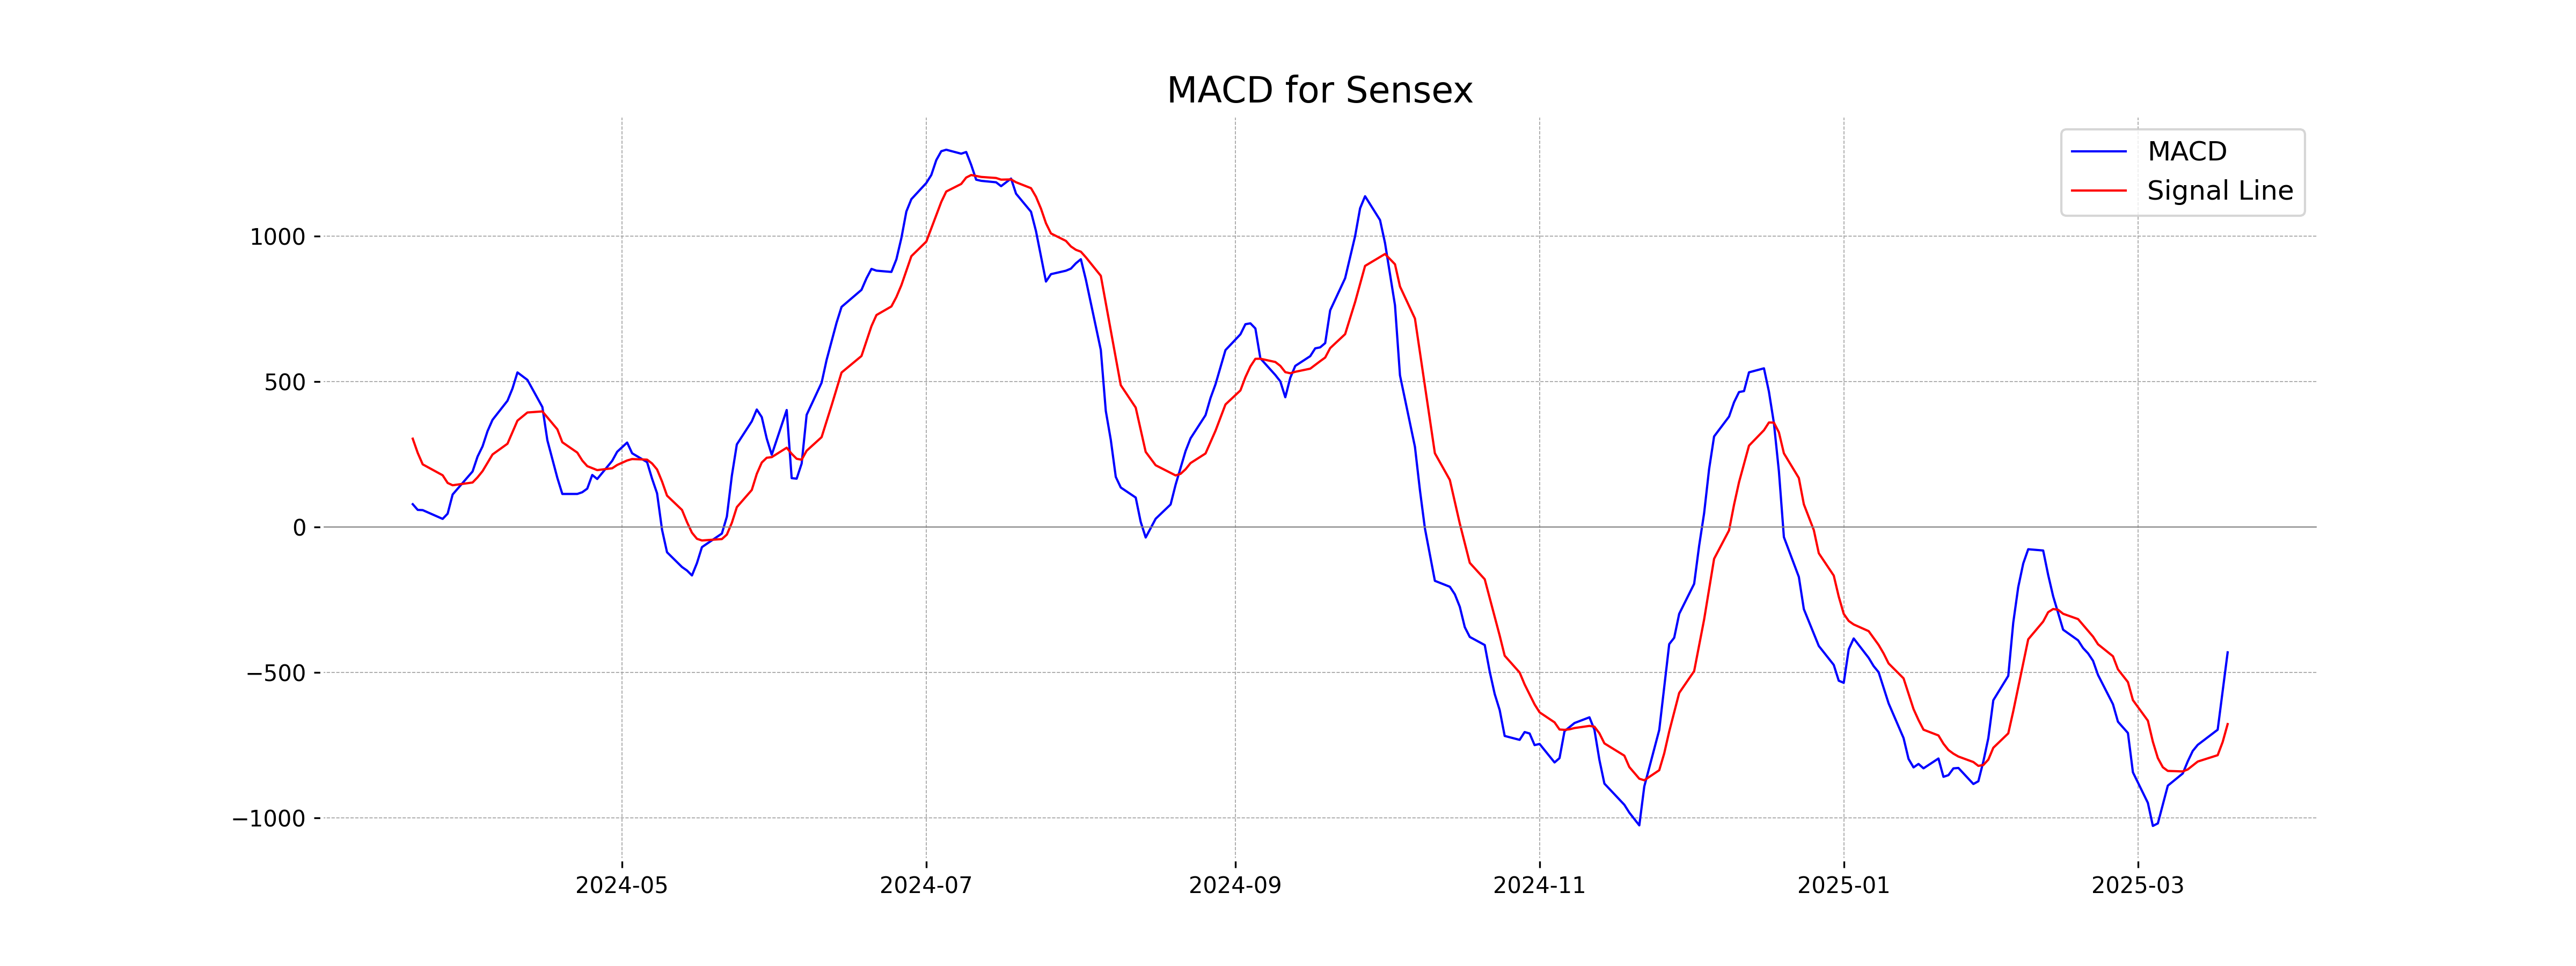
Sensex Performance: The Sensex opened at 75,473.17 and closed at 75,449.05, marking a slight increase from the previous close of 75,301.26 with a percentage change of 0.196%. The market saw a points change of 147.79, with the high reaching 75,568.38 and the low dipping to 75,201.48. The RSI indicates a moderately strong position at 54.58, and a MACD value of -430.39 suggests a negative trend compared to the signal line.

Relationship with Key Moving Averages
The closing price of Sensex at 75449.05 is below the 50 EMA (75906.33) and 200 EMA (77159.04), indicating a potential short-term bearish trend. However, it is above the 10 EMA (74542.42) and 20 EMA (74740.40), suggesting some short-term positivity.
Moving Averages Trend (MACD)
MACD Analysis for Sensex: The MACD value of -430.39 indicates a bearish trend as it is below the MACD Signal of -677.02. However, the MACD is moving upwards, suggesting potential bullish momentum building if it continues this trend.
RSI Analysis
The current RSI for Sensex is 54.58, which indicates a neutral position, suggesting that the index is neither overbought nor oversold. Generally, an RSI value between 30 and 70 reflects a balanced market without any extreme conditions.

Analysis for Nifty Auto - March 19, 2025

Nifty Auto opened at 21305.55 and closed slightly higher at 21319.5, marking a percentage change of 0.40% with a point increase of 84.55. The Relative Strength Index (RSI) is at 48.72, indicating a neutral market sentiment, while the MACD suggests a possible bearish momentum with a value of -359.25.

Relationship with Key Moving Averages
Based on the provided data, Nifty Auto closed at 21319.5, which is below its 50-day EMA of 21927.48 and 200-day EMA of 22828.45, indicating a potential bearish trend in the medium-to-long term. However, it is above the 10-day EMA of 20984.32 and the 20-day EMA of 21207.58, suggesting some short-term bullish momentum.
Moving Averages Trend (MACD)
Based on the data provided, Nifty Auto's MACD value is -359.26 while the MACD Signal is -454.47, indicating that the MACD line is above the signal line. This suggests a potential bullish signal, as the MACD is showing a trend towards a positive crossover. However, both values are negative, implying a cautious outlook might still be needed.

RSI Analysis
The RSI value for Nifty Auto is 48.72, which suggests a neutral momentum as it is close to the midpoint of 50. This value does not indicate any significant overbought or oversold conditions. Traders may interpret this as a time to wait for further signals before making decisions.

Analysis for Nifty Energy - March 19, 2025

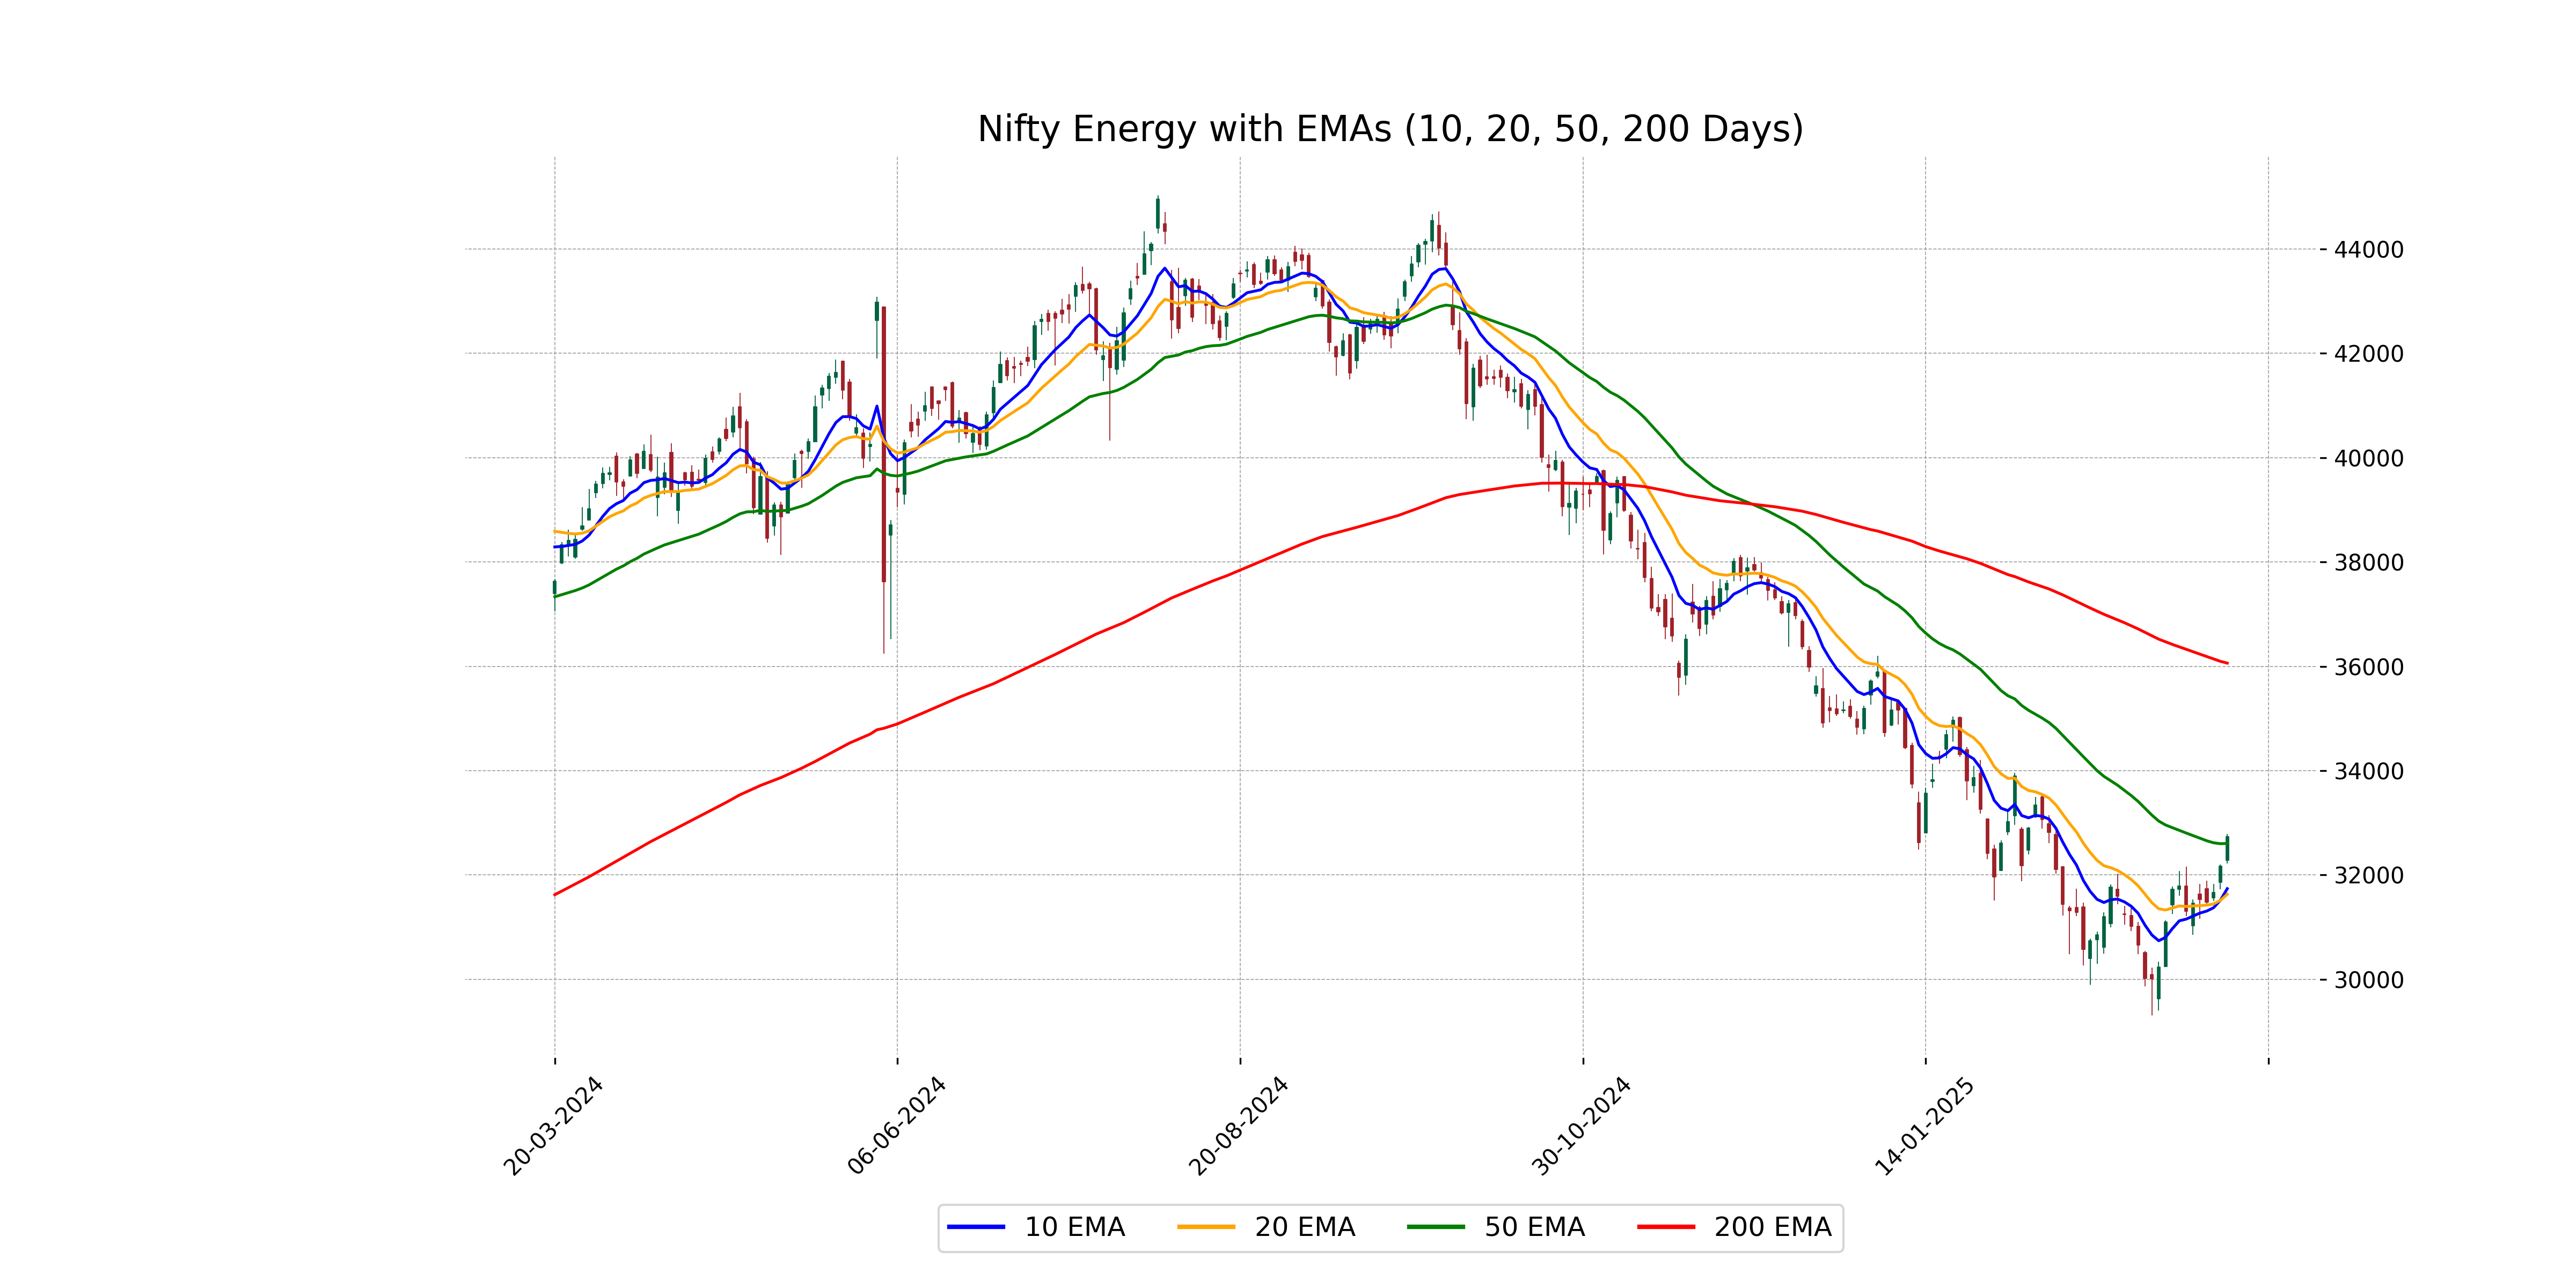
Nifty Energy Performance: On the reported trading day, Nifty Energy opened at 32,277.45 and closed higher at 32,735.05, marking a percentage increase of approximately 1.77%. The index experienced a high of 32,786.25 and a low of 32,216.10. The technical indicators show that the index is trading above its 50 EMA but below the 200 EMA, with an RSI of 60.17 indicating moderate momentum.
Relationship with Key Moving Averages
The Nifty Energy index closed above its 50-day EMA of 32,604.87, indicating short-term bullish momentum, while still below the 200-day EMA of 36,061.17, suggesting longer-term bearishness. The current close of 32,735.05 is also above the 10-day EMA and 20-day EMA, reinforcing short-term strength.
Moving Averages Trend (MACD)
MACD Analysis for Nifty Energy: The MACD for Nifty Energy is currently at -67.34 with a signal line at -342.66, which indicates that the MACD line is above the signal line. This suggests a bullish momentum as the MACD is moving towards zero from below, indicating a potential opportunity for bullish traders.

RSI Analysis
RSI Analysis for Nifty Energy: The RSI value for Nifty Energy is 60.17, which suggests that the stock is currently in a neutral to slightly bullish phase. This level indicates that the stock is not overbought or oversold, allowing room for potential upward movement if bullish momentum continues.

Analysis for Nifty FMCG - March 19, 2025

Nifty FMCG showed a decline in performance with a closing value of 52,184.10, dropping by 0.55% from the previous close and resulting in a negative points change of 290.90. The Relative Strength Index (RSI) is at 44.51, indicating weak momentum. Additionally, the MACD value of -570.88 is higher than the signal line, suggesting a potential shift in trend.

Relationship with Key Moving Averages
Nifty FMCG is currently trading below its 50-day EMA and 200-day EMA, indicating a bearish trend in the medium and long term. However, it is slightly above its 10-day EMA and close to its 20-day EMA, suggesting some short-term positive momentum despite recent overall weakness.
Moving Averages Trend (MACD)
The MACD value for Nifty FMCG is -570.88, which is above the MACD Signal of -799.76. This indicates a bullish crossover, suggesting a potential uptrend or a reduction in selling pressure. However, the overall RSI of 44.51 suggests the index is neither overbought nor oversold, indicating limited momentum in either direction.

RSI Analysis
The relative strength index (RSI) for Nifty FMCG is 44.51, indicating that the stock is in the neutral zone. It is neither overbought nor oversold, suggesting a balanced market sentiment at this point in time. Further monitoring might be required to detect upcoming trends.

Analysis for Nifty Infra - March 19, 2025

Nifty Infra opened at 8067.80 and closed at 8163.95, showing a positive change of 1.47% with a points increase of 118.30. The stock moved between a low of 8058.65 and a high of 8173.05. The RSI of 59.30 indicates a moderately bullish momentum.

Relationship with Key Moving Averages
Nifty Infra closed at 8163.95, which is above its 50-day EMA of 8121.73, indicating a short-term bullish sentiment. However, it's still below the 200-day EMA of 8402.14, suggesting a longer-term bearish trend.
Moving Averages Trend (MACD)
The MACD for Nifty Infra is showing a negative value of -18.56, indicating potential bearish momentum. However, since the MACD is above the MACD Signal line (-61.45), it may suggest some bullish divergence and possible trend reversal in the near future.

RSI Analysis
Nifty Infra's RSI value is 59.30, indicating a neutral but slightly bullish momentum as it approaches the overbought threshold of 70. This suggests that while the market isn't currently showing strong overbuy or oversell signals, further upward movement could inch it closer to an overbought condition.

Analysis for Nifty IT - March 19, 2025

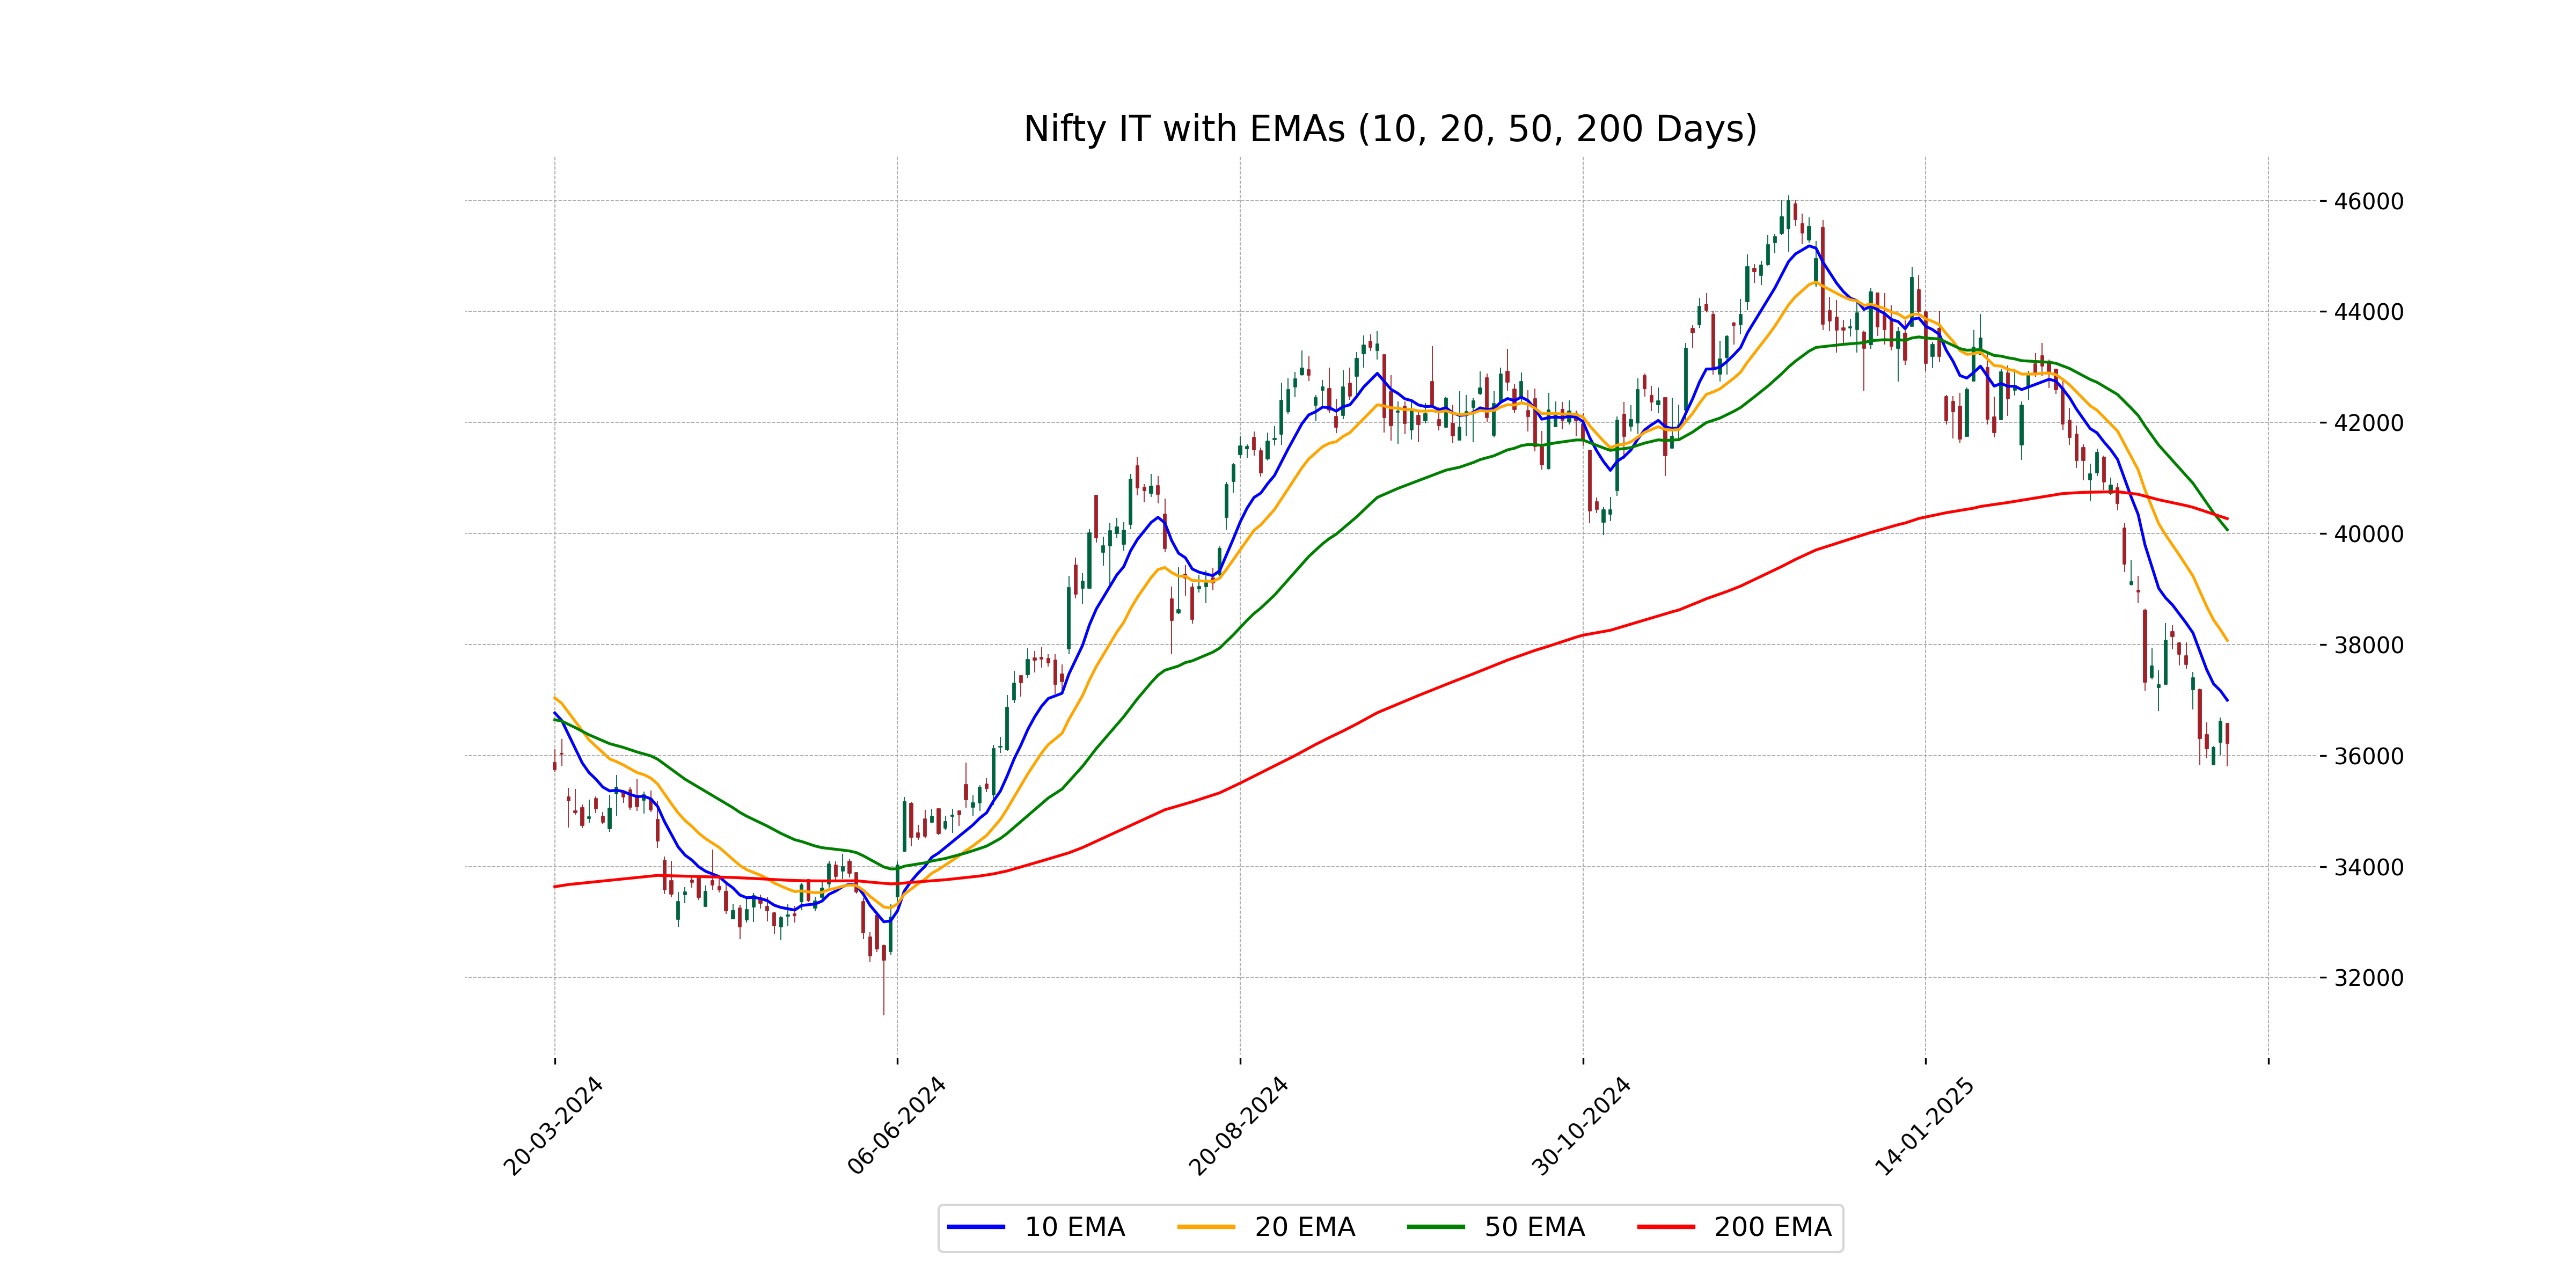
Based on the provided data, Nifty IT opened at 36581.65, reached a high of the same value, and closed at 36223.5, indicating a decline with a percentage change of approximately -1.08% from the previous close of 36619.35. The current RSI stands at 27.20, suggesting that the index is in oversold territory. Additionally, the MACD value is below its signal line, indicating bearish momentum.
Relationship with Key Moving Averages
Nifty IT closed below its 50-day and 200-day Exponential Moving Averages (EMA), indicating a bearish trend. The 10-day and 20-day EMAs are also below the long-term EMAs, reinforcing the weaker short-term momentum.
Moving Averages Trend (MACD)
MACD Analysis for Nifty IT: The MACD line is below the signal line, indicating a bearish trend. With a significant negative value of -1404.01, this suggests strong downward momentum. Additionally, the RSI value of 27.20 supports the bearish sentiment, indicating the asset is oversold.

RSI Analysis
Based on the provided data, the Relative Strength Index (RSI) for Nifty IT is at 27.20, indicating that the index is in the oversold territory. This suggests that the index has experienced significant selling pressure and may be due for a potential reversal or a period of consolidation. However, further analysis of market conditions and additional indicators is recommended before making trading decisions.

Analysis for Nifty Metal - March 19, 2025

Nifty Metal showed a positive performance with the index closing at 9148.55, representing a 1.27% increase from the previous close of 9033.45. The index experienced an intraday movement between a low of 9076.85 and a high of 9185.20. Notably, the Relative Strength Index (RSI) is at 67.30, indicating strong momentum, while the MACD indicates a bullish sentiment with a value of 159.13 against its signal line at 103.05.

Relationship with Key Moving Averages
The closing price of Nifty Metal is 9148.55, which is above the 50 EMA of 8631.66 and the 200 EMA of 8795.44, indicating a bullish trend. It is also above the 10 EMA of 8858.65 and the 20 EMA of 8708.57, confirming short-term upward momentum.
Moving Averages Trend (MACD)
Based on the data provided for Nifty Metal, the MACD is 159.13, which is above the MACD Signal of 103.05. This suggests a bullish momentum in the stock, indicating the potential for upward price movement. The MACD can be a signal for a buy if this bullish trend continues.

RSI Analysis
The RSI for Nifty Metal is 67.30, which suggests that the stock is approaching overbought territory. This indicates relative strength and potential further upward movement, but caution is advised as it nears the overbought threshold of 70.

Analysis for Nifty Bank - March 19, 2025

Nifty Bank Performance: Nifty Bank opened at 49,375.40 and closed at 49,702.60, showing a percentage change of 0.79% with an increase of 388.10 points. Despite trading between a low of 49,324.80 and a high of 49,807.55, the current close is above both the 50-day and 10-day exponential moving averages, indicating a positive short-term trend. With the RSI at 60.77, the index is in relatively strong momentum, and the MACD suggests a continuing bullish momentum given its negative value moving towards the signal line.

Relationship with Key Moving Averages
Nifty Bank closed at 49,702.60, which is above its 50-day EMA of 49,265.71 but below its 200-day EMA of 49,897.29. This suggests a short-term bullish momentum with some resistance in the longer term.
Moving Averages Trend (MACD)
Based on the given data, Nifty Bank shows a MACD of -135.40 with a signal line at -286.27. The MACD is below the signal line, indicating a bullish crossover has recently occurred which may suggest a potential uptrend continuation.

RSI Analysis
The RSI (Relative Strength Index) for Nifty Bank is 60.77, indicating that the stock is in a neutral or slightly overbought condition. Typically, an RSI above 70 suggests overbought conditions, while below 30 indicates oversold conditions. Current RSI levels suggest potential for a continued upward trend if supported by other indicators.

Analysis for Nifty 50 - March 19, 2025

The Nifty 50 showed a positive performance with a closing value of 22907.60 points, marking an increase of 73.30 points or 0.32% from the previous close of 22834.30 points. Despite the rise, the current value is below the 50-day EMA of 22991.09. The RSI of 56.03 indicates a neutral market momentum.

Relationship with Key Moving Averages
The closing price of Nifty 50 at 22907.60 is below the 50 EMA (22991.09) and the 200 EMA (23403.96), indicating potential bearish momentum in the longer term, but above the 10 EMA (22607.20) and the 20 EMA (22649.63), suggesting short-term bullishness.
Moving Averages Trend (MACD)
Based on the provided data, the MACD for Nifty 50 is -111.33, while the MACD Signal line is -191.93. Since the MACD is higher than the MACD Signal line, this indicates a potentially bullish signal, suggesting a possibility of upward momentum in the near term.

RSI Analysis
Nifty 50 RSI Analysis: The Relative Strength Index (RSI) for Nifty 50 is at 56.03, suggesting a neutral to slightly bullish momentum. An RSI value between 30 and 70 typically indicates that the stock is neither overbought nor oversold, thus indicating stability in the current trend.
