Top 5 Nifty 50 gainers today – April 4, 2025: Biggest stock moves
In this article, we will explore the technical indicators of some of the high-performing stocks on the Indian stock market, including APOLLOHOSP, BAJFINANCE, HDFCBANK, NESTLEIND, and TATACONSUM.
By looking at these stocks through the lens of key technical factors, we aim to better understand their price movements, trends, and potential future performance.

Analysis for Apollo Hospital - April 04, 2025

Apollo Hospital has shown a positive performance with a closing price of 6714.55, marking an increase of 0.65% from its previous close. The stock experienced a high of 6735.0 during the day with a notable trading volume of 279,886. It's part of the healthcare sector in India, and the technical indicators like RSI and MACD suggest a bullish momentum.

Relationship with Key Moving Averages
Apollo Hospital's current closing price of 6714.55 is above the 50-day EMA of 6538.41, the 200-day EMA of 6603.13, and the 10-day EMA of 6598.45, indicating a bullish trend as the stock is trading higher than these key moving averages.
Moving Averages Trend (MACD)
Apollo Hospital's MACD value of 80.36, which is significantly higher than the MACD Signal line at 33.93, suggests a bullish trend, indicating potential upward momentum in the stock's price.

RSI Analysis
Apollo Hospital has an RSI of 62.87, which indicates a moderately strong momentum and suggests that the stock is nearing overbought conditions. Typically, an RSI above 70 suggests overbought conditions, while below 30 indicates oversold conditions.

Analysis for Bajaj Finance - April 04, 2025

Bajaj Finance closed at 8718.85, marking a 1.45% increase from its previous close of 8594.60. The stock experienced strong investor interest, with a trading volume of 1,849,627 shares. With a positive RSI of 53.47, Bajaj Finance shows moderate momentum, and its MACD indicator signals a possible bullish trend despite its signal line being above the MACD line. The company's market cap stands at approximately ₹5.42 trillion, and it operates within the financial services sector.

Relationship with Key Moving Averages
Bajaj Finance closed at 8718.85, which is above its 50 EMA of 8368.29 and 200 EMA of 7584.73, indicating a potentially bullish trend. However, it is slightly below the 10 EMA of 8750.26, suggesting short-term caution might be needed.
Moving Averages Trend (MACD)
MACD Analysis for Bajaj Finance: The MACD value is 113.39 while the MACD Signal is 152.20, indicating that the stock is currently experiencing a bearish trend. The negative gap between the MACD and the Signal Line suggests potential continuation of this trend unless there is a bullish crossover in the near future.

RSI Analysis
The RSI (Relative Strength Index) of Bajaj Finance is 53.47, indicating a neutral trend and suggesting that the stock is neither overbought nor oversold. This implies a potential for price movement in either direction depending on market factors.

Analysis for HDFC Bank - April 04, 2025
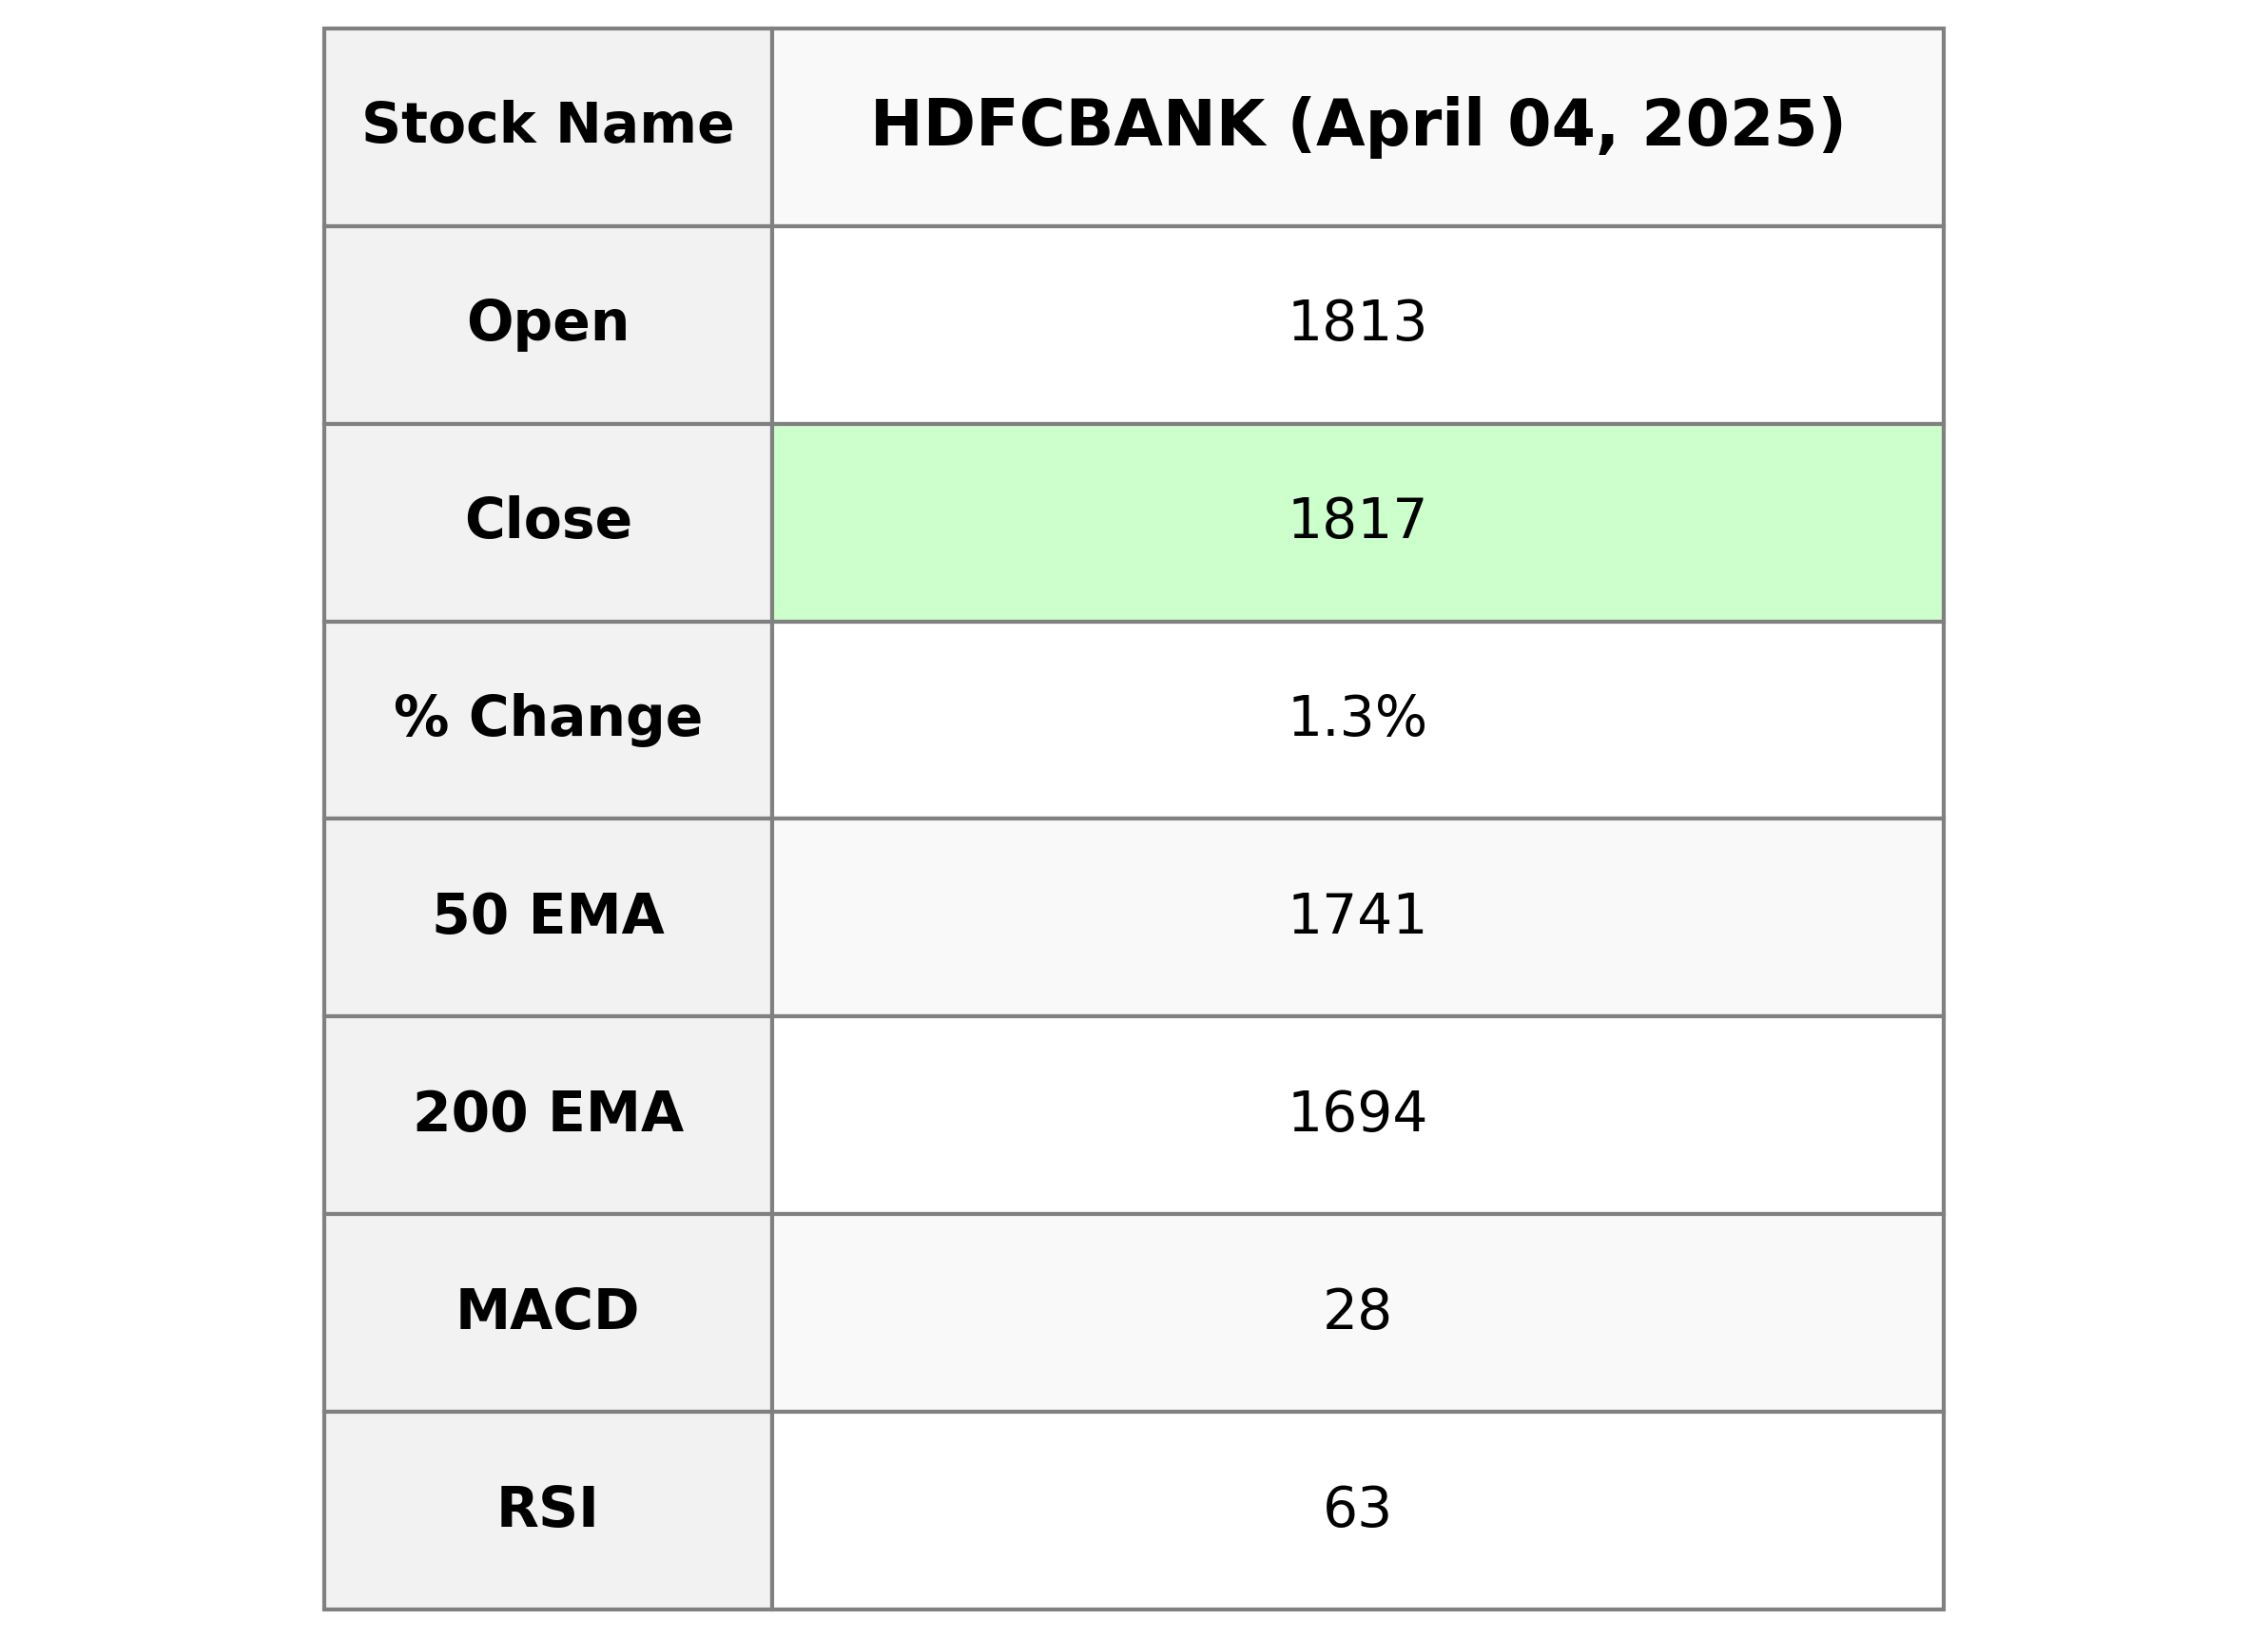
HDFC Bank Performance Summary: HDFC Bank's stock opened at 1813 and closed at 1817.30, showing a percent change of 1.25% with a points gain of 22.45. The stock exhibits a strong upward trend with an RSI of 62.97, indicating momentum, while trading above its 50, 20, and 10 EMAs, suggesting a bullish outlook. The market cap stands at approximately 13.91 trillion, with a PE ratio of 20.33 and an EPS of 89.38, reflecting its strong financial position in the Financial Services sector within the Banks - Regional industry in India.

Relationship with Key Moving Averages
HDFC Bank's current closing price of 1817.30 is above its 10 EMA of 1792.58, indicating short-term bullish sentiment. It also exceeds the 20 EMA, 50 EMA, and 200 EMA, which are at 1769.65, 1741.23, and 1694.25 respectively, signifying a strong positive trend across multiple time frames.
Moving Averages Trend (MACD)
HDFC Bank: The MACD for HDFC Bank is currently at 27.60, with the MACD Signal line at 23.98. This indicates a bullish trend, as the MACD line is above the signal line, suggesting potential upward momentum in the stock price.

RSI Analysis
The Relative Strength Index (RSI) for HDFC Bank is 62.97, which suggests that the stock is neither overbought nor oversold. Generally, RSI values above 70 indicate overbought conditions, while values below 30 indicate oversold conditions.

Analysis for Nestle - April 04, 2025

Nestle India Performance Summary: Nestle India experienced a modest daily gain with its stock closing at 2262.15, up from the previous close of 2245.65, indicating a percentage change of 0.73%. Trading volume was moderate, hinting at steady investor interest. The RSI of 56.83 suggests a relatively neutral momentum, while the company's strong market cap underlines its significance in the Consumer Defensive sector.

Relationship with Key Moving Averages
Nestle India's closing price of 2262.15 is above its 50 EMA of 2224.56 and 10 EMA of 2239.13 but below the 200 EMA of 2301.08, indicating an upward movement in the short to medium term. The MACD of 9.04 being above the MACD Signal of 6.71 supports this bullish momentum.
Moving Averages Trend (MACD)
MACD Analysis for Nestle India: The MACD (9.04) is above the Signal Line (6.71), indicating a bullish trend and potential upward momentum for the stock in the near term. Additionally, the positive MACD suggests strengthening investor sentiment.

RSI Analysis
RSI Analysis for Nestle: The Relative Strength Index (RSI) for Nestle is 56.83, which suggests that the stock is in a neutral zone. This indicates that it is neither overbought nor oversold, allowing for potential buying interest if upward momentum continues.

Analysis for Tata Consumer - April 04, 2025

Tata Consumer Performance: Tata Consumer has shown a positive performance with a closing price of 1087.85, reflecting a 1.57% increase compared to the previous close. This is supported by strong technical indicators, with the RSI at 76.36 indicating overbought conditions, and the MACD at 18.94 suggesting a bullish trend. The company operates in the Consumer Defensive sector, within the Packaged Foods industry in India.

Relationship with Key Moving Averages
The stock price of Tata Consumer closed at 1087.85, which is above its 50-day EMA of 987.97 and 200-day EMA of 1019.08, indicating a bullish trend. It is also higher than the 10-day EMA of 1020.11 and 20-day EMA of 998.90, reinforcing the upward momentum.
Moving Averages Trend (MACD)
### MACD Analysis for Tata Consumer The MACD for Tata Consumer is 18.94, significantly higher than the MACD Signal of 3.45, indicating a strong bullish momentum. This suggests that the stock is currently experiencing upward momentum with potential for further gains.

RSI Analysis
The RSI value for Tata Consumer is 76.36, which indicates that the stock is in overbought territory. This suggests that the stock may be overvalued in the short term and could be due for a price correction.
