Top 5 Nifty 50 gainers today – March 20, 2025: Biggest stock moves
In this article, we will explore the technical indicators of some of the high-performing stocks on the Indian stock market, including BAJAJ-AUTO, BHARTIARTL, BPCL, BRITANNIA, and TITAN.
By looking at these stocks through the lens of key technical factors, we aim to better understand their price movements, trends, and potential future performance.

Analysis for Bajaj Auto - March 20, 2025

Bajaj Auto Performance: Bajaj Auto's stock, listed as 'BAJAJ-AUTO.NS', showed a positive performance with a closing price of 7920.0, which is a rise of 2.57% from the previous close. The company operates in the Consumer Cyclical sector, specifically in the Auto Manufacturers industry, based in India. The RSI suggests a neutral momentum at 49.08, while the MACD indicates a bearish sentiment with a value of -240.07, although the recent price increase indicates some positive short-term momentum.

Relationship with Key Moving Averages
Bajaj Auto closed at 7920.0, which is above its 10 EMA of 7667.28 and 20 EMA of 7829.03, indicating a short-term bullish trend. However, it remains below the 50 EMA of 8263.24 and significantly under the 200 EMA of 8904.64, suggesting longer-term bearish pressures.
Moving Averages Trend (MACD)
Bajaj Auto: The MACD for Bajaj Auto is -240.07, indicating a bearish trend as it is below the MACD Signal line of -284.47. This suggests a potential for weakening momentum in the stock’s price movement.

RSI Analysis
The RSI (Relative Strength Index) for Bajaj Auto is 49.08, which is close to the midpoint of 50. This suggests that the stock is neither overbought nor oversold at the moment, indicating a relatively neutral trend. Investors might want to watch for a movement towards 70 or 30 to signal potential overbought or oversold conditions, respectively.

Analysis for Bharti Airtel - March 20, 2025

Bharti Airtel showed a significant performance with a closing price of 1705.25, exhibiting a 4.16% increase from its previous close of 1637.15. The stock displayed strong momentum with a high Relative Strength Index (RSI) of 62.22, indicating bullish sentiment in the market. The company operates in the Telecom Services industry within the Communication Services sector in India.

Relationship with Key Moving Averages
Bharti Airtel's closing price of 1705.25 is above both the 50-day EMA of 1635.89 and the 200-day EMA of 1540.61, indicating a bullish trend. Moreover, the closing price is also higher than the 10-day EMA of 1648.08 and the 20-day EMA of 1642.42, suggesting short-term strength in the company's stock.
Moving Averages Trend (MACD)
The MACD value for Bharti Airtel is 4.68, which is above its MACD Signal line at -1.16, indicating a bullish trend in the stock's momentum. This suggests that Bharti Airtel stock has potential upward momentum, as the MACD line has crossed above the signal line.

RSI Analysis
The Relative Strength Index (RSI) for Bharti Airtel is 62.22, which indicates that the stock is approaching overbought territory. Generally, an RSI above 70 suggests overbought conditions, while below 30 indicates oversold conditions. Therefore, current RSI suggests a moderate buying activity but not yet at the overbought level.

Analysis for BPCL - March 20, 2025

Certainly! Bharat Petroleum Corporation Limited (BPCL) showed a positive performance, with a closing price of 272.13, marking a 2.59% increase from the previous close. The trading volume was substantial with 10,784,715 shares exchanged, and technical indicators such as the RSI suggest bullish momentum as it stands at 61.68. The company's market capitalization is approximately 1,181 billion INR, with a PE ratio of 8.46 indicating it may be undervalued relative to earnings.

Relationship with Key Moving Averages
BPCL's current stock price of 272.13 is above its 50-Day EMA of 263.44 and 10-Day EMA of 263.00, indicating a short-term upward trend. However, it remains below the 200-Day EMA of 279.69, suggesting caution regarding a long-term reversal.
Moving Averages Trend (MACD)
MACD Analysis for BPCL: BPCL's MACD is at 2.30, with the MACD Signal line at 0.23. This indicates a bullish trend as the MACD line is above the signal line, suggesting upward momentum in the stock price.

RSI Analysis
BPCL's RSI is 61.68, which suggests that the stock is currently experiencing moderate momentum but is approaching overbought territory. An RSI value between 50 and 70 typically indicates positive momentum, but caution should be exercised as values approach 70.

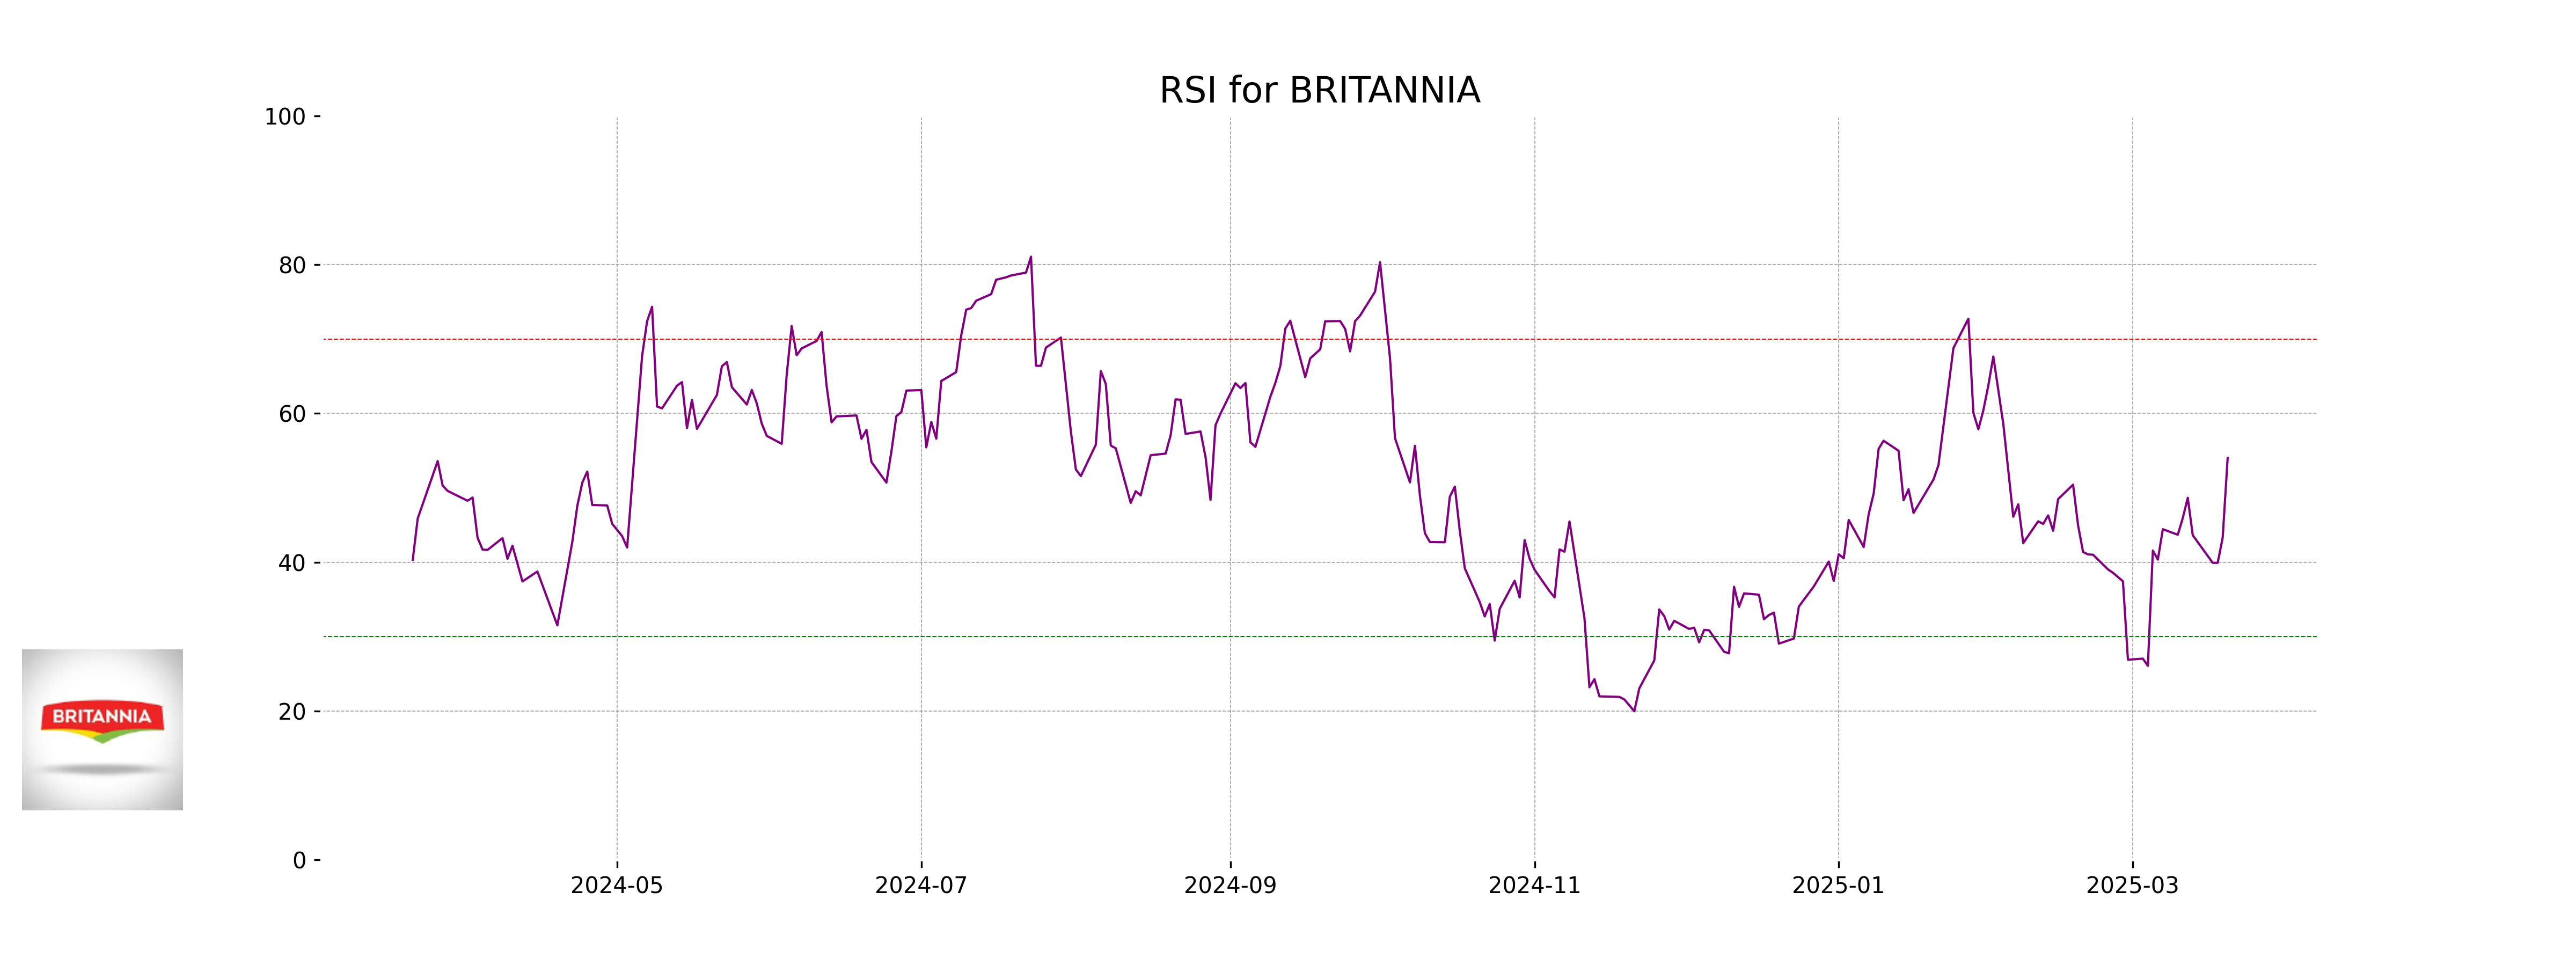
Analysis for Britannia - March 20, 2025

Britannia Performance Report The stock opened at 4741.90 and closed higher at 4831.10, reflecting a positive performance with a price change of 2.63% and an increase of 124 points. The stock witnessed a decent trading volume of 265,155 and marginally outperformed its 10 and 20 EMA but remained below the 50 and 200 EMA. The RSI indicates a moderate position at 54.02, suggesting neither overbought nor oversold conditions. Britannia operates within the Consumer Defensive sector, specifically in the Packaged Foods industry, and showcases a robust market cap of 1,166.8 billion with a PE ratio of 54.02.

Relationship with Key Moving Averages
Britannia's closing price of 4831.10 is below its 50-day EMA of 4848.47 and significantly below its 200-day EMA of 5114.09, indicating a potential downward trend relative to these moving averages. However, it is above the 10-day EMA of 4738.48 and the 20-day EMA of 4761.30, which suggests a short-term upward momentum.
Moving Averages Trend (MACD)
The MACD for Britannia is currently at -38.68, indicating a negative trend. However, since the MACD Signal is at -52.05 and the MACD line is higher, it suggests the potential for bullish momentum. Investors should monitor for a possible signal crossover to confirm a trend reversal.

RSI Analysis
Based on the provided data for Britannia, the RSI value is 54.02, which indicates a neutral market state. This suggests that the stock is neither overbought nor oversold at the moment, reflecting equilibrium in buying and selling pressures.
Analysis for Titan Company - March 20, 2025

Titan Company has shown a positive performance with a 3.80% increase in its stock price, closing at 3193.10. Despite being below its 50-EMA and 200-EMA, the stock moved up significantly from the previous close of 3076.30, indicating strong upward momentum, although it faces resistance as it is still below the 50-EMA and 200-EMA levels. The RSI value of 54.69 suggests the stock is neither overbought nor oversold, while the MACD is negative, reinforcing a cautious approach. Titan operates in the Consumer Cyclical sector, specifically in the Luxury Goods industry, and is a prominent Indian company with a high PE ratio of 87.22, reflecting growth expectations.

Relationship with Key Moving Averages
The current close price of Titan Company at 3193.10 is below its 50 EMA and 200 EMA, which are 3216.69 and 3348.01 respectively, indicating a potential bearish trend over a medium to long-term period. However, it is above the 10 EMA and 20 EMA, which suggests short-term upward momentum.
Moving Averages Trend (MACD)
The MACD for Titan Company is -56.92, with a MACD Signal of -71.83. Since the MACD is above its signal line, it indicates a potential bullish signal, suggesting possible upward momentum in the stock price. However, traders should consider other indicators and trends before making decisions.

RSI Analysis
Titan Company's RSI (Relative Strength Index) is 54.69, indicating that the stock is in a neutral zone as it is neither overbought nor oversold. This suggests that there could be room for the stock to move either higher or lower from its current position without hitting extreme conditions.
