Top 5 Nifty 50 gainers today – March 25, 2025: Biggest stock moves
In this article, we will explore the technical indicators of some of the high-performing stocks on the Indian stock market, including BAJAJFINSV, GRASIM, INFY, TRENT, and ULTRACEMCO.
By looking at these stocks through the lens of key technical factors, we aim to better understand their price movements, trends, and potential future performance.

Analysis for Bajaj Finserv - March 25, 2025

Bajaj Finserv exhibited a positive performance with a closing price of 1945.05, which is a 2.69% increase over the previous close of 1894.15. The stock saw a significant trading volume of 3,512,241 shares, and its performance is supported by a rising MACD and RSI, indicating potential bullish momentum. As a major player in the Financial Services sector, it maintains a robust market cap of 3,103,074,549,760 with a PE ratio of 36.54, reflecting its solid earnings potential in the Financial Conglomerates industry.

Relationship with Key Moving Averages
Bajaj Finserv's current stock price of 1945.05 is above the 50-day EMA of 1811.13 and the 200-day EMA of 1726.55, indicating an overall upward trend. Additionally, the price is also higher than the 10-day EMA of 1870.35 and the 20-day EMA of 1853.81, suggesting a short-term bullish momentum.
Moving Averages Trend (MACD)
Bajaj Finserv: The MACD value for Bajaj Finserv is 21.11, which is above the MACD Signal line of 15.90, indicating a bullish trend. This suggests that there might be a positive momentum in the stock's price movement.

RSI Analysis
The RSI value for Bajaj Finserv is 64.97, indicating a moderately strong momentum, suggesting the stock is nearing overbought conditions. However, it is still slightly below the typical overbought threshold of 70, implying that there may still be some room for upward movement before a potential reversal.

Analysis for Grasim Industries - March 25, 2025

Grasim Industries experienced a positive performance with a closing price of 2569.45, reflecting a 2.24% increase from its previous close. The company boasts a strong market capitalization of 1,686,651,273,216 INR and operates in the Basic Materials sector, specifically in Building Materials. Indicators like RSI at 69.33 suggest the stock is nearing overbought territory, and the MACD value of 18.50 indicates potential bullish momentum.

Relationship with Key Moving Averages
Grasim Industries' current close price of 2569.45 is above its 50-day EMA of 2449.49, indicating a positive short-term trend. The price is also above the 200-day EMA of 2480.67, suggesting a strong long-term outlook. Additionally, it's trading above the 10-day and 20-day EMAs, reinforcing the bullish sentiment.
Moving Averages Trend (MACD)
MACD Analysis for Grasim Industries: The MACD for Grasim Industries is currently at 18.50, which is significantly higher than the MACD Signal line at -1.41. This indicates a strong bullish momentum, suggesting the potential for continued upward movement in the stock price.

RSI Analysis
Based on the data for Grasim Industries, the RSI (Relative Strength Index) of 69.33 suggests that the stock is approaching overbought territory. This indicates that the stock has generally experienced upward momentum and could potentially be due for a reversal or consolidation if the RSI continues to rise above 70.

Analysis for Infosys - March 25, 2025

Infosys showed a positive performance with a close of 1628.45, reflecting a 2.24% increase from the previous close of 1592.75. The company's market capitalization is 6746.80 billion INR, with a PE ratio of 23.94. The RSI indicates a slightly oversold condition at 38.92, suggesting potential for further gains.

Relationship with Key Moving Averages
Infosys is trading below its 50-day and 200-day EMAs, with the current price of 1628.45 compared to the 50-day EMA of 1750.08 and the 200-day EMA of 1768.02, indicating a potential bearish trend. However, it is slightly above the 10-day EMA of 1620.05.
Moving Averages Trend (MACD)
Infosys is experiencing bearish momentum as indicated by the MACD being negative at -58.20. However, since the MACD line is above the MACD Signal line, this suggests that the downward momentum may be slowing down, which could potentially lead to a bullish divergence if trends continue similarly.

RSI Analysis
RSI Analysis for Infosys: The RSI (Relative Strength Index) for Infosys is currently at 38.92, which indicates that the stock is approaching the oversold territory. If the RSI continues to decrease and falls below 30, it could potentially signal a buying opportunity as it may be considered undervalued.

Analysis for Trent - March 25, 2025

Trent, operating in the Consumer Cyclical sector, specifically in Apparel Retail in India, saw a positive performance with a closing price of 5185.05, marking a 2.58% increase or a gain of 130.35 points from the previous close. Despite lagging behind its 50 and 200-day EMAs, the stock shows a stable RSI of 50.28, indicating a neutral momentum, with a Market Cap of approximately 1.84 trillion.

Relationship with Key Moving Averages
Trent's current close price of 5185.05 is below its 50-day EMA of 5436.45 and its 200-day EMA of 5765.35, indicating a short to medium-term downtrend. However, it is slightly above the 10-day EMA of 5119.71 and 20-day EMA of 5126.34, suggesting a possible short-term bullish momentum.
Moving Averages Trend (MACD)
Trent's MACD is at -56.18, indicating a slightly improving trend as it is converging towards the signal line, which is at -106.65. This suggests that while the stock has been experiencing some bearish momentum, it might be beginning to stabilize or reverse in the near term.

RSI Analysis
RSI Analysis for Trent: The Relative Strength Index (RSI) of 50.28 suggests that the stock is currently in a neutral position, indicating neither overbought nor oversold conditions. This level typically suggests potential stability or consolidation in the stock's price movement.

Analysis for UltraTech Cement - March 25, 2025

UltraTech Cement experienced a notable performance with a close at 11,421.20, marking a 3.35% increase from the previous close. The stock saw a high of 11,478.85 and a low of 11,204.70, with a significant trading volume of 754,436. The company, a key player in the Building Materials industry within the Basic Materials sector, holds a robust market cap and a PE ratio of 52.73, indicating strong investor interest and financial performance.
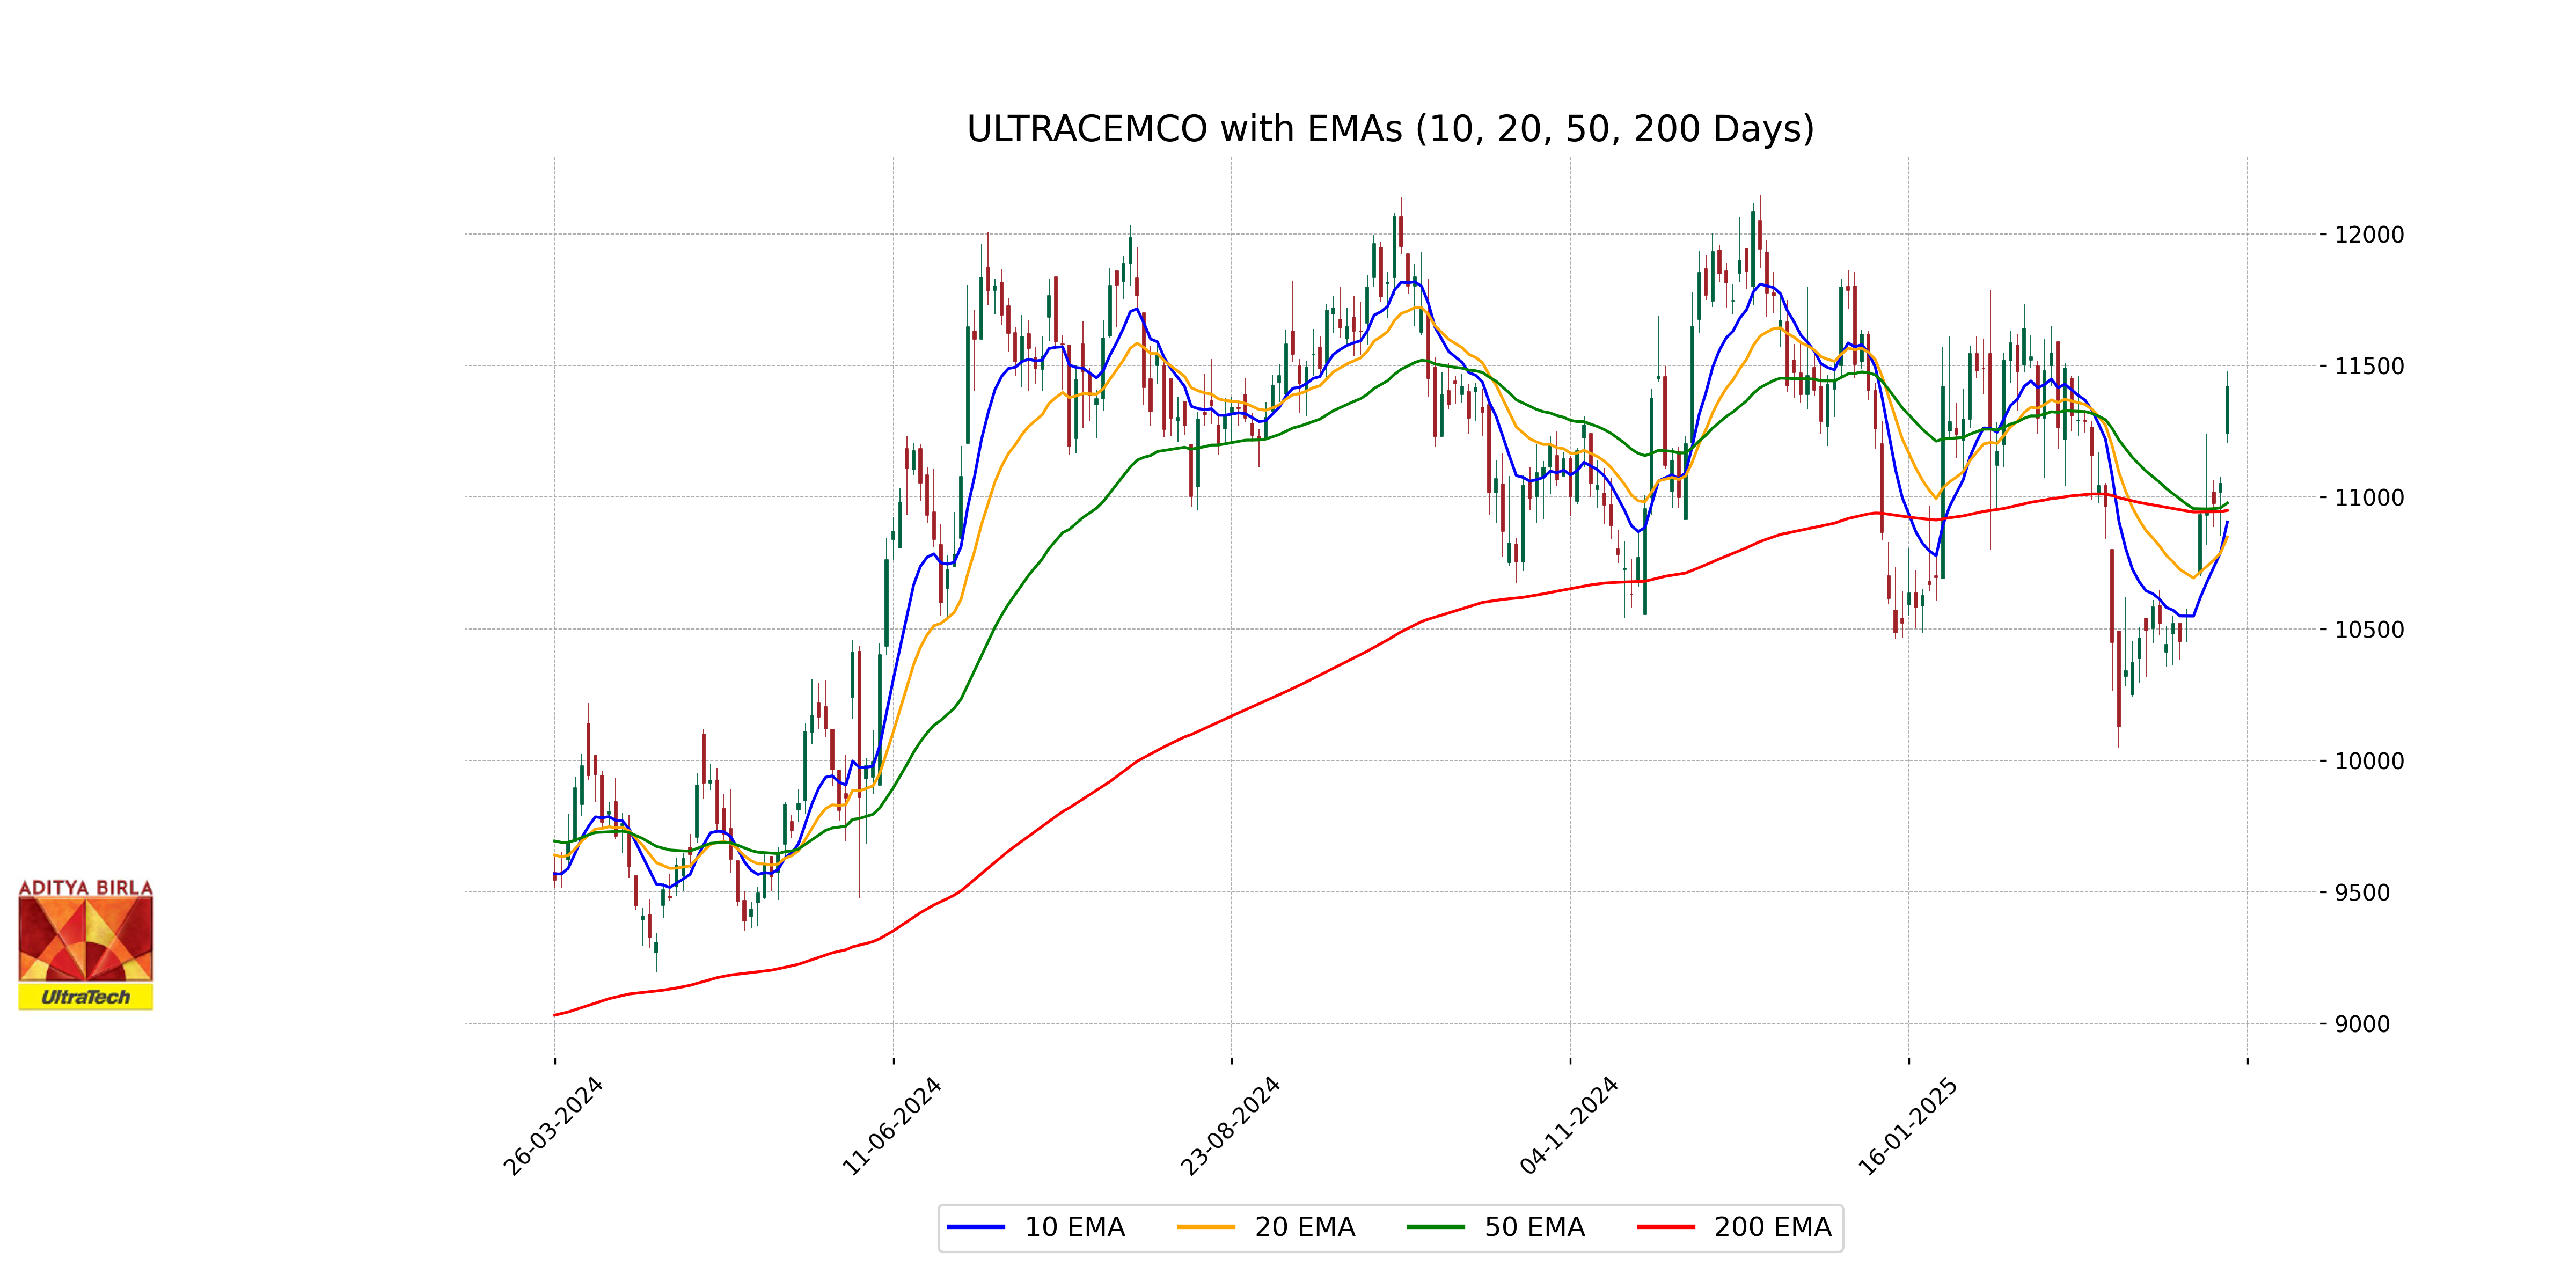
Relationship with Key Moving Averages
For UltraTech Cement, the current close price of 11421.2 is above its 50-day EMA of 10977.56, 200-day EMA of 10949.48, 10-day EMA of 10905.06, and 20-day EMA of 10848.45, indicating a strong upwards movement relative to these averages. This suggests a bullish trend with the stock trading above key moving averages.
Moving Averages Trend (MACD)
MACD Analysis for UltraTech Cement: The current MACD value is 5.66, which is above the MACD Signal of -107.28, indicating a potential bullish trend. This suggests that the stock might have upward momentum, with its RSI at 65.63, nearing the overbought territory.

RSI Analysis
The RSI for UltraTech Cement is 65.63, which suggests that the stock is approaching an overbought condition, as RSI levels above 70 typically indicate that. This could imply a potential price correction or consolidation in the near term, but it is not yet in the overbought zone.
