Top 5 Nifty 50 gainers today – March 27, 2025: Biggest stock moves
In this article, we will explore the technical indicators of some of the high-performing stocks on the Indian stock market, including ADANIENT, BAJAJFINSV, HDFCLIFE, HEROMOTOCO, and INDUSINDBK.
By looking at these stocks through the lens of key technical factors, we aim to better understand their price movements, trends, and potential future performance.

Analysis for Adani Enterprises - March 27, 2025

Adani Enterprises had a positive market performance with a closing price of 2363.35, reflecting a 2.19% increase from its previous close. The stock's trading volume was 1,693,656 shares, and it showed a strong relative strength index (RSI) of 61.21. Its financial metrics include a market cap of 2,727,731,265,536 INR, a PE ratio of 79.23, and an EPS of 29.83, indicating a robust standing in the energy sector, specifically in thermal coal.

Relationship with Key Moving Averages
Adani Enterprises closed at 2363.35, which is above its 50-day EMA of 2303.94 and its 10-day EMA of 2313.90, indicating a short-term upward trend. However, it remains below its 200-day EMA of 2597.67, suggesting a longer-term bearish trend.
Moving Averages Trend (MACD)
The MACD for Adani Enterprises is 27.55 with a signal line of 11.70, indicating a bullish trend as the MACD line is above the signal line. This suggests potential upward momentum in the stock price.

RSI Analysis
The RSI for Adani Enterprises is 61.21, indicating that it is in neutral territory and not currently overbought or oversold. A value above 70 generally suggests overbought conditions, while below 30 indicates oversold conditions. This neutral position may suggest a period of consolidation or stability in the stock price.

Analysis for Bajaj Finserv - March 27, 2025
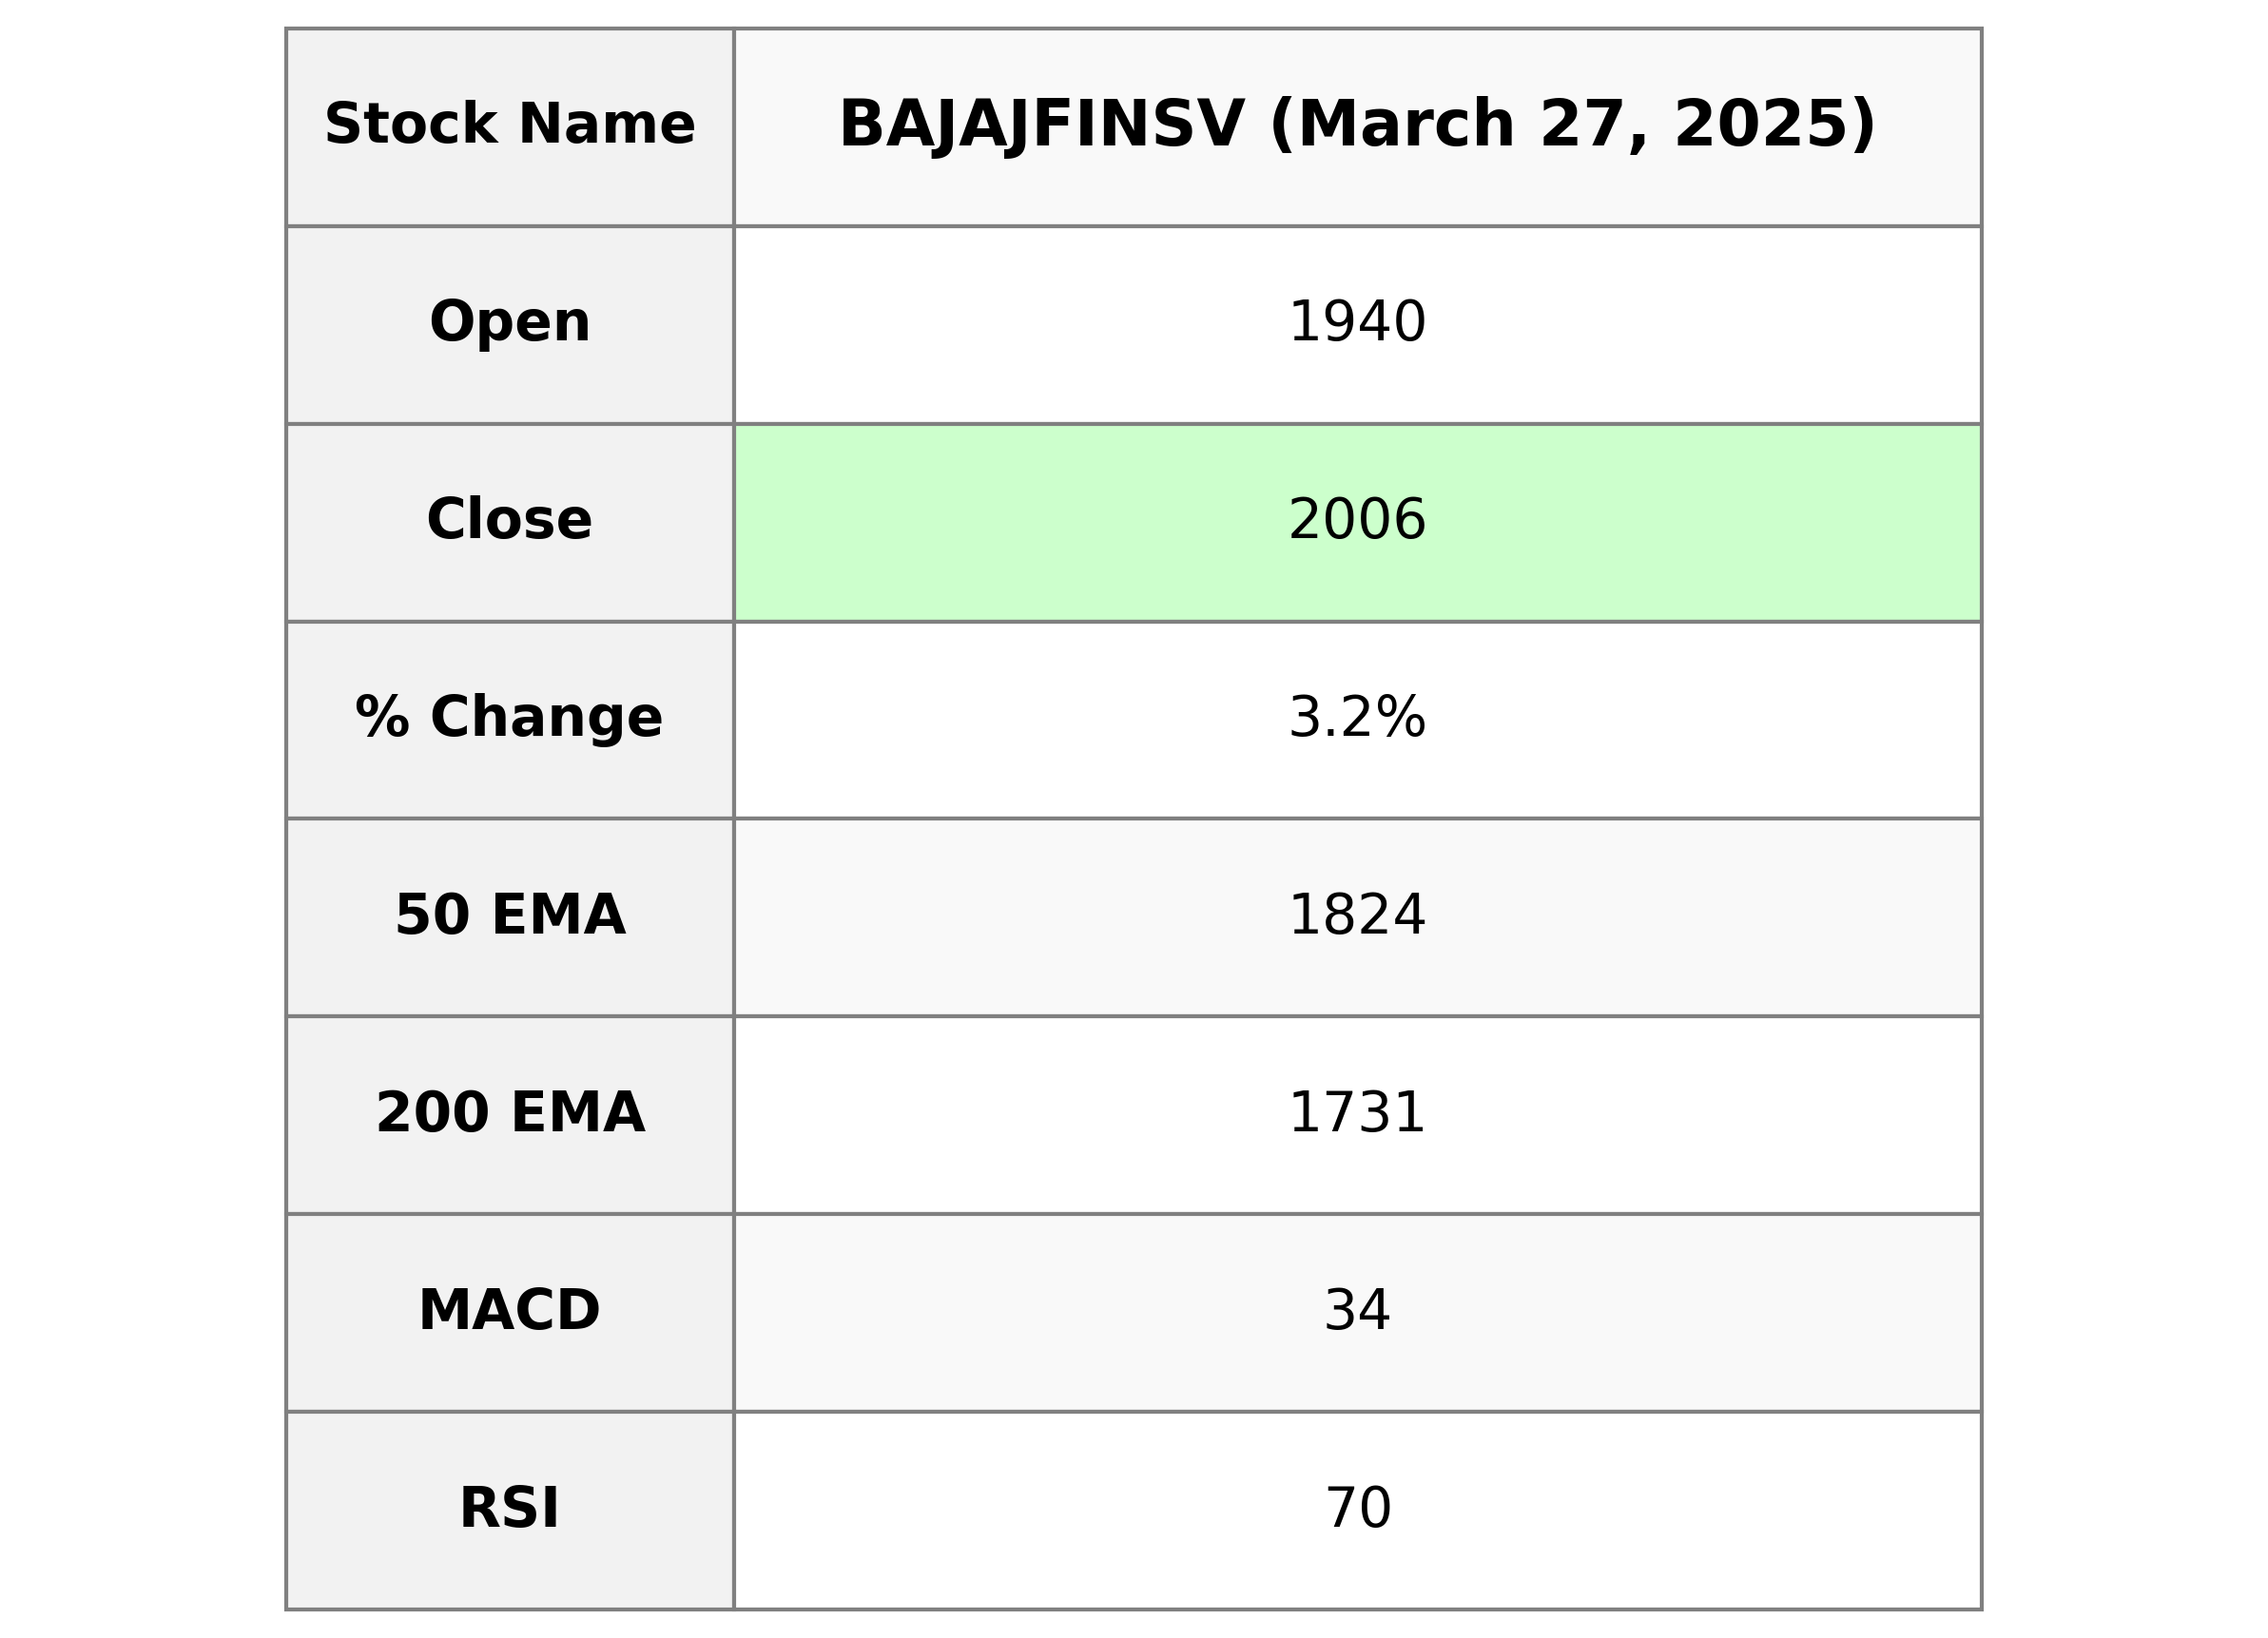
Bajaj Finserv Performance: Bajaj Finserv demonstrated a strong performance, with a closing price of 2005.75, showing a 3.21% rise compared to the previous close of 1943.40. The stock's volume indicates substantial trading interest, and technical indicators such as the RSI at 70.47 suggest overbought conditions, while the MACD of 33.99 signifies bullish momentum.

Relationship with Key Moving Averages
Bajaj Finserv is trading above its 10, 20, 50, and 200-day EMAs with the close price at 2005.75 compared to the 10 EMA of 1905.83, 20 EMA of 1876.00, 50 EMA of 1823.74, and 200 EMA of 1731.47. This indicates a bullish momentum in the short to long term for the stock.
Moving Averages Trend (MACD)
The MACD value for Bajaj Finserv is 33.9978, which is above the MACD Signal line at 21.0863. This indicates a bullish momentum, suggesting a potential upward trend in the stock price.

RSI Analysis
The RSI for Bajaj Finserv is 70.47, which is typically considered overbought. This suggests that the stock may be due for a price correction or consolidation in the near term.

Analysis for HDFC LIFE - March 27, 2025

HDFC Life Insurance Company Limited experienced a positive trading session with its stock closing at 681.90, marking a 2.02% increase from the previous close. The company's stock is trading above its 50, 200, 10, and 20-day EMAs, showing strong bullish momentum. With an RSI of 69.38, the stock is nearing overbought territory, supported by a positive MACD crossover. HDFC Life operates in the financial services sector, specifically in the life insurance industry in India.

Relationship with Key Moving Averages
The closing price of HDFC Life at 681.90 is above the 10 EMA (663.39), 20 EMA (650.12), 50 EMA (639.23), and 200 EMA (645.99), indicating a bullish trend with strong upward momentum compared to these moving averages.
Moving Averages Trend (MACD)
HDFC LIFE's MACD is 14.37, while the MACD Signal stands at 9.48, indicating a positive divergence. This suggests bullish momentum, as the MACD line is above the Signal line, pointing to potential upward price movement.

RSI Analysis
The RSI (Relative Strength Index) for HDFC Life is 69.38, which indicates that the stock is nearing overbought territory. Typically, an RSI above 70 suggests that a stock may be overvalued, potentially signaling a price correction. However, it is important to consider other technical indicators and market conditions before making any trading decisions.

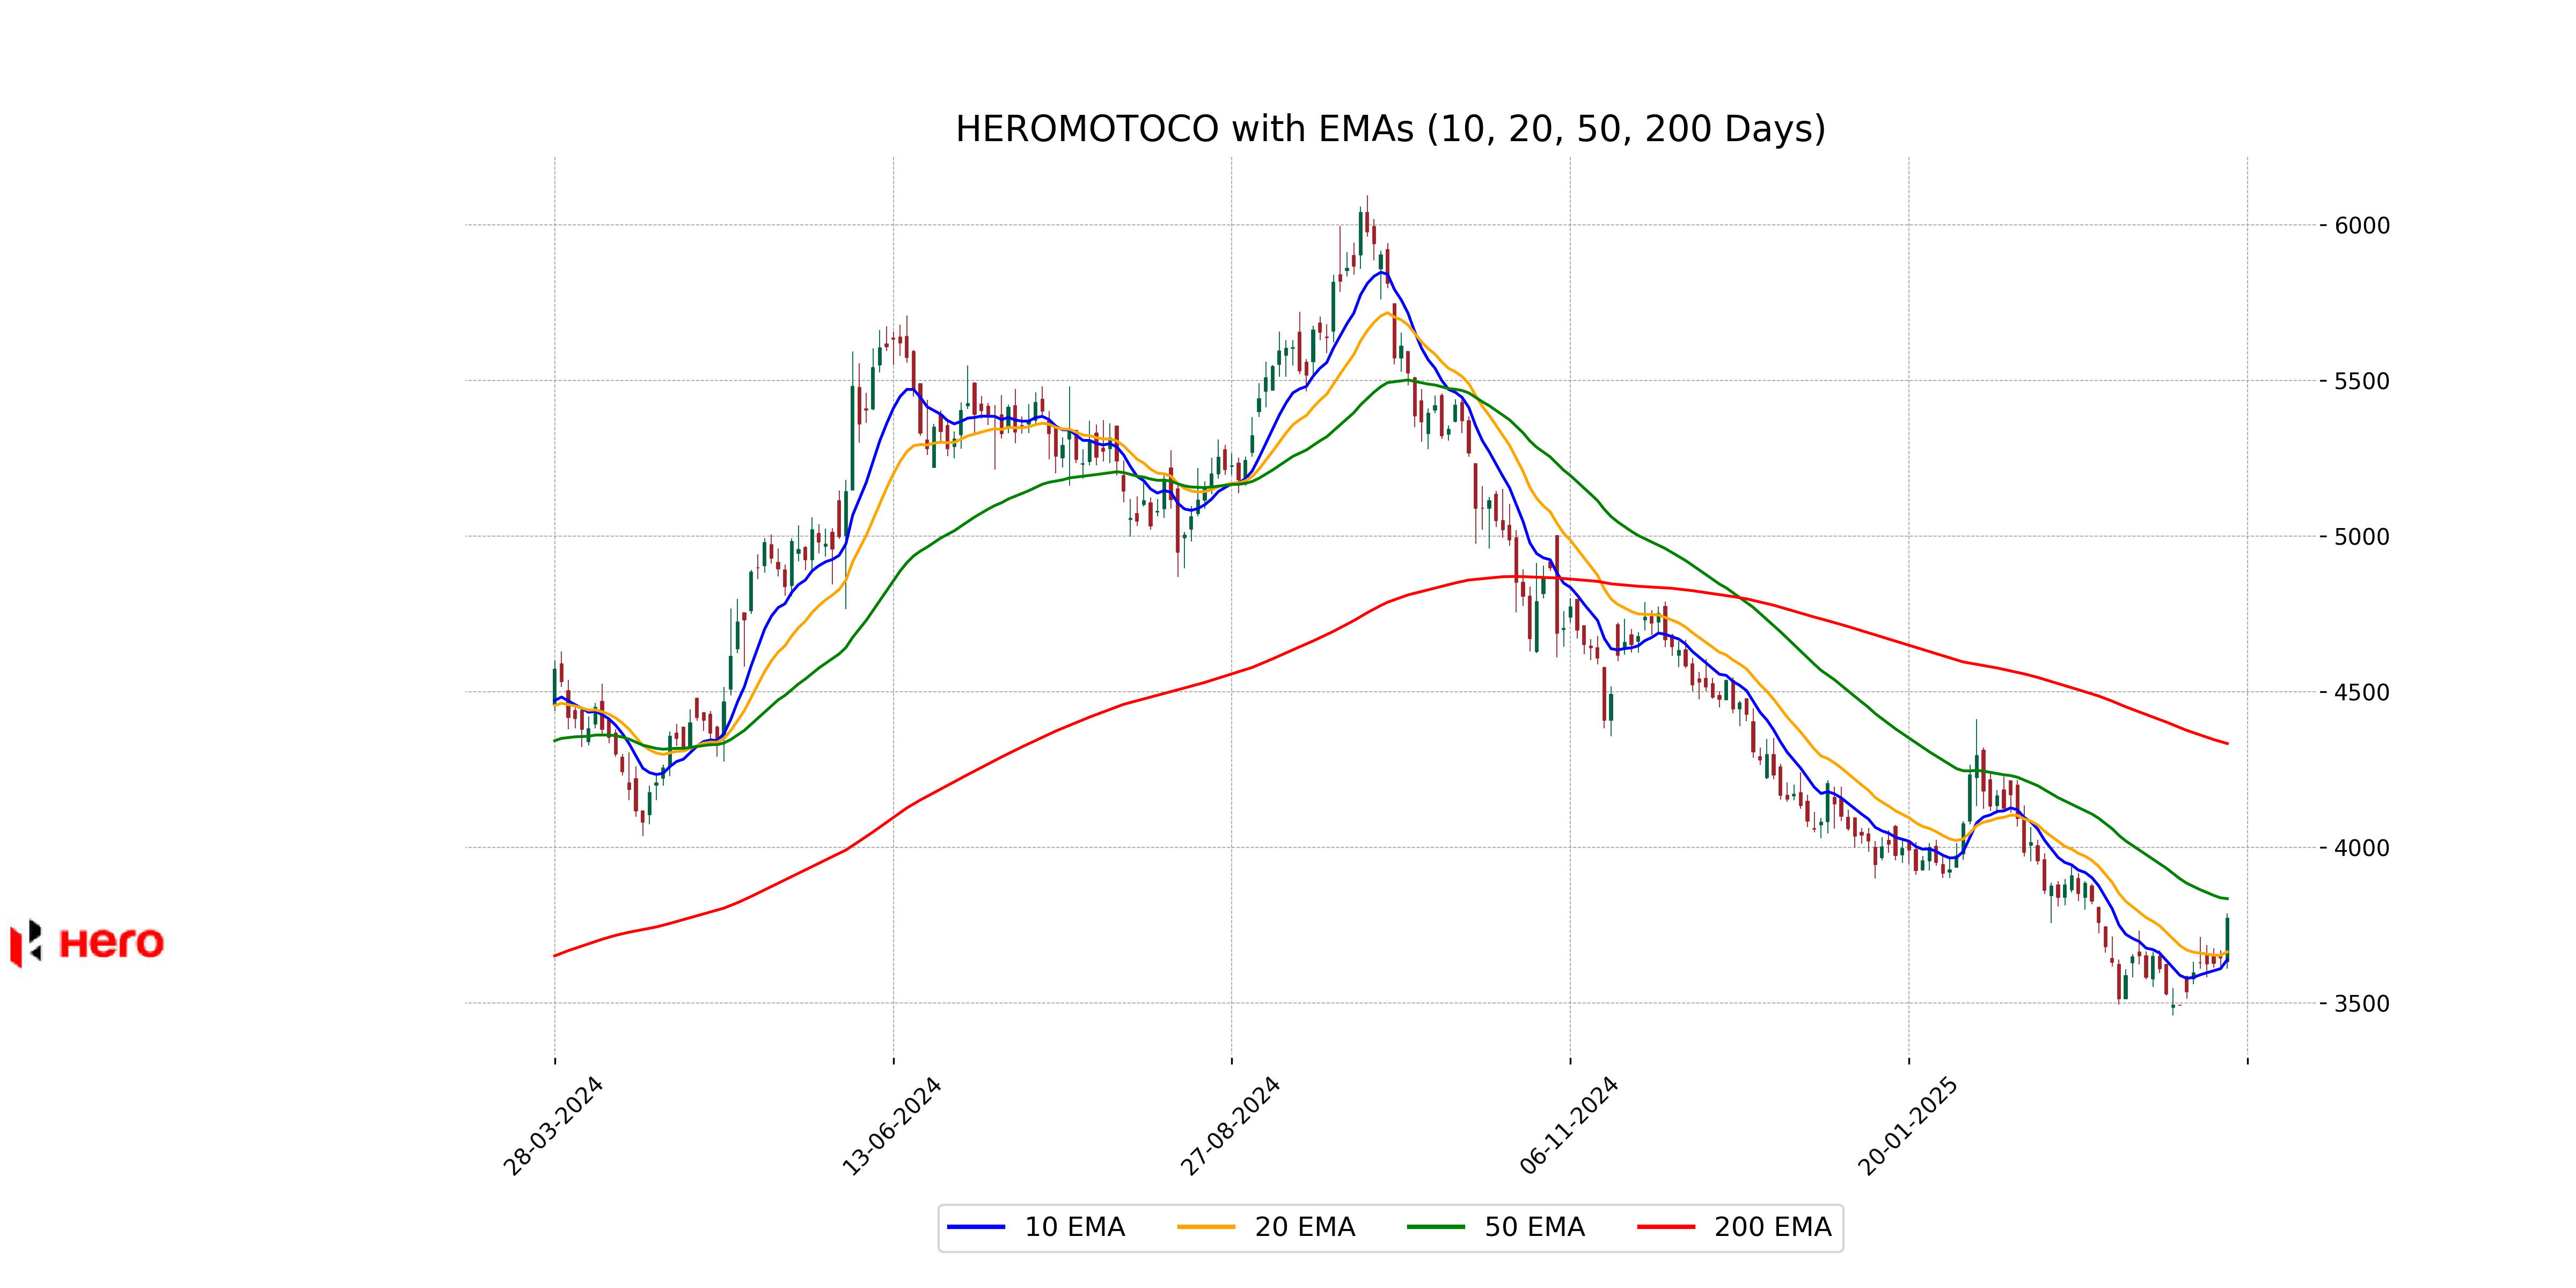
Analysis for Hero MotoCorp - March 27, 2025

Hero MotoCorp experienced a notable uptick in performance, closing at 3772.05, up from the previous close of 3645.95, marking a 3.46% increase. Despite the strong close, the stock remains below its 50 and 200 EMA, indicating potential resistance levels ahead. The RSI value of 55.66 suggests neutral momentum without overbought or oversold conditions.
Relationship with Key Moving Averages
Hero MotoCorp is trading above its 10 EMA and 20 EMA, indicating short-term bullish momentum, but remains below its 50 EMA and 200 EMA, suggesting potential longer-term bearish trends. The stock closed at 3772.05, which is above the 10 EMA of 3640.29 and the 20 EMA of 3665.02, but below the 50 EMA of 3835.72 and the 200 EMA of 4333.79.
Moving Averages Trend (MACD)
MACD Analysis for Hero MotoCorp: The MACD value for Hero MotoCorp is -56.05, with the MACD Signal at -88.95. This indicates a bullish convergence, as the MACD is moving closer to the signal line, potentially suggesting a bullish momentum is developing.

RSI Analysis
The RSI of Hero MotoCorp is 55.66, which is within the neutral range, indicating neither overbought nor oversold conditions. This suggests a balanced momentum, where the stock price may experience stable movements or trends in the near future.

Analysis for IndusInd Bank - March 27, 2025

IndusInd Bank displayed a moderate performance with a closing price of 673.55 INR, marking a 2.78% increase from its previous close. However, its RSI of 28.03 suggests that the stock might be oversold. Additionally, the MACD indicator shows a negative value, indicating bearish momentum. Despite these technical signals, the bank maintains a low PE Ratio of 7.24, reflecting a potentially undervalued position within the Financial Services sector.

Relationship with Key Moving Averages
IndusInd Bank's current close at 673.55 is below its 10 EMA at 695.97, 20 EMA at 767.70, 50 EMA at 879.36, and 200 EMA at 1107.49, indicating a bearish trend and potential continued downward pressure.
Moving Averages Trend (MACD)
IndusInd Bank's MACD indicates a bearish trend with a value of -89.47, which is lower than the MACD Signal at -82.79, suggesting a potential continuation of downward momentum. It is also important to note the RSI value of 28.03, which indicates that the stock is in the oversold territory and may experience a reversal if buying pressure increases.

RSI Analysis
The RSI for IndusInd Bank is 28.03, indicating it is in the oversold territory. This suggests that the stock might be undervalued at its current price level and could potentially experience a price increase as buyers step in.
