


Highlights
- Major indices trading below moving averages, signaling bearishness
- RSI levels suggest multiple markets in oversold zones
- MACD trends confirm continued downward momentum globally
Latest news

Opposition unites with government after Pahalgam massacre

Politics shadows cricket, PSL faces hurdles

Karnataka bids goodbye to Pahalgam terror martyrs

Manipur youth Congress slams BJP over Pahalgam attack

Blood, water can’t flow together: Pushkar Singh Dhami

India marks a final day of mourning for Pope Francis

New book explores 150 years of test cricket

Pakistan declares Indian water diversion war act
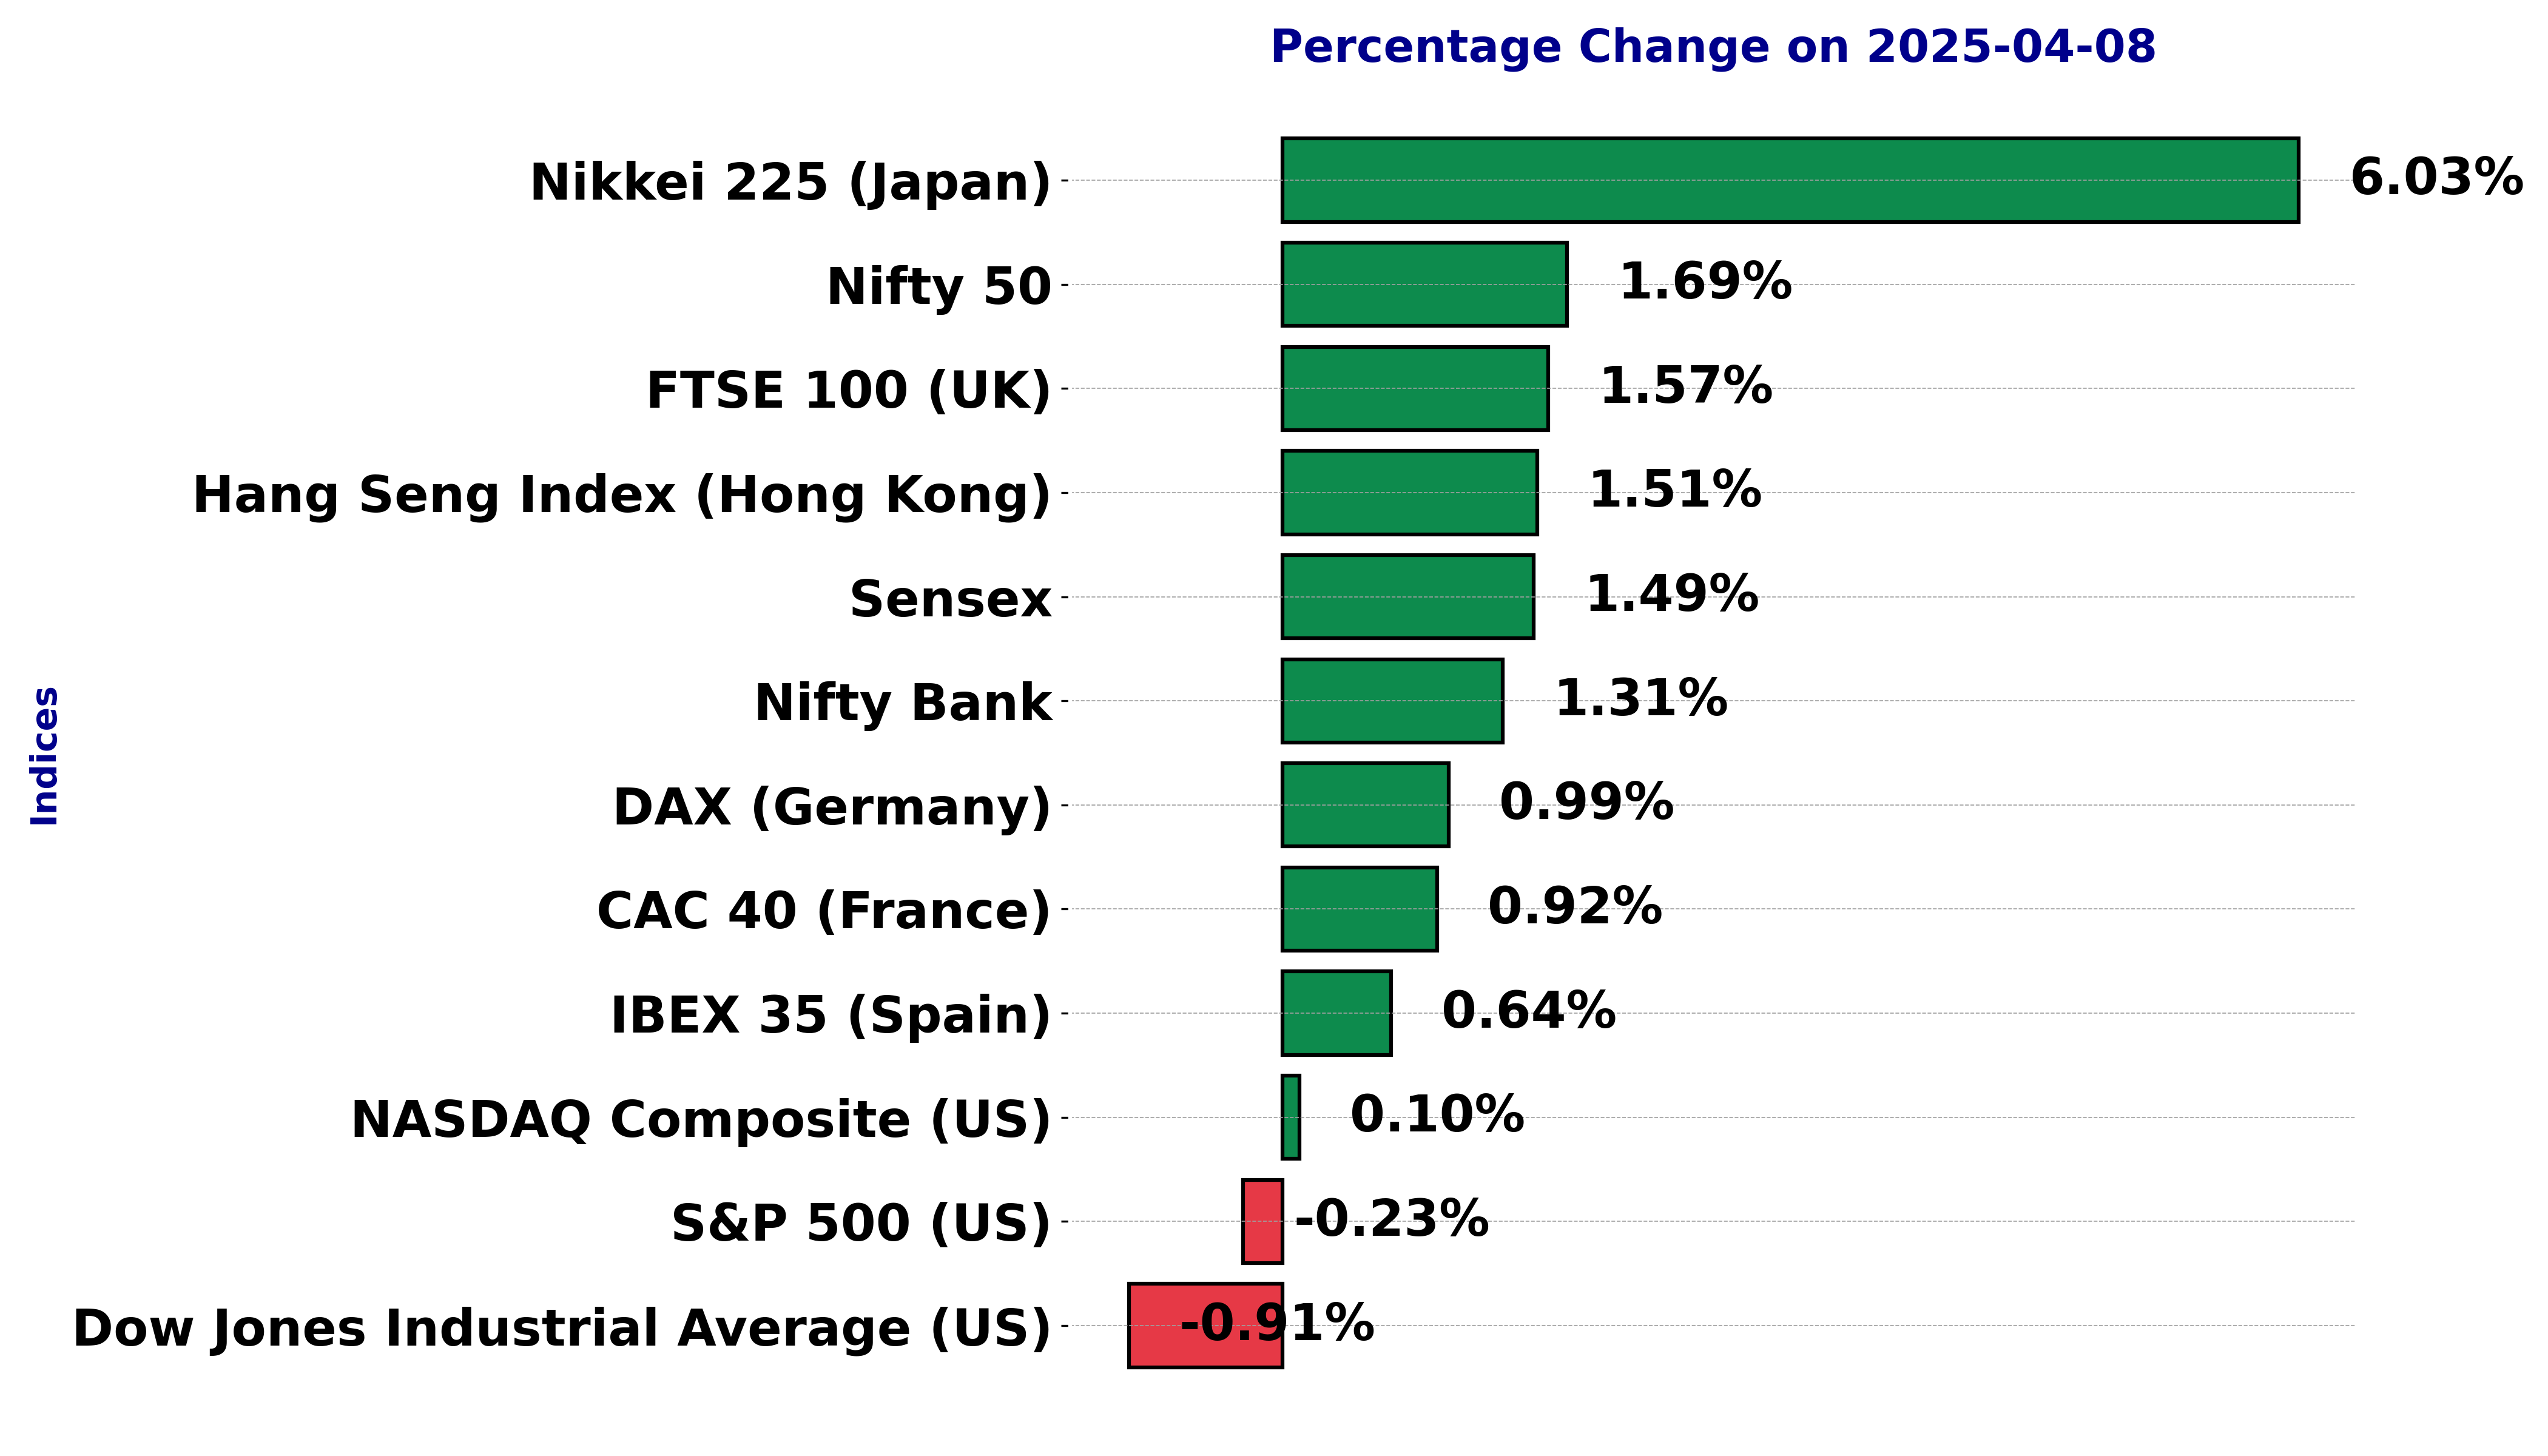
Global stock market indices: How the world markets performed today - 8 April 2025


The international stock market indices showed varied performances on April 08, 2025, reflecting the economic sentiment across different regions.
In this article, we analyze the performance of key global indices including the S&P 500, Dow Jones Industrial Average, NASDAQ Composite, FTSE 100, DAX, CAC 40, IBEX 35, Nikkei 225, Hang Seng, Nifty 50, and BSE Sensex.
Analysis for Sensex - April 08, 2025

The Sensex opened at 74,013.73 and closed at 74,227.08, marking a positive change of 1.49%. The index showed intraday volatility with a high of 74,859.39 and a low of 73,424.92. Technical indicators suggest a bearish sentiment with the RSI at 41.71 and a negative MACD of -113.71, indicating potential bearish momentum.

Relationship with Key Moving Averages
The current Sensex close of 74,227.08 is below the 10-day EMA (75,477.07), 20-day EMA (75,644.86), 50-day EMA (76,042.25), and 200-day EMA (77,065.61), indicating a potential bearish trend. The RSI of 41.71 also suggests that the market may be approaching oversold conditions.
Moving Averages Trend (MACD)
The MACD for Sensex is -113.71, while the MACD Signal is 160.74, indicating a potential bearish trend as the MACD is below the Signal line. This divergence suggests that momentum could be weakening.

RSI Analysis
The RSI for Sensex is 41.71, indicating that it is currently in a neutral to slightly oversold territory. This suggests a lack of bullish momentum and potential opportunities for buying if other indicators align, as RSI values below 30 are typically considered oversold.

Analysis for Dow Jones Industrial Average (US) - April 08, 2025

The Dow Jones Industrial Average opened at 37,879.65, with a high of 39,207.02 and a low of 36,611.78. It closed at 37,965.60, representing a decrease of 0.91% from the previous close of 38,314.86. The index experienced a point change of -349.26 with a notably low RSI of 22.43, indicating potential oversold conditions.

Relationship with Key Moving Averages
The Dow Jones Industrial Average is trading below significant moving averages, as evidenced by the current close of 37965.60, which is below the 50 EMA of 42338.25, 200 EMA of 41925.97, 20 EMA of 41374.76, and 10 EMA of 40595.24. This positioning indicates bearish momentum.
Moving Averages Trend (MACD)
The MACD analysis for the Dow Jones Industrial Average shows that the MACD value is -858.07, significantly below the MACD Signal of -509.46. This indicates a strong bearish trend, suggesting potential continued downward momentum in the index.

RSI Analysis
The RSI (Relative Strength Index) for the Dow Jones Industrial Average is 22.43, which suggests that it is currently in oversold territory. This low RSI value may indicate that the index could be undervalued, potentially signaling a buying opportunity for some investors.

Analysis for CAC 40 (France) - April 08, 2025

CAC 40 (France) Performance The CAC 40 index opened at 7036.17, reaching a high of 7063.67, and closed at 6990.56, marking a 0.91% rise from the previous close. The index is experiencing bearish momentum, with its RSI at 22.01 indicating an oversold condition, and the MACD showing a negative divergence.

Relationship with Key Moving Averages
For CAC 40 (France), the closing price of 6990.56 is below the key moving averages: 50 EMA (7835.87), 200 EMA (7691.35), 10 EMA (7504.20), and 20 EMA (7721.17). This indicates a bearish trend as the current price is significantly below these averages.
Moving Averages Trend (MACD)
The CAC 40 (France) shows a bearish trend with a negative MACD value of -213.30, indicating downward momentum. The MACD is significantly below its signal line value of -93.55, reinforcing bearish sentiment in the market.

RSI Analysis
The RSI for the CAC 40 (France) is 22.01, indicating that the index is in the oversold territory. This suggests that the index may be undervalued and could potentially be due for a price correction or rally. However, it's important to consider other technical indicators and market conditions for a comprehensive analysis.

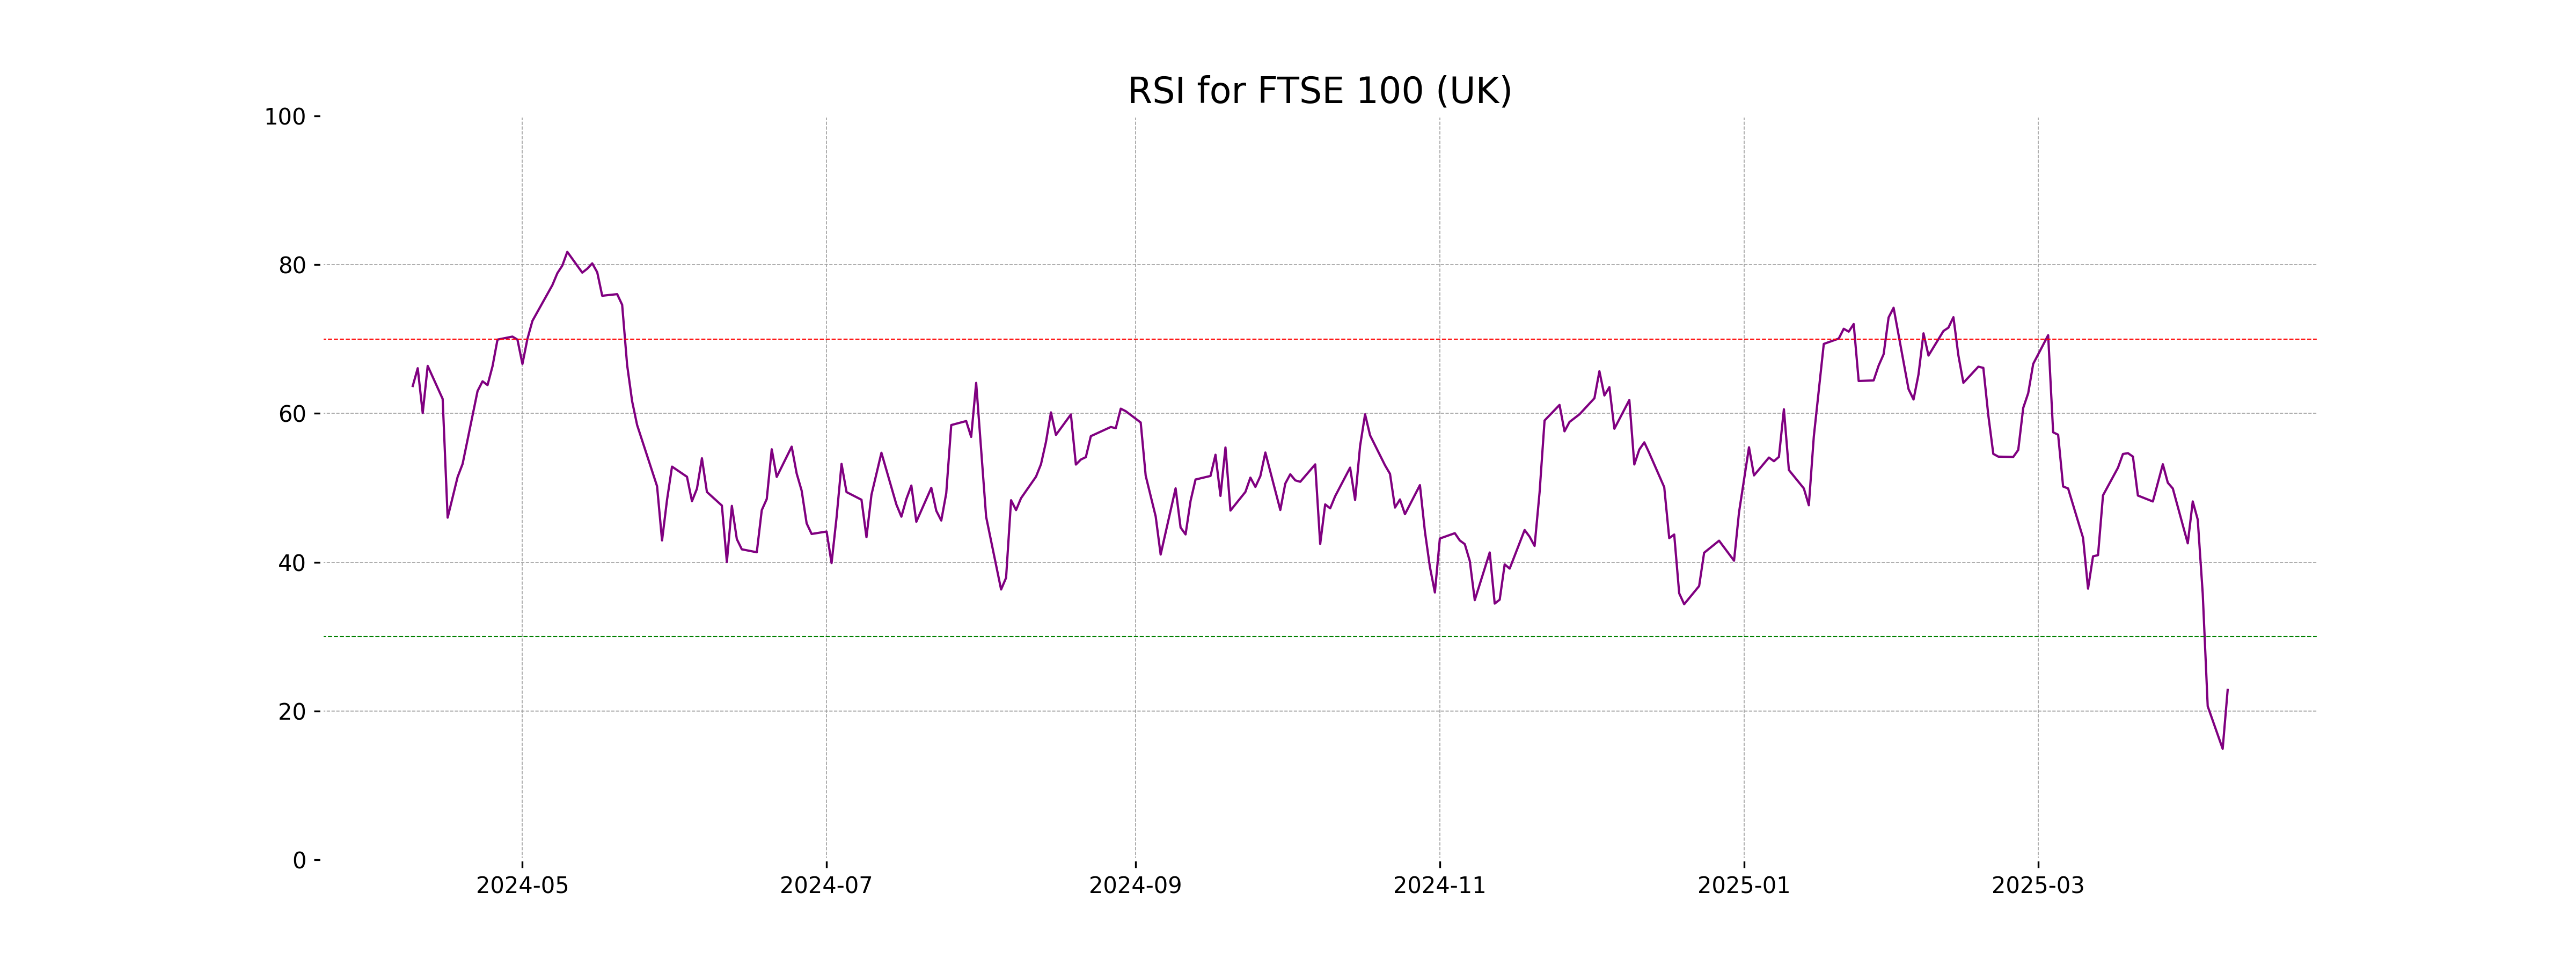
Analysis for FTSE 100 (UK) - April 08, 2025

FTSE 100 (UK) experienced a positive performance with a closing value of 7823.32, marking a significant increase from the previous close, reflected by a 1.57% change and a gain of 121.22 points. The Relative Strength Index (RSI) is low at 22.83, indicating potential oversold conditions, while the MACD suggests bearish momentum with a value of -161.86, although it appears to be improving towards the signal line.

Relationship with Key Moving Averages
FTSE 100 (UK) closed at 7823.32, which is below its 50-day EMA of 8522.43, and 200-day EMA of 8347.46, as well as the 10-day EMA of 8264.26 and 20-day EMA of 8431.26. This indicates a bearish trend with prices closing below key moving averages.
Moving Averages Trend (MACD)
MACD Analysis for FTSE 100 (UK): The MACD for FTSE 100 indicates a bearish trend with a value of -161.86, which is below its signal line of -62.41. This suggests a potential continuation of downward momentum in the short-term.

RSI Analysis
The RSI for FTSE 100 is 22.83, which indicates that the index is in oversold territory. This suggests that there may be a potential for a price reversal or uptick as traders might consider the index undervalued at this level.
Analysis for DAX (Germany) - April 08, 2025

DAX (Germany) Performance: The DAX index opened at 20039.69 and closed at 19984.64, showing a positive change of 0.99% from the previous close of 19789.62 with a points gain of 195.02. The RSI stands at 27.47, indicating an oversold condition, while the MACD is significantly negative at -500.85, suggesting bearish momentum.

Relationship with Key Moving Averages
The DAX (Germany) closed below its key moving averages, with the close of 19984.64 significantly under the 50 EMA at 22001.30, the 200 EMA at 20337.14, and the 10 EMA at 21389.73, indicating a bearish sentiment in the market. The 20 EMA is also at 21944.58 and further solidifies the downward pressure.
Moving Averages Trend (MACD)
The MACD for DAX (Germany) is -500.85, which is significantly below the MACD Signal of -137.42, indicating a bearish trend. This suggests that the stock is experiencing downward momentum and may continue to decline until a reversal signal appears.

RSI Analysis
The RSI value of 27.47 for DAX (Germany) is below 30, which suggests that the index may be oversold. This indicates potential undervaluation and might be a signal for a possible upward price correction. However, other factors should also be considered before making any investment decisions.

Analysis for S&P 500 (US) - April 08, 2025

S&P 500 (US) opened at 4953.79 and closed slightly lower at 5062.25 with a negative change of -0.23% or a points drop of -11.83. Despite reaching a high of 5246.57 during the trading session, it experienced a low of 4835.04. The RSI indicates oversold conditions at 23.00, while the MACD is below its signal, signaling bearish momentum.

Relationship with Key Moving Averages
The current close price for S&P 500 is 5062.25, which is below all the provided moving averages: 50-day EMA (5732.79), 200-day EMA (5686.67), 10-day EMA (5434.22), and 20-day EMA (5563.29). This indicates a bearish trend as the price is trading below the key moving averages.
Moving Averages Trend (MACD)
The MACD for the S&P 500 is at -144.78, indicating a bearish trend, as it is below the MACD Signal line of -92.19. This suggests that the market's momentum has been declining.

RSI Analysis
Based on the stock data provided, the Relative Strength Index (RSI) for S&P 500 is at 23.00, which indicates the index is in an oversold condition. This may suggest potential for a rebound, as RSI levels below 30 often signal that a security is undervalued.

Analysis for Hang Seng Index (Hong Kong) - April 08, 2025

The Hang Seng Index opened at 20,157.52 and closed at 20,127.68, experiencing a positive change of 1.51% with a points increase of 299.38. Despite this upward movement, key indicators such as the RSI at 27.12 suggest it may be in oversold territory, while the MACD remains negative, indicating potential bearish sentiment.

Relationship with Key Moving Averages
The Hang Seng Index closed below its 50-day EMA of 22,503.62, 200-day EMA of 20,441.37, 10-day EMA of 22,244.41, and 20-day EMA of 22,800.84. This suggests a bearish trend as it is trading below key moving averages.
Moving Averages Trend (MACD)
The Hang Seng Index currently has a MACD value of -417.72, which is significantly below the MACD Signal line of 61.24. This negative divergence indicates a bearish trend, suggesting potential continued weakness in the index's momentum.

RSI Analysis
The Hang Seng Index has an RSI of 27.12, indicating it is in oversold territory. This suggests potential undervaluation or a bearish trend, possibly prompting a price reversal or continued weakness.

Analysis for IBEX 35 (Spain) - April 08, 2025

The IBEX 35 (Spain) opened at 11,937.80 and closed slightly lower at 11,861.50, showing a percentage change of 0.64% with a points change of 75.70. The RSI is at a low 26.96, and the MACD indicates a bearish sentiment at -168.68. The 50-day EMA is above the 200-day EMA, suggesting a longer-term bullish trend despite current bearish momentum.

Relationship with Key Moving Averages
The IBEX 35 index closed at 11,861.5, which is below its 50-day EMA of 12,834.26 and its 20-day EMA of 12,913.00, indicating a bearish trend when compared to these short-term and medium-term averages. However, it is slightly below the 200-day EMA of 11,989.39, suggesting underlying long-term weakness as well.
Moving Averages Trend (MACD)
The MACD for IBEX 35 shows a value of -168.68, indicating a bearish trend. With the MACD line below the signal line at 18.98, it suggests a potential continuation of downward momentum. However, traders often look for divergence signals or crossovers for potential trend reversals.

RSI Analysis
The RSI for the IBEX 35 (Spain) is 26.96, indicating that the index is in the oversold territory. This suggests that the stock may be undervalued and potentially due for a price correction upward.

Analysis for NASDAQ Composite (US) - April 08, 2025

The NASDAQ Composite opened at 14,978.03 and closed at 15,603.26, showing a modest increase of 0.10% with a points change of 15.47. The RSI indicates a significantly oversold condition at 24.76, and the MACD shows a negative trend with a value of -611.21. The EMAs reflect a short-term bearish trend as the 10 and 20 EMA values are below the 50 and 200 EMA.

Relationship with Key Moving Averages
The NASDAQ Composite's current close of 15603.26 is below its 10 EMA of 16838.75, 20 EMA of 17359.80, 50 EMA of 18150.74, and 200 EMA of 18149.10, indicating a bearish trend as the price is trading beneath all key moving averages. Additionally, the RSI of 24.76 signifies that the market is in an oversold condition.
Moving Averages Trend (MACD)
MACD analysis for NASDAQ Composite (US): The MACD value of -611.21, which is below its signal line at -439.56, suggests a bearish trend. This indicates that the market sentiment for NASDAQ Composite is currently negative, with momentum likely to continue downwards.

RSI Analysis
The Relative Strength Index (RSI) for NASDAQ Composite is currently 24.76, indicating it is in an oversold condition. This suggests that the index might be undervalued, potentially hinting at a buying opportunity if other factors align positively.

Analysis for Nikkei 225 (Japan) - April 08, 2025

Nikkei 225 (Japan) opened at 31,729.11 and closed at 33,012.58, marking a significant increase of 6.03% from the previous close of 31,136.58. The index experienced a high of 33,257.16 and a low of 31,703.69, with no volume reported. The Relative Strength Index (RSI) is at 31.25, indicating potential oversold conditions, while the MACD suggests a bearish trend with a value of -1,246.37 below its signal line at -752.44.

Relationship with Key Moving Averages
The Nikkei 225's current closing price of 33,012.58 is below the 50 EMA of 37,146.11, 200 EMA of 37,890.48, and 10 EMA of 34,653.42, suggesting a potential bearish trend. However, it is above its 20 EMA of 35,800.81, indicating short-term upward momentum.
Moving Averages Trend (MACD)
The MACD value for Nikkei 225 is -1246.37, which is below the signal line value of -752.44, indicating potential bearish momentum. This suggests that the index may be experiencing a downward trend in the current market conditions.

RSI Analysis
The RSI value for Nikkei 225 is 31.25, indicating that the index is approaching oversold territory, often interpreted as a potential buying opportunity. However, traders typically wait for additional indicators for confirmation.

Analysis for Nifty Bank - April 08, 2025

Nifty Bank opened at 50388.55, reaching a high of 50793.70 and closed at 50511.00, reflecting a 1.31% increase over the previous close. The stock has a 50 EMA of 49994.54 and a 200 EMA of 50043.21, with RSI at 52.56, indicating slightly bullish momentum. The MACD value is 490.22, while the MACD Signal stands at 522.67, suggesting mild upward movement. Volume and market cap details are unavailable.

Relationship with Key Moving Averages
Nifty Bank's closing price of 50,511 is above its 50 EMA of 49,994.54 and its 200 EMA of 50,043.21, indicating a potential upward trend. However, it is below its 10 EMA of 50,786.57, which may suggest short-term bearish pressure.
Moving Averages Trend (MACD)
MACD Analysis for Nifty Bank: The MACD value of 490.22 indicates a level of momentum in the price of Nifty Bank; however, it is below the MACD Signal line of 522.67. This suggests a potential bearish divergence or slowing upward momentum, which traders might interpret as a signal to exercise caution.

RSI Analysis
The RSI for Nifty Bank is 52.56, which is typically considered a neutral zone. This suggests the stock is neither overbought nor oversold. With a slight upward % change of 1.31% in the closing price, the market might be stabilizing, but it's important to monitor other indicators for a clearer trend direction.

Analysis for Nifty 50 - April 08, 2025

Nifty 50 opened at 22,446.75 and closed at 22,535.85, marking an increase of 374.25 points or 1.69% from the previous closing of 22,161.60. Despite the positive change in closing price, the relative strength index (RSI) of 42.08 indicates a weak momentum. Furthermore, the moving average convergence divergence (MACD) of -15.29 is lower than its signal line, suggesting a bearish trend in the market.

Relationship with Key Moving Averages
The Nifty 50's current close of 22,535.85 is below its 50-day EMA of 23,063.08 and 200-day EMA of 23,380.83, indicating a bearish trend. Additionally, the close is below the 10-day EMA of 22,932.08 and 20-day EMA of 22,970.55, which suggests short-term weakness.
Moving Averages Trend (MACD)
The MACD for Nifty 50 is currently at -15.29, which is below the MACD Signal line at 72.93. This suggests a bearish trend. The momentum appears to be on the downside.

RSI Analysis
The Relative Strength Index (RSI) for Nifty 50 is currently at 42.08, indicating a weak momentum as it falls below the neutral mark of 50. This suggests that the index might be experiencing bearish pressure, but it is not in the oversold territory yet.

Up Next

Global stock market indices: How the world markets performed today - 8 April 2025

Indian stock market sector-wise performance today - April 24 2025

Top 5 Nifty 50 gainers today – April 24, 2025: Biggest stock moves
NSE Nifty 50: Top 5 stock losers of April 24, 2025

Global stock market indices: How the world markets performed today - 23 April 2025

Indian stock market sector-wise performance today - April 23, 2025

More videos

Top 5 Nifty 50 gainers today – April 23, 2025: Biggest stock moves

NSE Nifty 50: Top 5 stock losers of April 23, 2025

Sensex, Nifty rise for 6th day on foreign fund inflows, buying in banking shares

Global stock market indices: How the world markets performed today - 22 April 2025

Indian stock market sector-wise performance today - April 22, 2025

NSE Nifty 50: Top 5 stock losers of April 22, 2025

Top 5 Nifty 50 gainers today – April 22, 2025: Biggest stock moves

Stock markets rally for 5th day; Sensex jumps 855 pts on buying in banking, IT shares

Global stock market indices: How the world markets performed today - 21 April 2025

Indian stock market sector-wise performance today - April 21, 2025