


Highlights
Latest news

Samsung Galaxy M17 5G Review: Best Budget Samsung Phone Under ₹15,000?

OnePlus 15R first look: OnePlus changes the R-series playbook

India's retail inflation rises to 0.71% in November

Cabinet approves CoalSETU window for auction of coal to boost industrial use and export

Cabinet approves Minimum Support Price for Copra for 2026 season

Fire never left: Vinesh Phogat comes out of retirement, targets LA Olympics

Flexible office segment in India set to grow faster, over 25% annually by 2027: Report

Rahul Gandhi flags issue of air pollution, seeks discussion in Lok Sabha
Global Stock Market Indices: How the World Markets performed today - (April 15, 2025)?


?")
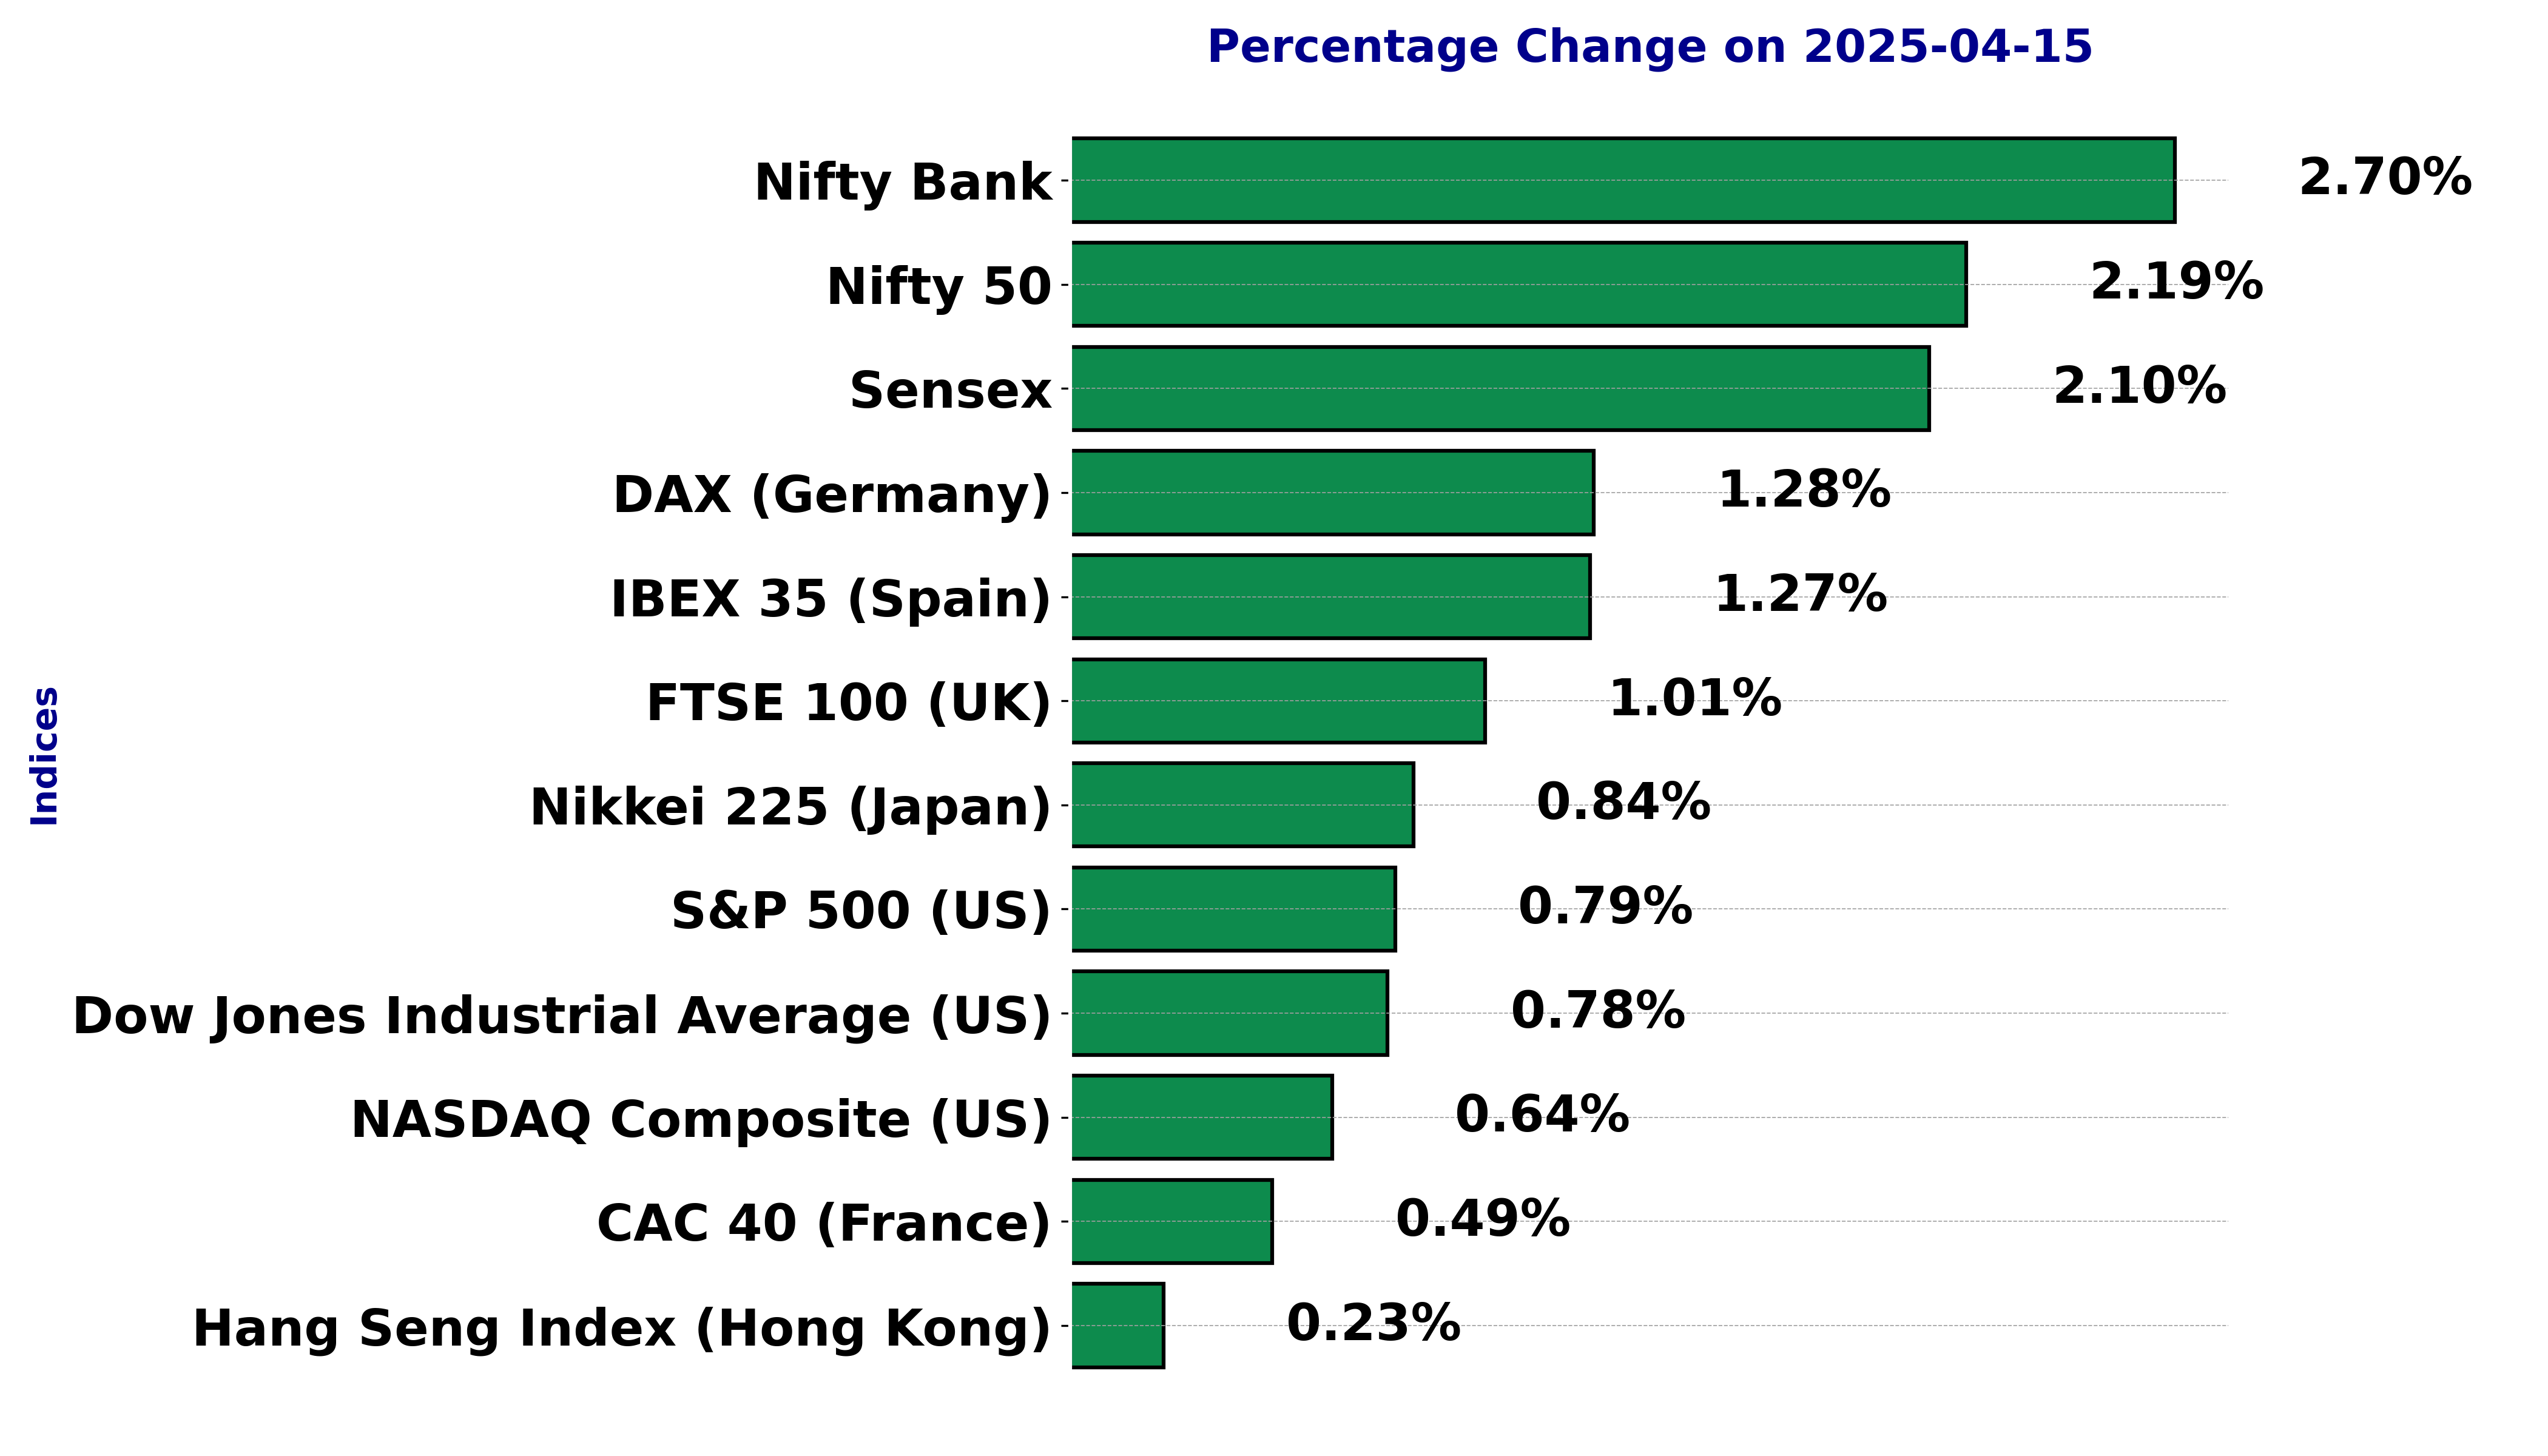
The international stock market indices showed varied performances on April 15, 2025, reflecting the economic sentiment across different regions.
In this article, we analyze the performance of key global indices including the S&P 500, Dow Jones Industrial Average, NASDAQ Composite, FTSE 100, DAX, CAC 40, IBEX 35, Nikkei 225, Hang Seng, Nifty 50, and BSE Sensex.
Analysis for Sensex - April 15, 2025

The Sensex opened at 76,852.06 and closed at 76,734.89, marking a gain since the previous close of 75,157.26, with a 2.10% increase and a points change of 1,577.63. The relative strength index (RSI) sits at 55.67, suggesting a neutral momentum, while the Moving Average Convergence Divergence (MACD) indicator shows a negative value of -101.36, hinting at a potential bearish trend. Trading volume was recorded as zero.
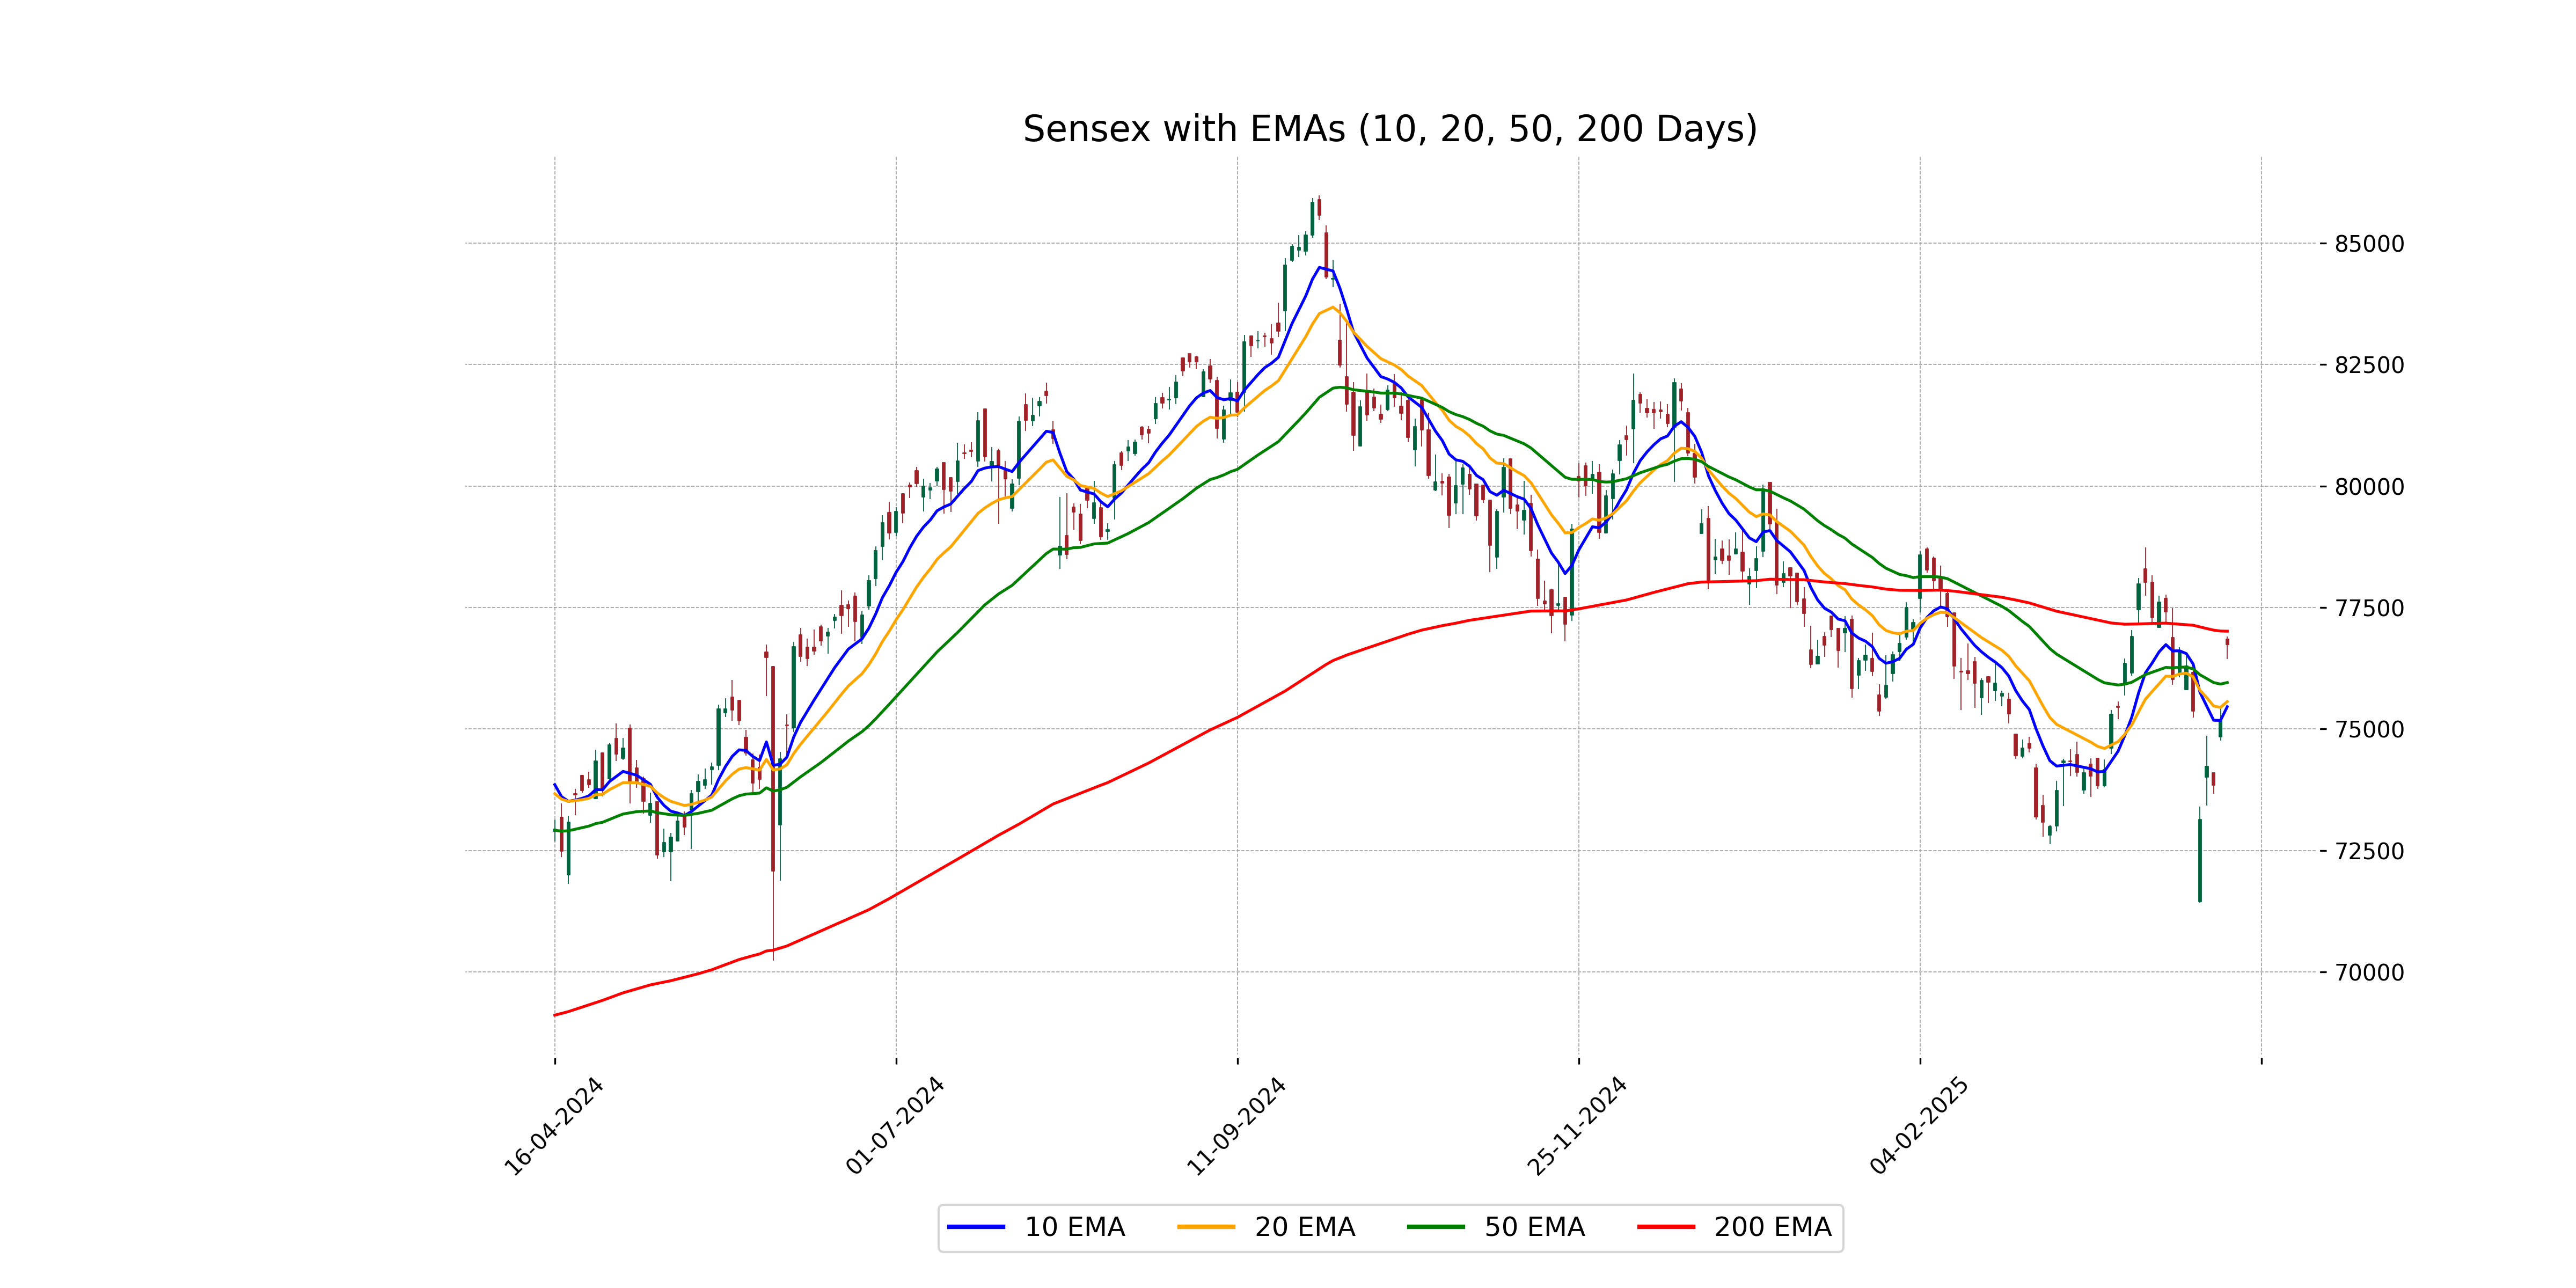
Relationship with Key Moving Averages
Sensex opened at 76,852.06 and closed at 76,734.89, which is above its 50-day EMA of 75,956.61, indicating a short-term bullish trend. However, it is slightly below the 200-day EMA of 77,013.43, suggesting a possible longer-term consolidation or resistance.
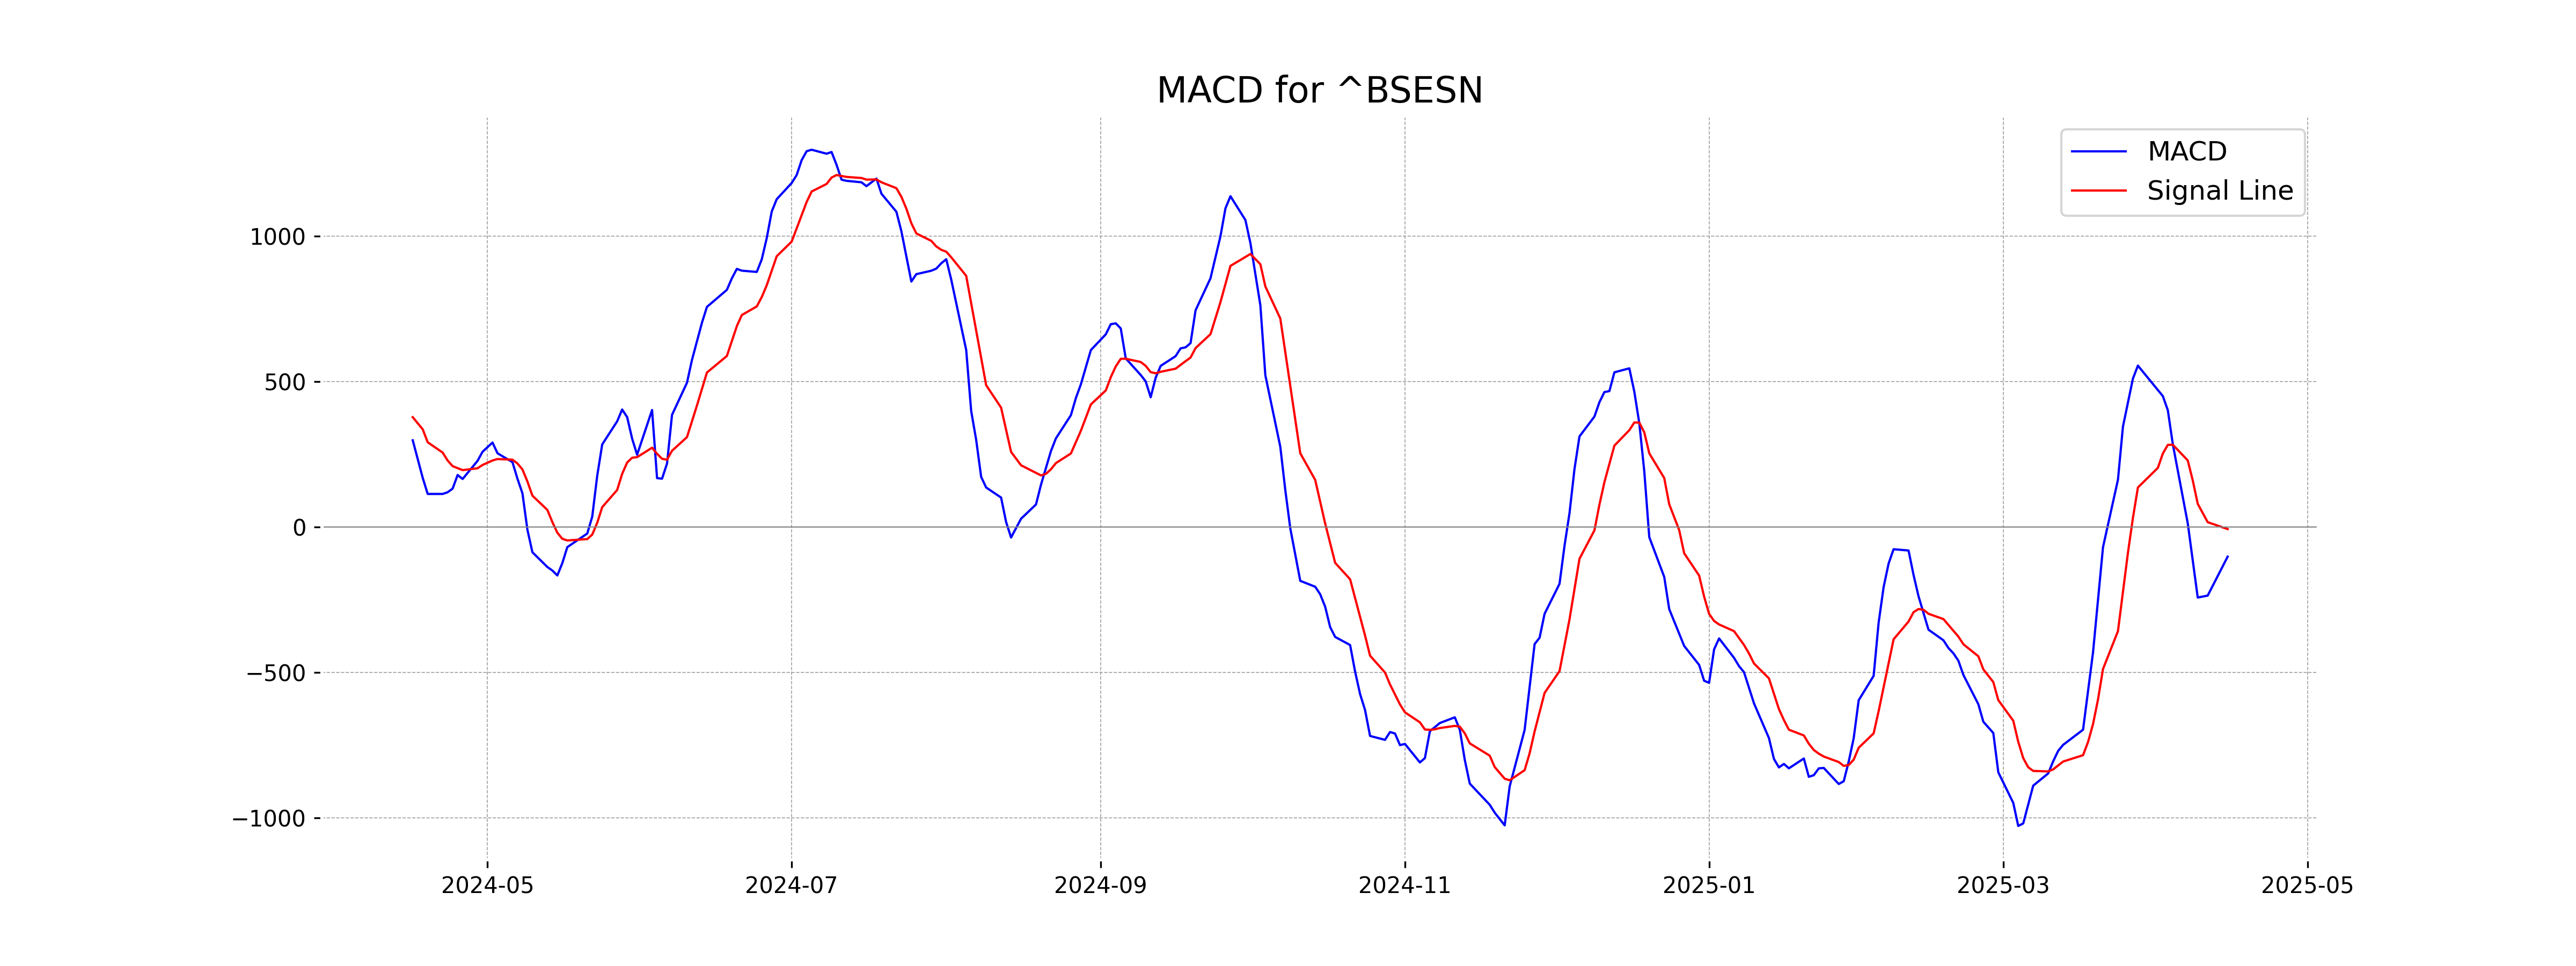
Moving Averages Trend (MACD)
The MACD value for Sensex indicates a potential bearish momentum since it is negative at -101.36, significantly below the MACD Signal of -6.58. This suggests that the recent price movements might not be strong enough to reverse the trend immediately. However, monitoring is advised for any signs of trend changes.
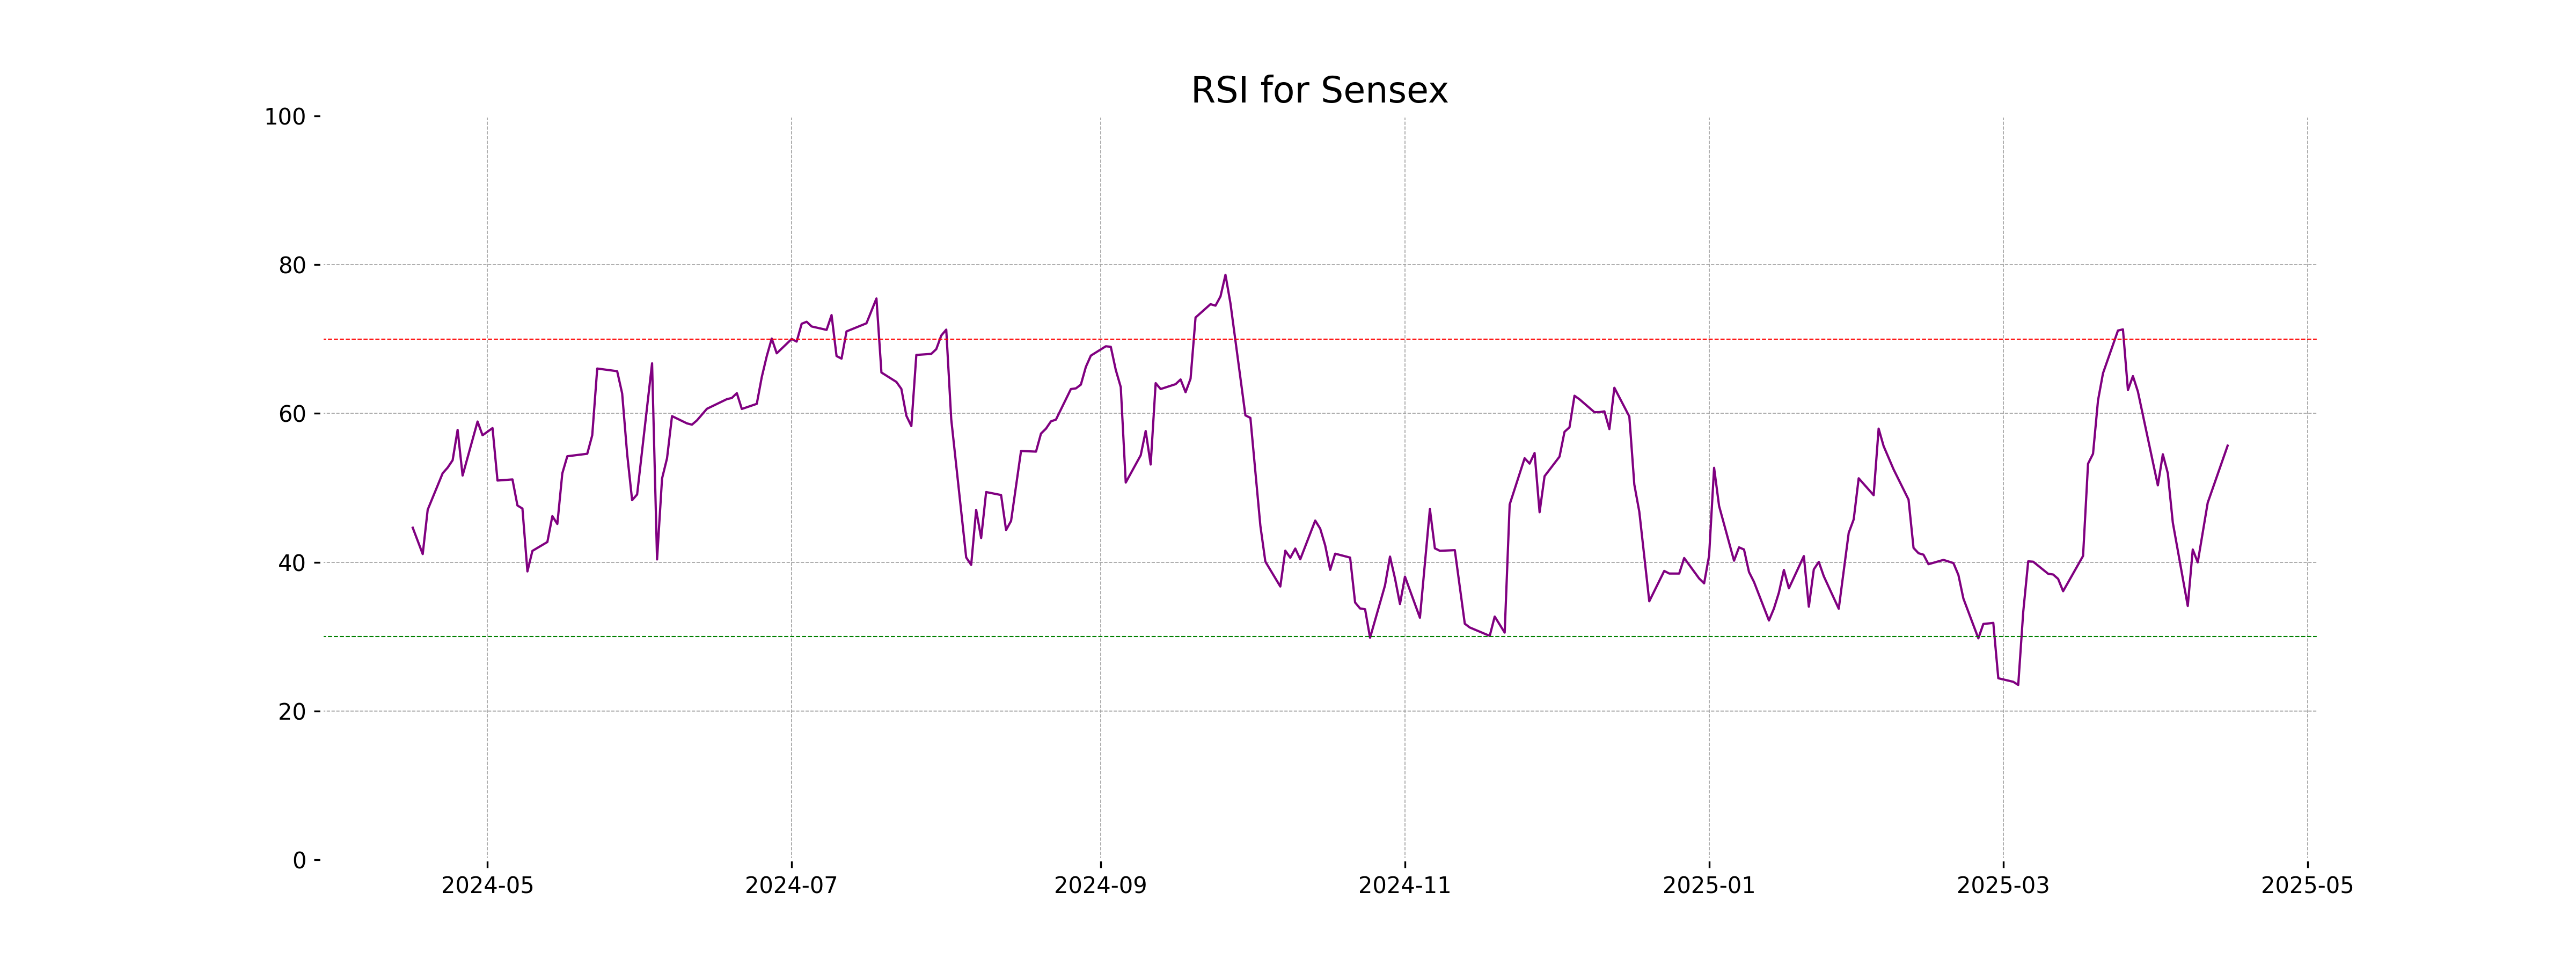
RSI Analysis
The RSI value for Sensex is 55.67, which indicates a neutral stance as it is neither in the overbought territory (typically above 70) nor in the oversold zone (typically below 30). This suggests that the market might be stable but could move towards a trend in either direction.
Analysis for Dow Jones Industrial Average (US) - April 15, 2025
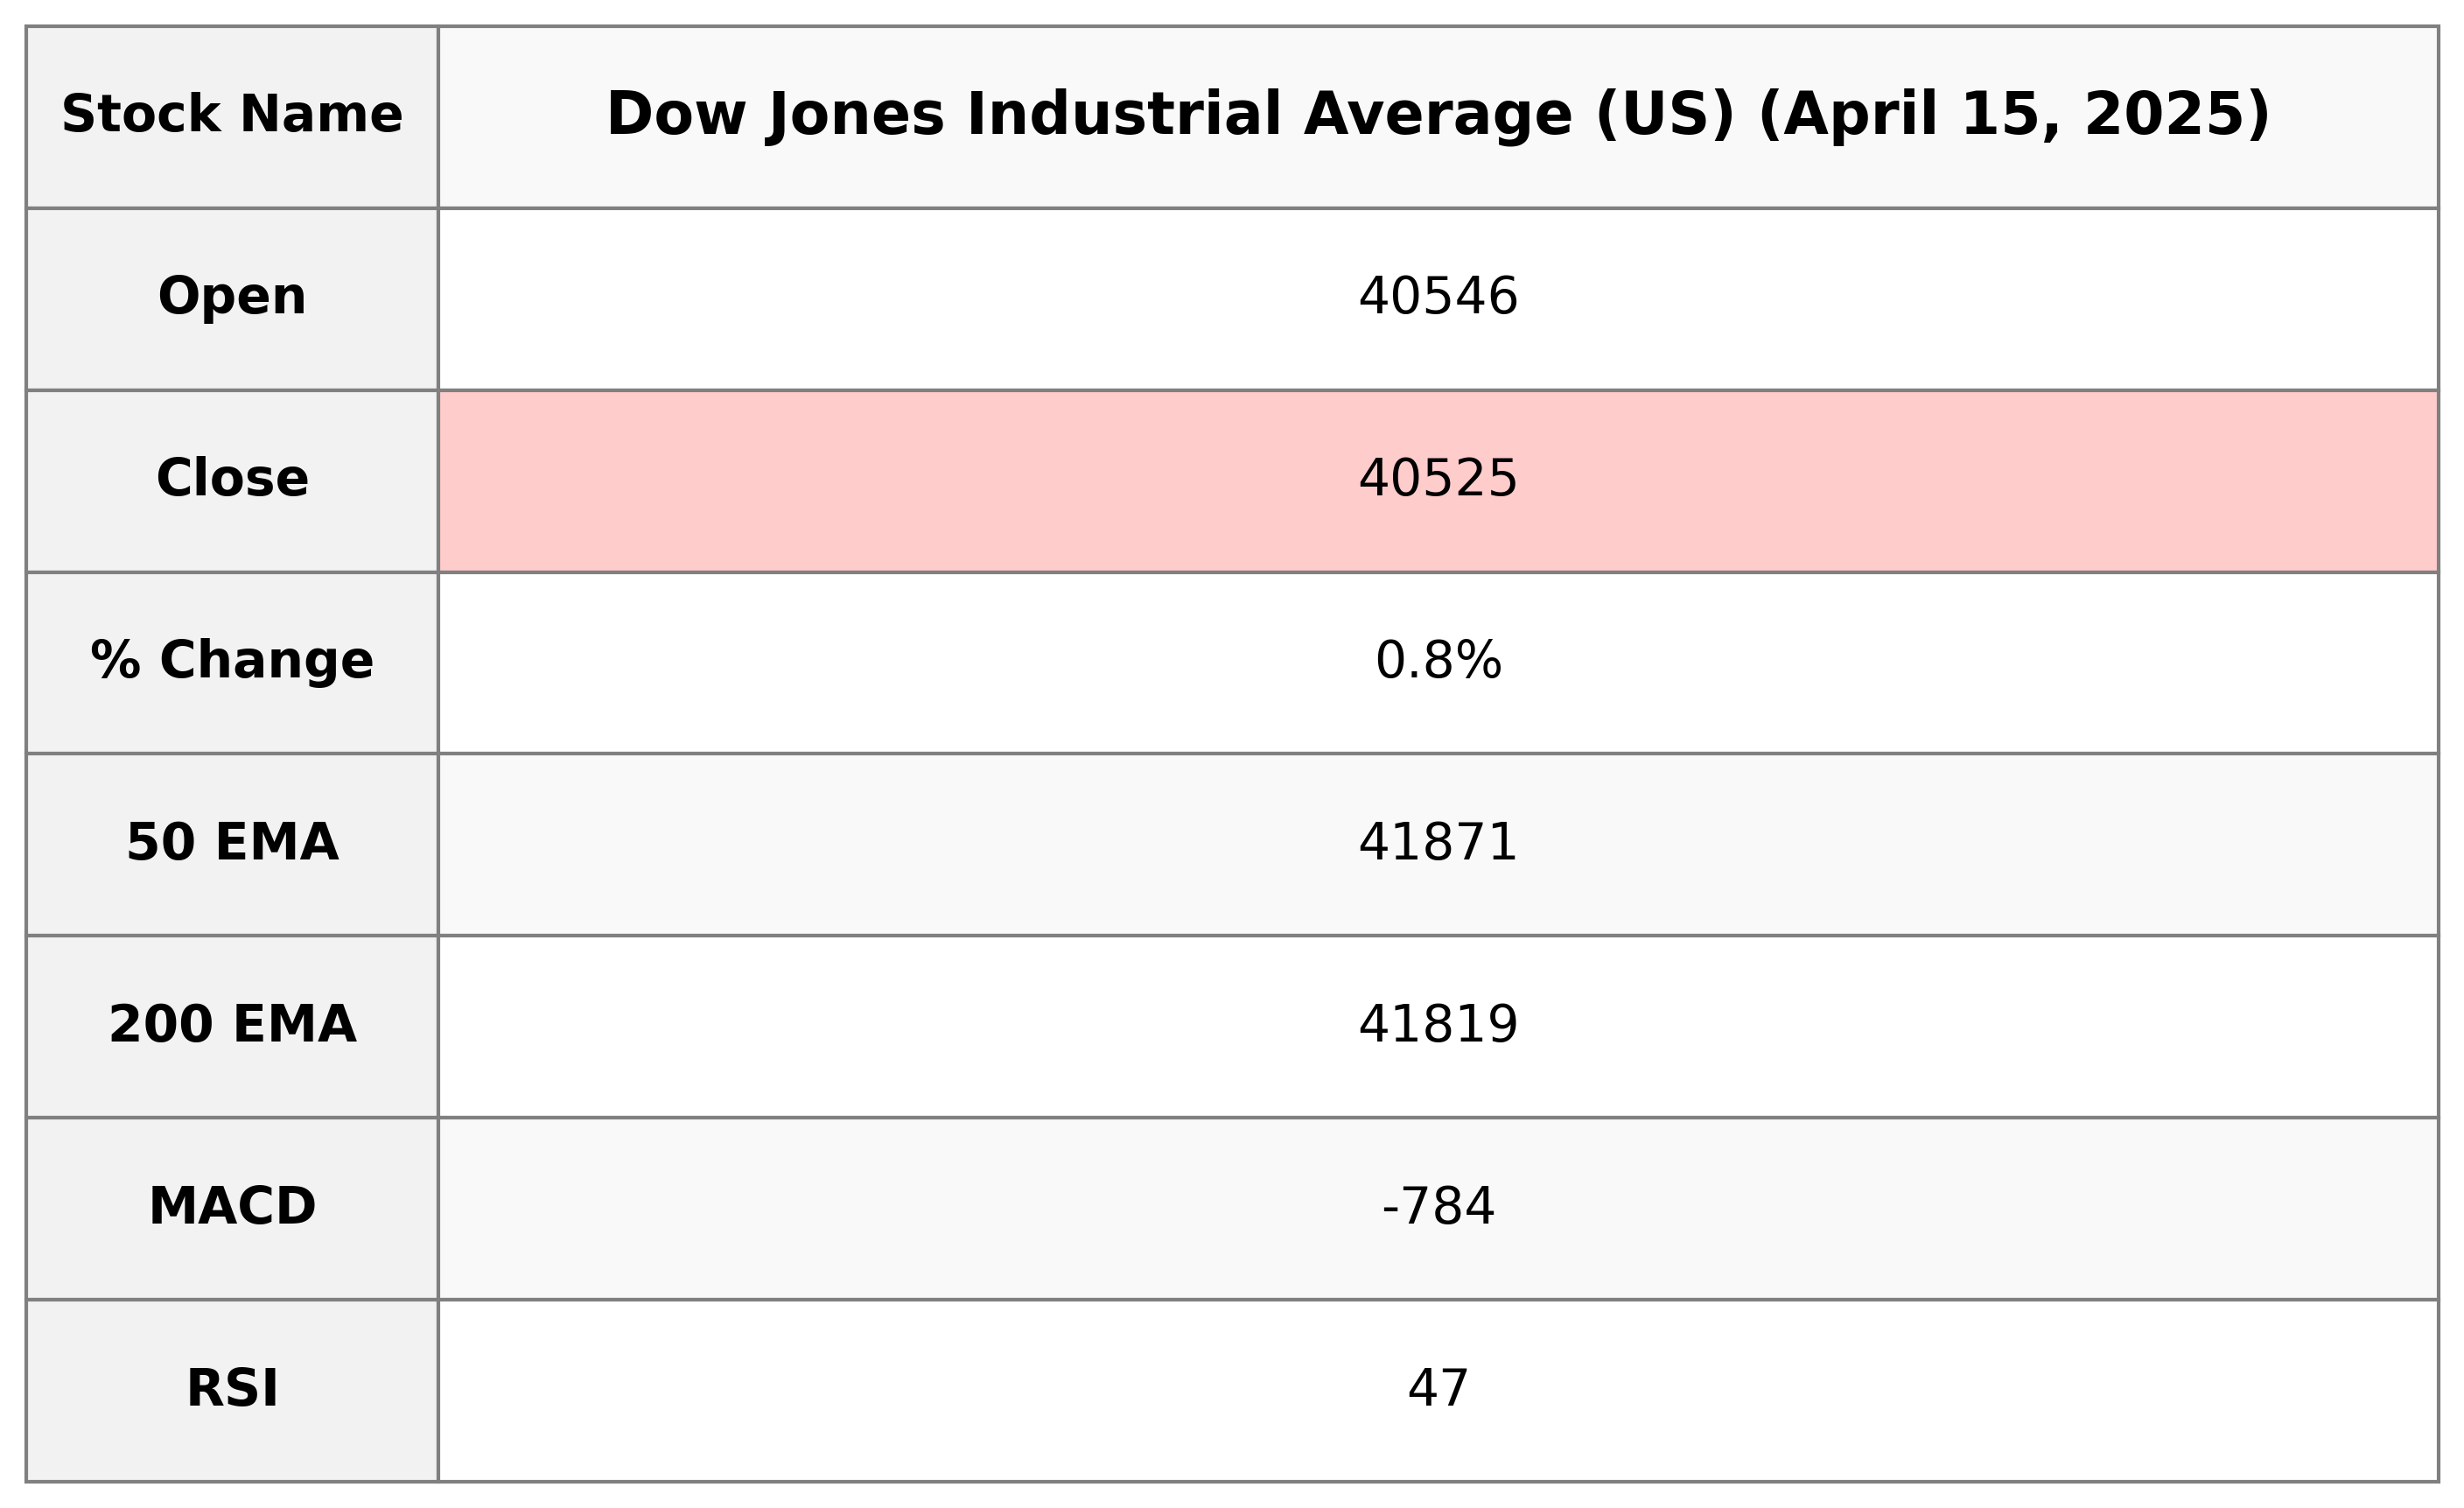
The Dow Jones Industrial Average (US) saw a slight increase, closing at 40,524.79, up from the previous close of 40,212.71, marking a change of 0.78%. Despite opening at 40,546.15 and reaching a high of 40,778.29, the index had a volatile session with a low of 40,159.02. The Relative Strength Index (RSI) is at 46.62, suggesting neutral market conditions, while the MACD indicates a bearish trend with a value of -784.09.
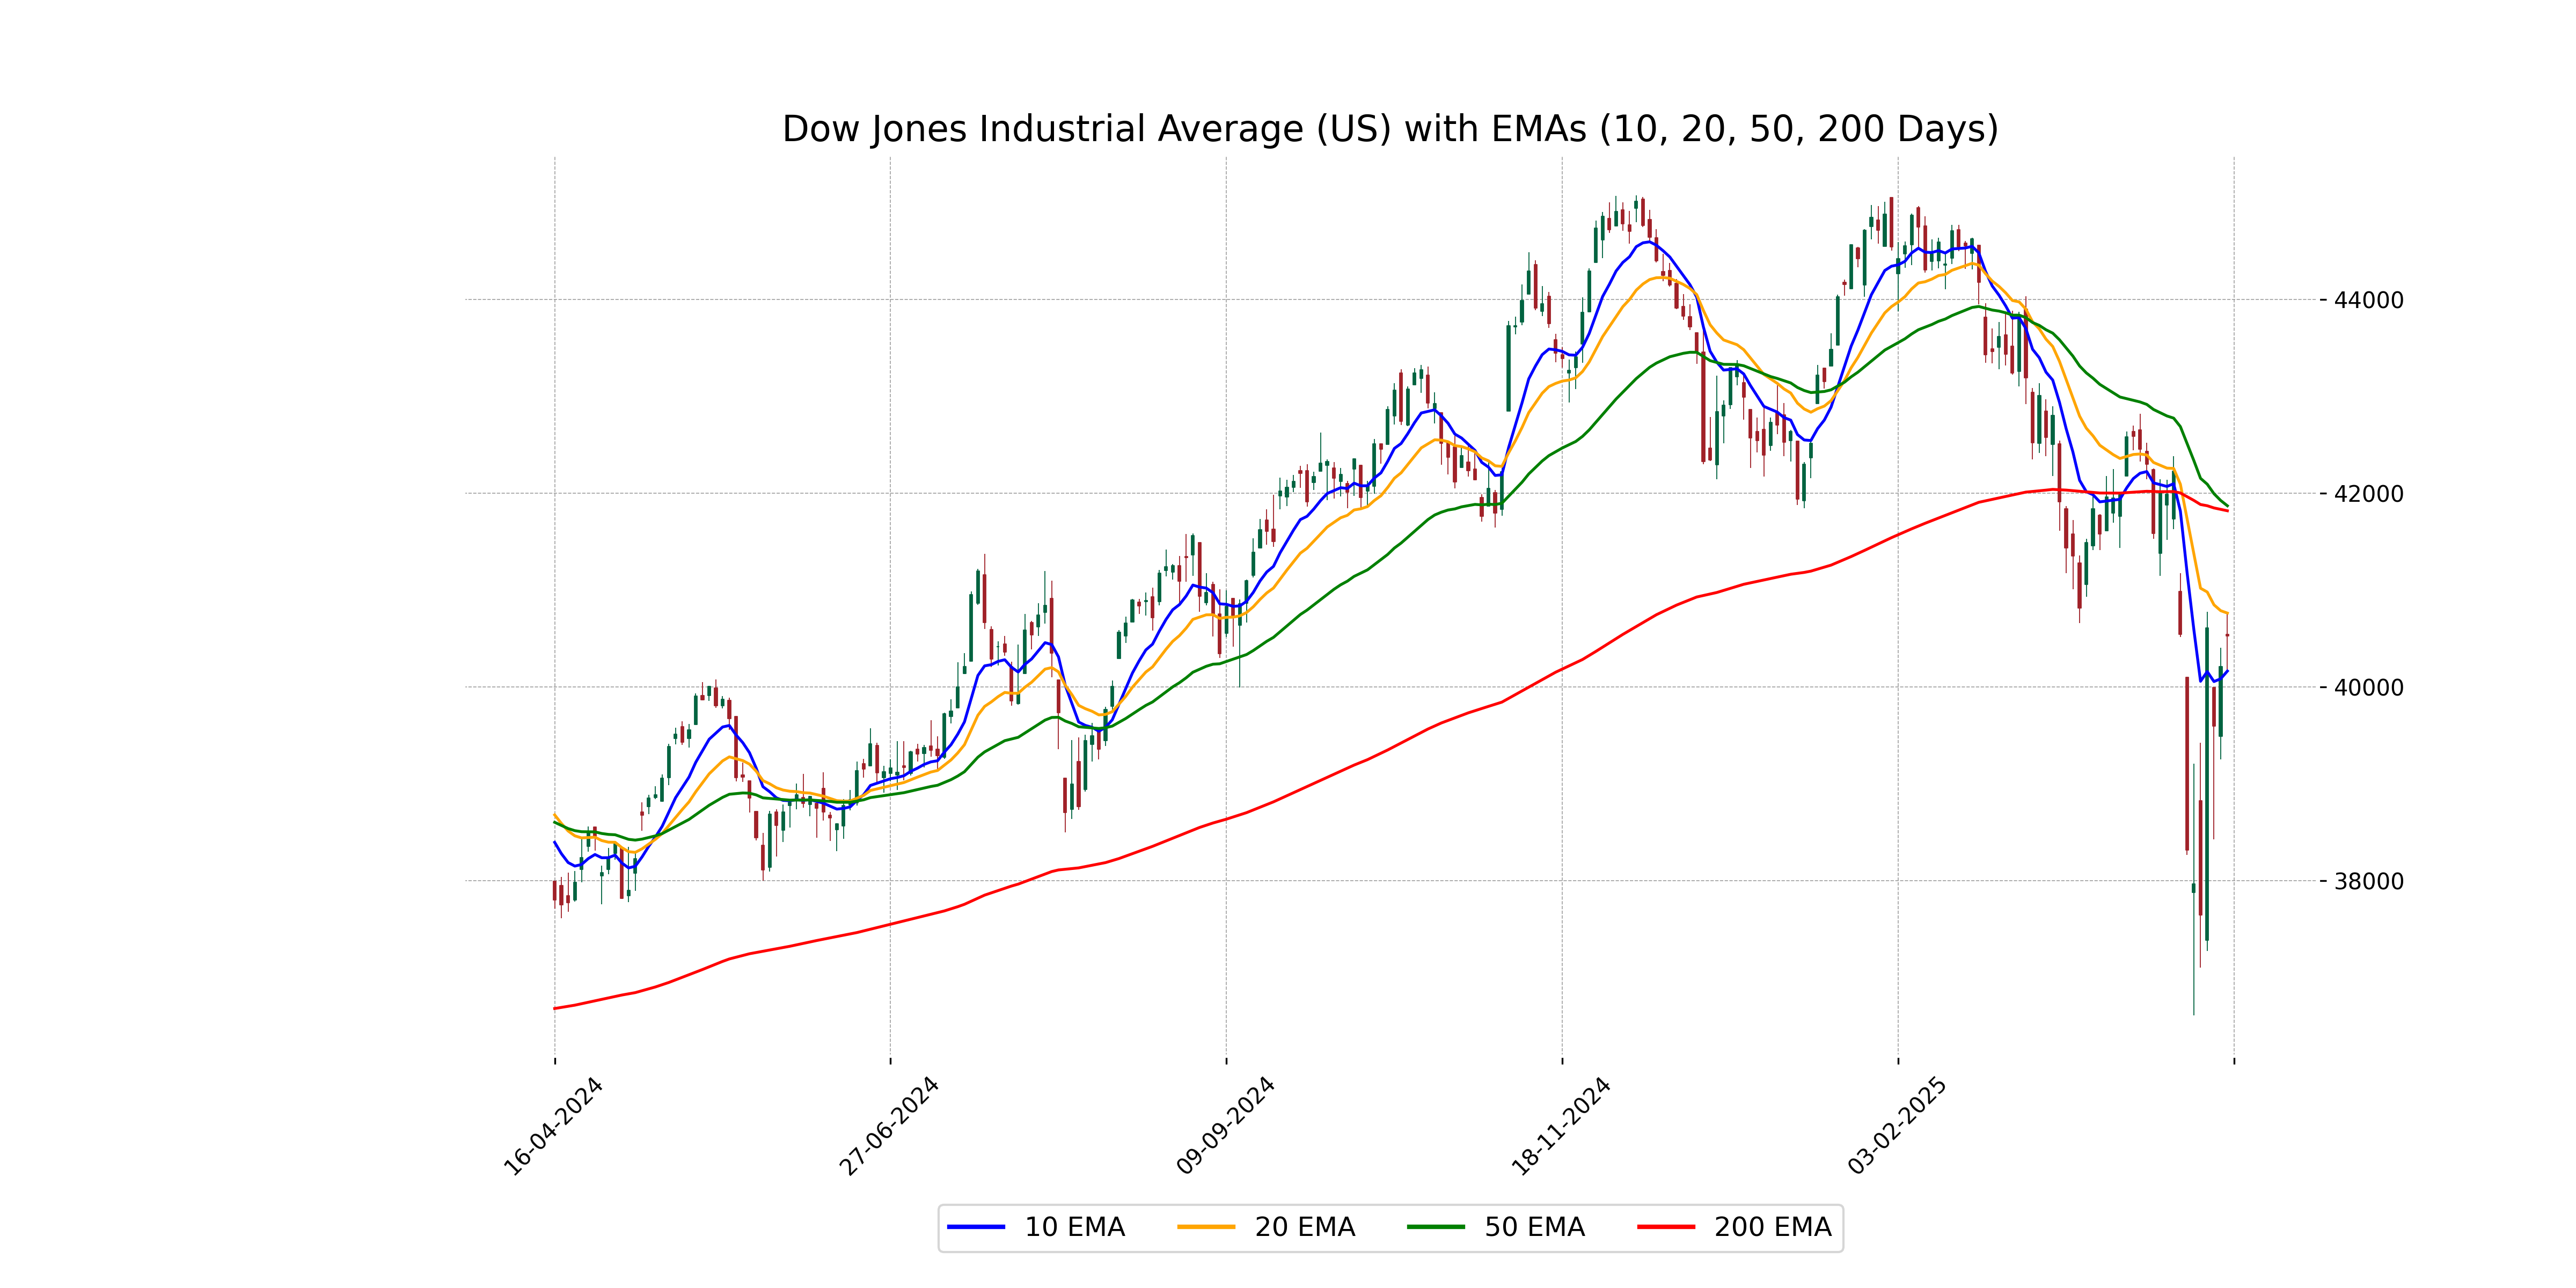
Relationship with Key Moving Averages
The Dow Jones Industrial Average opened above its 10 EMA at 40,546.15 and also closed above it at 40,524.79, indicating short-term bullish momentum. However, it remains below its 50 EMA (41,870.71) and 200 EMA (41,819.19), suggesting a potential resistance in the longer-term trend. The current RSI of 46.62 indicates a neutral momentum, while the MACD is below the signal line, reinforcing a caution for potential bearishness.
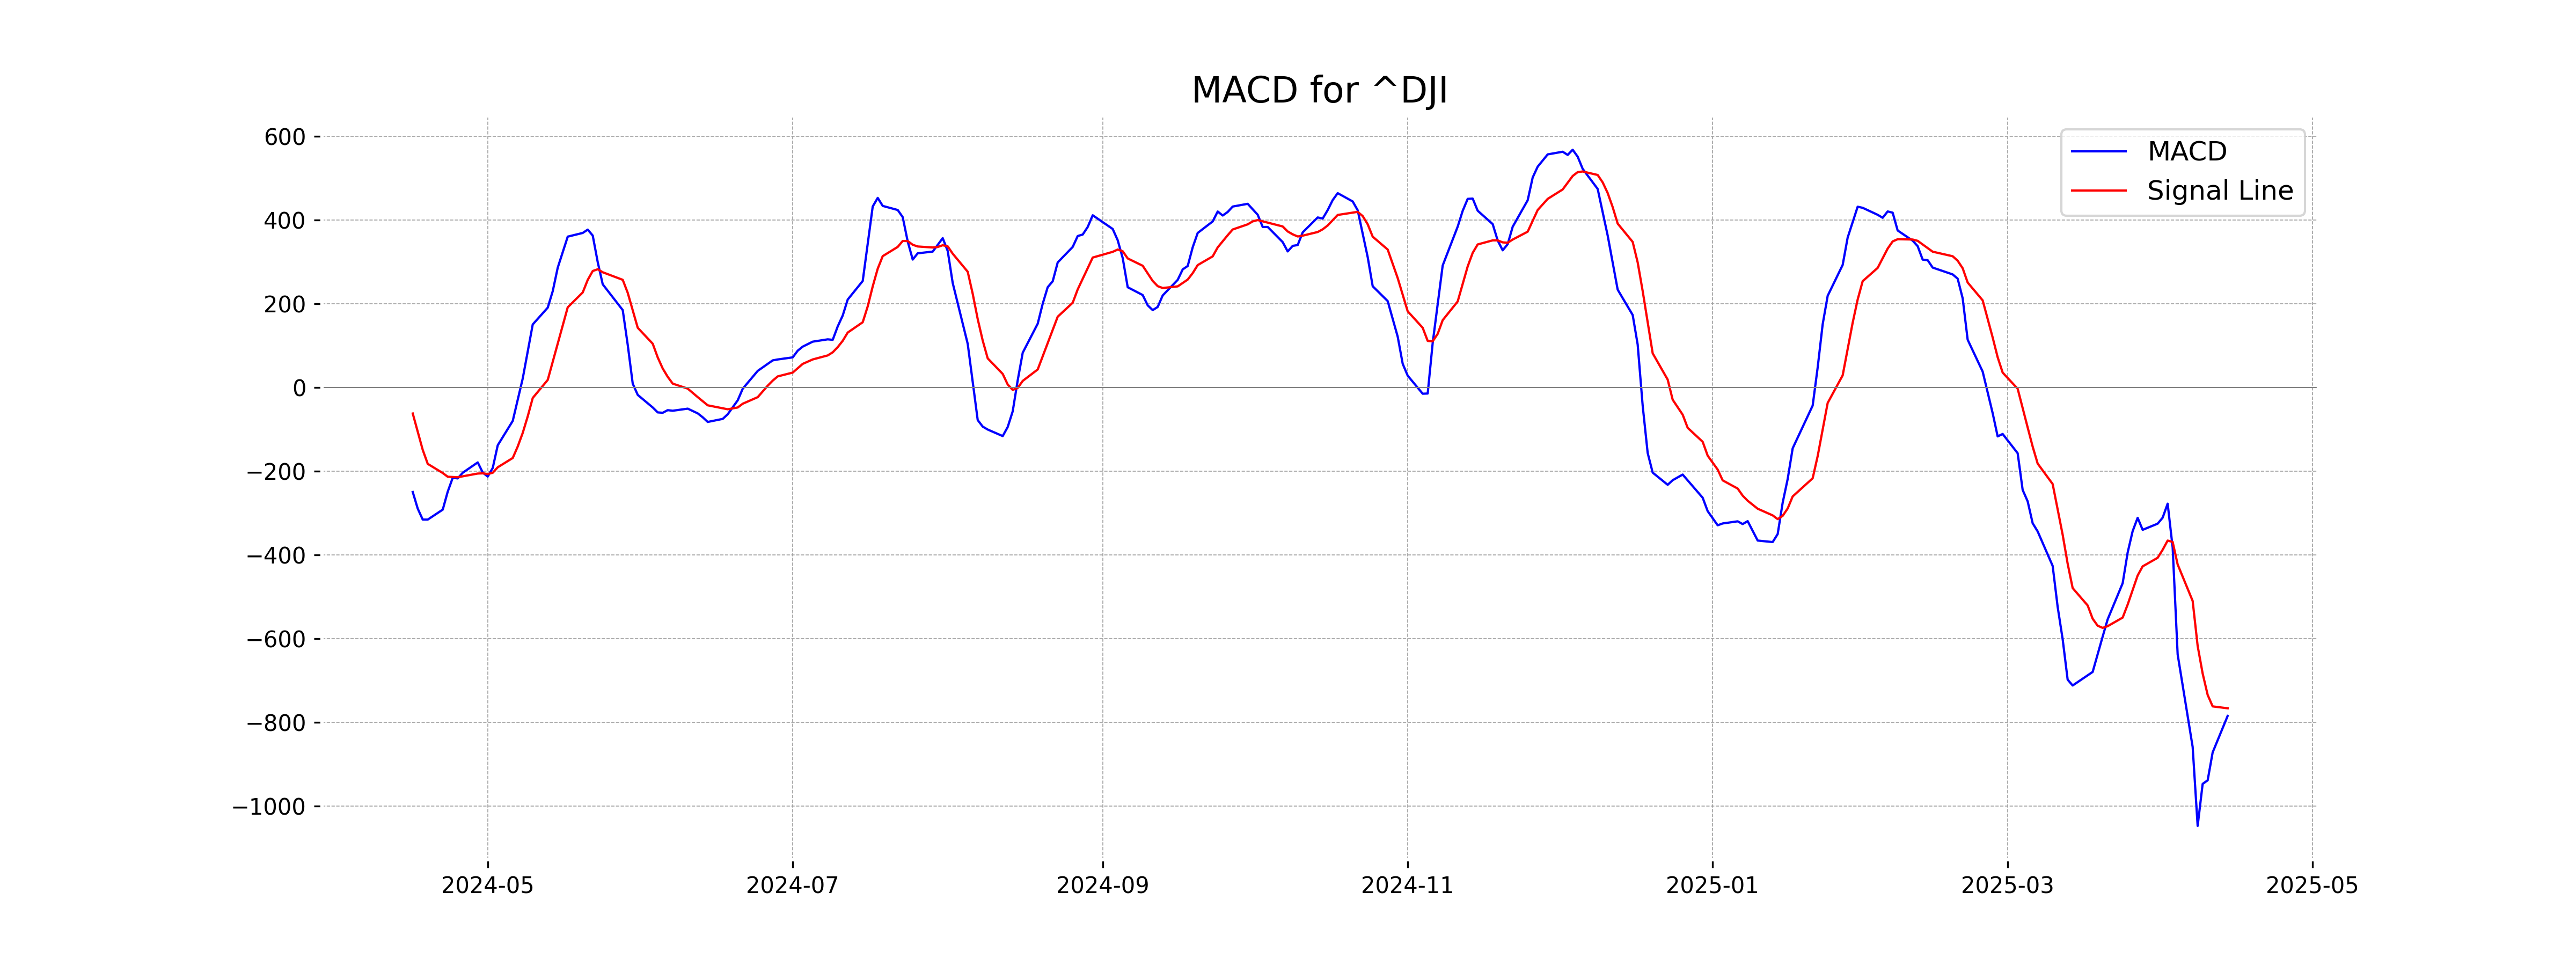
Moving Averages Trend (MACD)
The MACD for Dow Jones Industrial Average (US) is negative at -784.09, indicating a bearish trend. The MACD is below its signal line of -765.87, suggesting potential downward momentum. Monitor for changes to assess future movement.
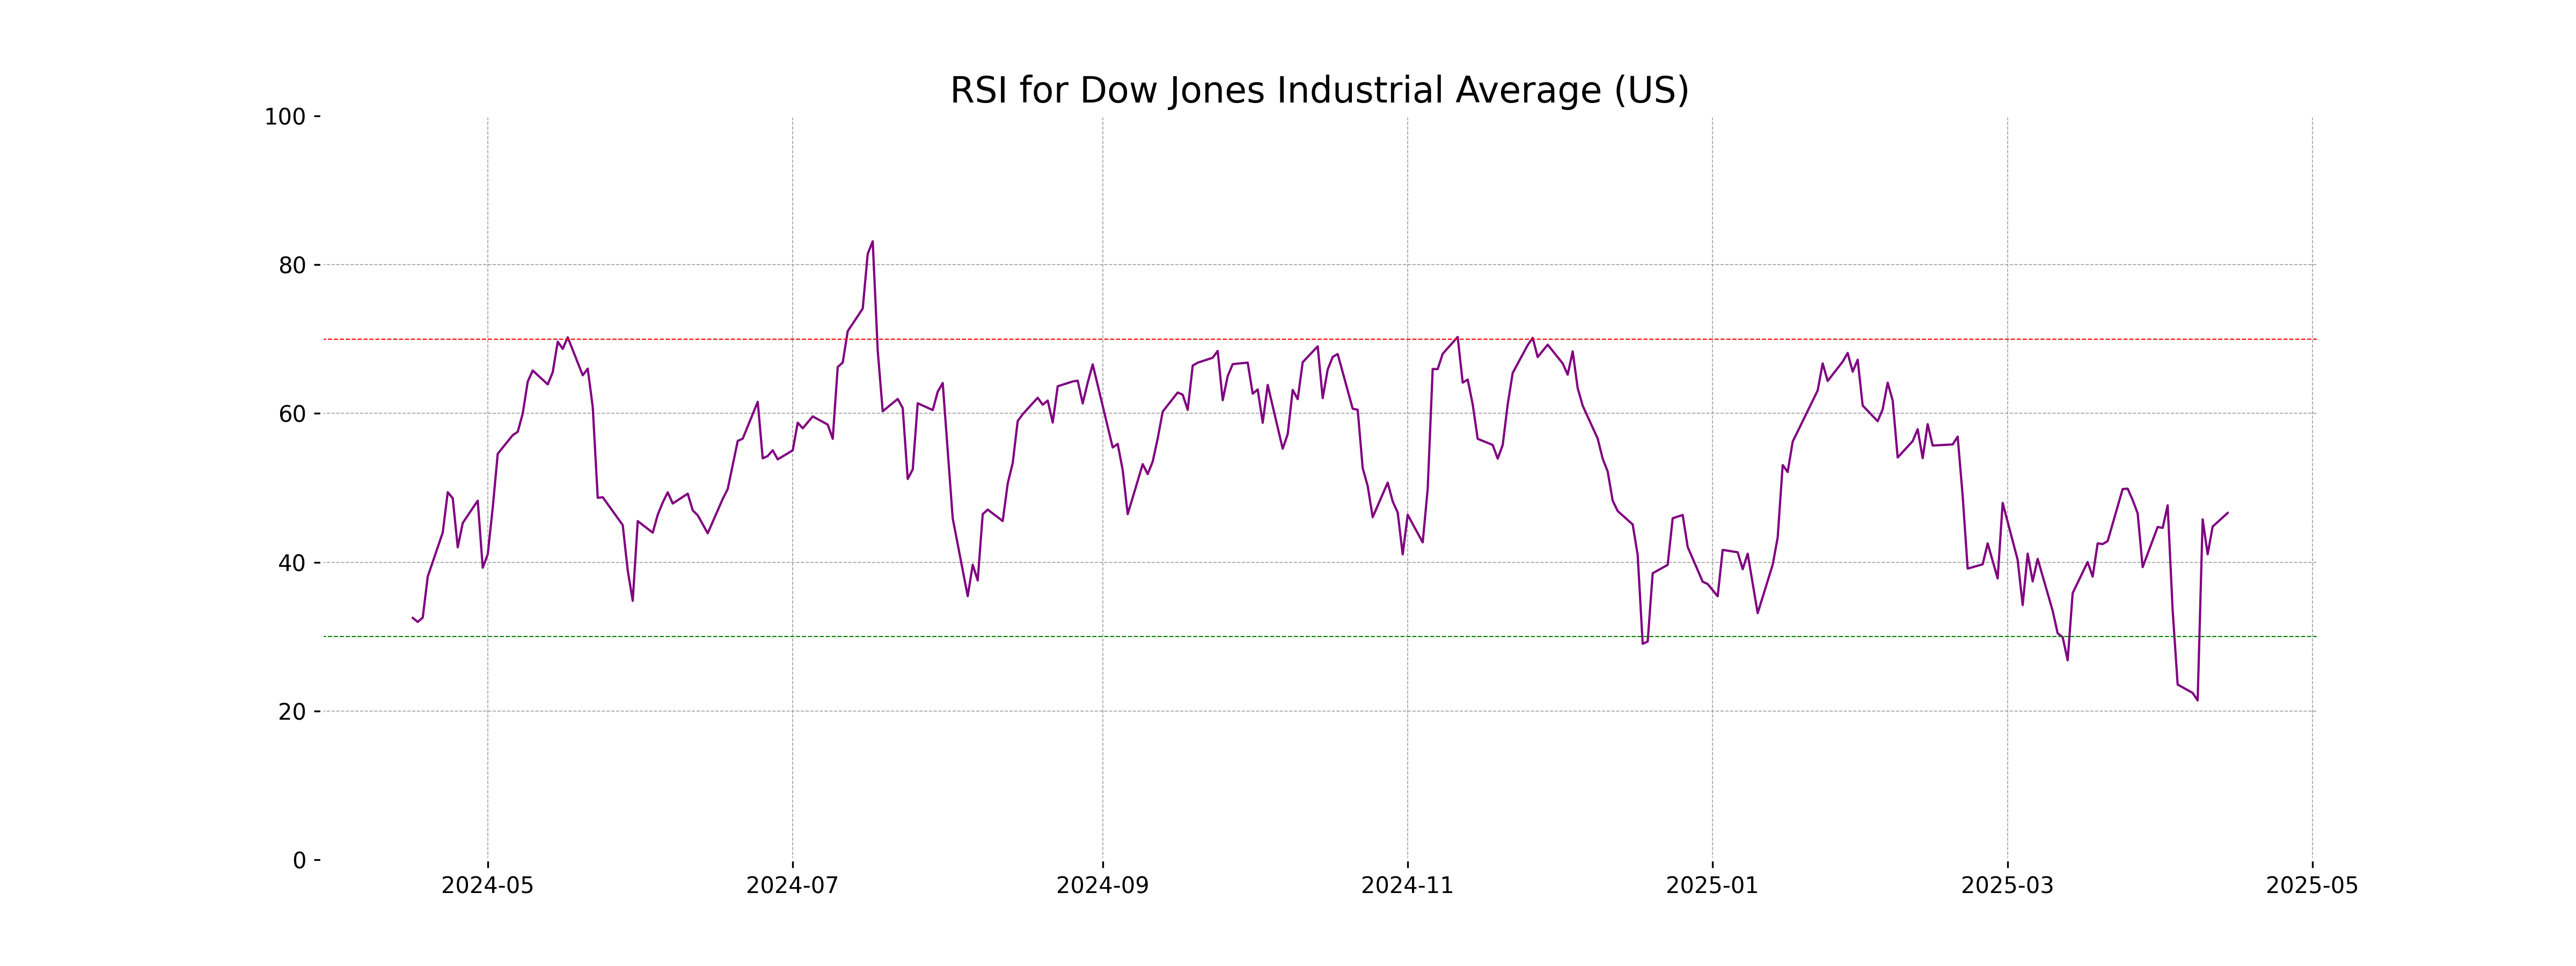
RSI Analysis
The RSI for the Dow Jones Industrial Average is 46.62, suggesting that the index is in a neutral zone, as it is below 70 but above 30. This indicates that the index is neither overbought nor oversold at the current level.
Analysis for CAC 40 (France) - April 15, 2025
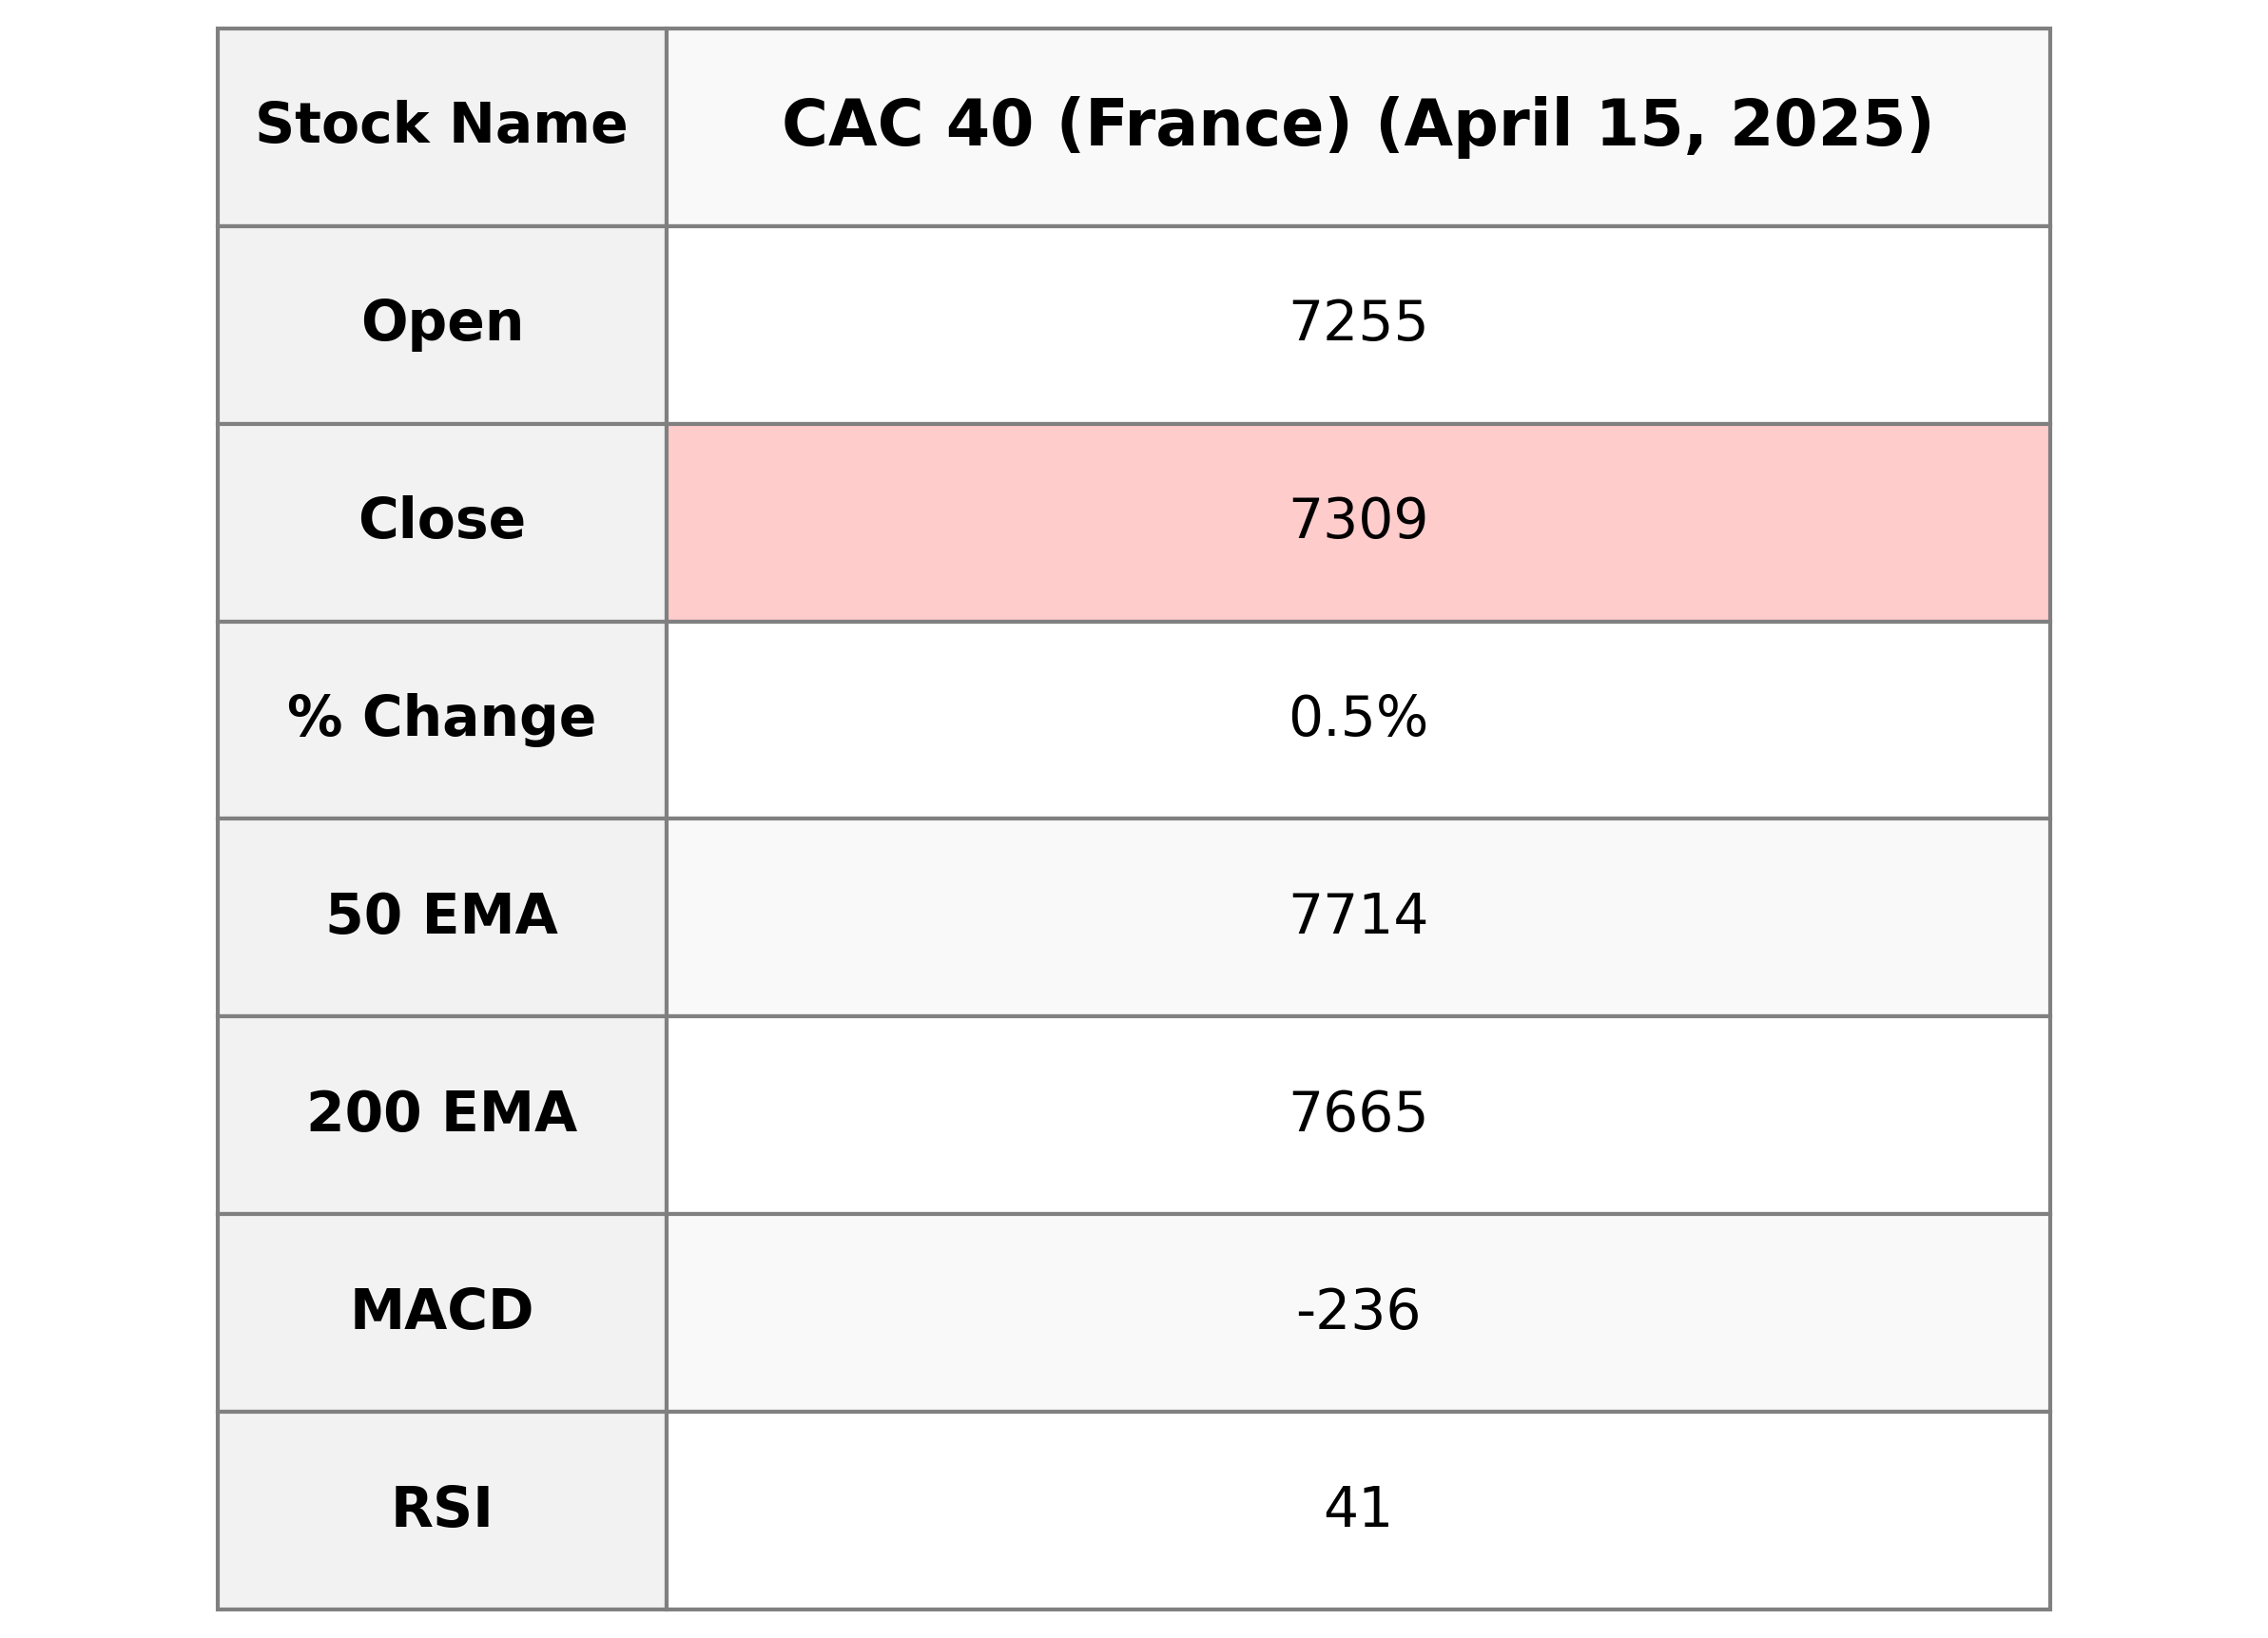
CAC 40 (France) Performance Overview: The CAC 40 index opened at 7,255.06 and closed at 7,309.05, marking a percentage change of 0.49% and a points change of 35.93. The Relative Strength Index (RSI) is at 41.09, indicating weaker momentum, and the MACD shows a negative value of -235.98, suggesting a bearish trend in comparison to the MACD signal. The trading volume for the day was recorded as 0.0, and there is insufficient data on market cap and earnings.
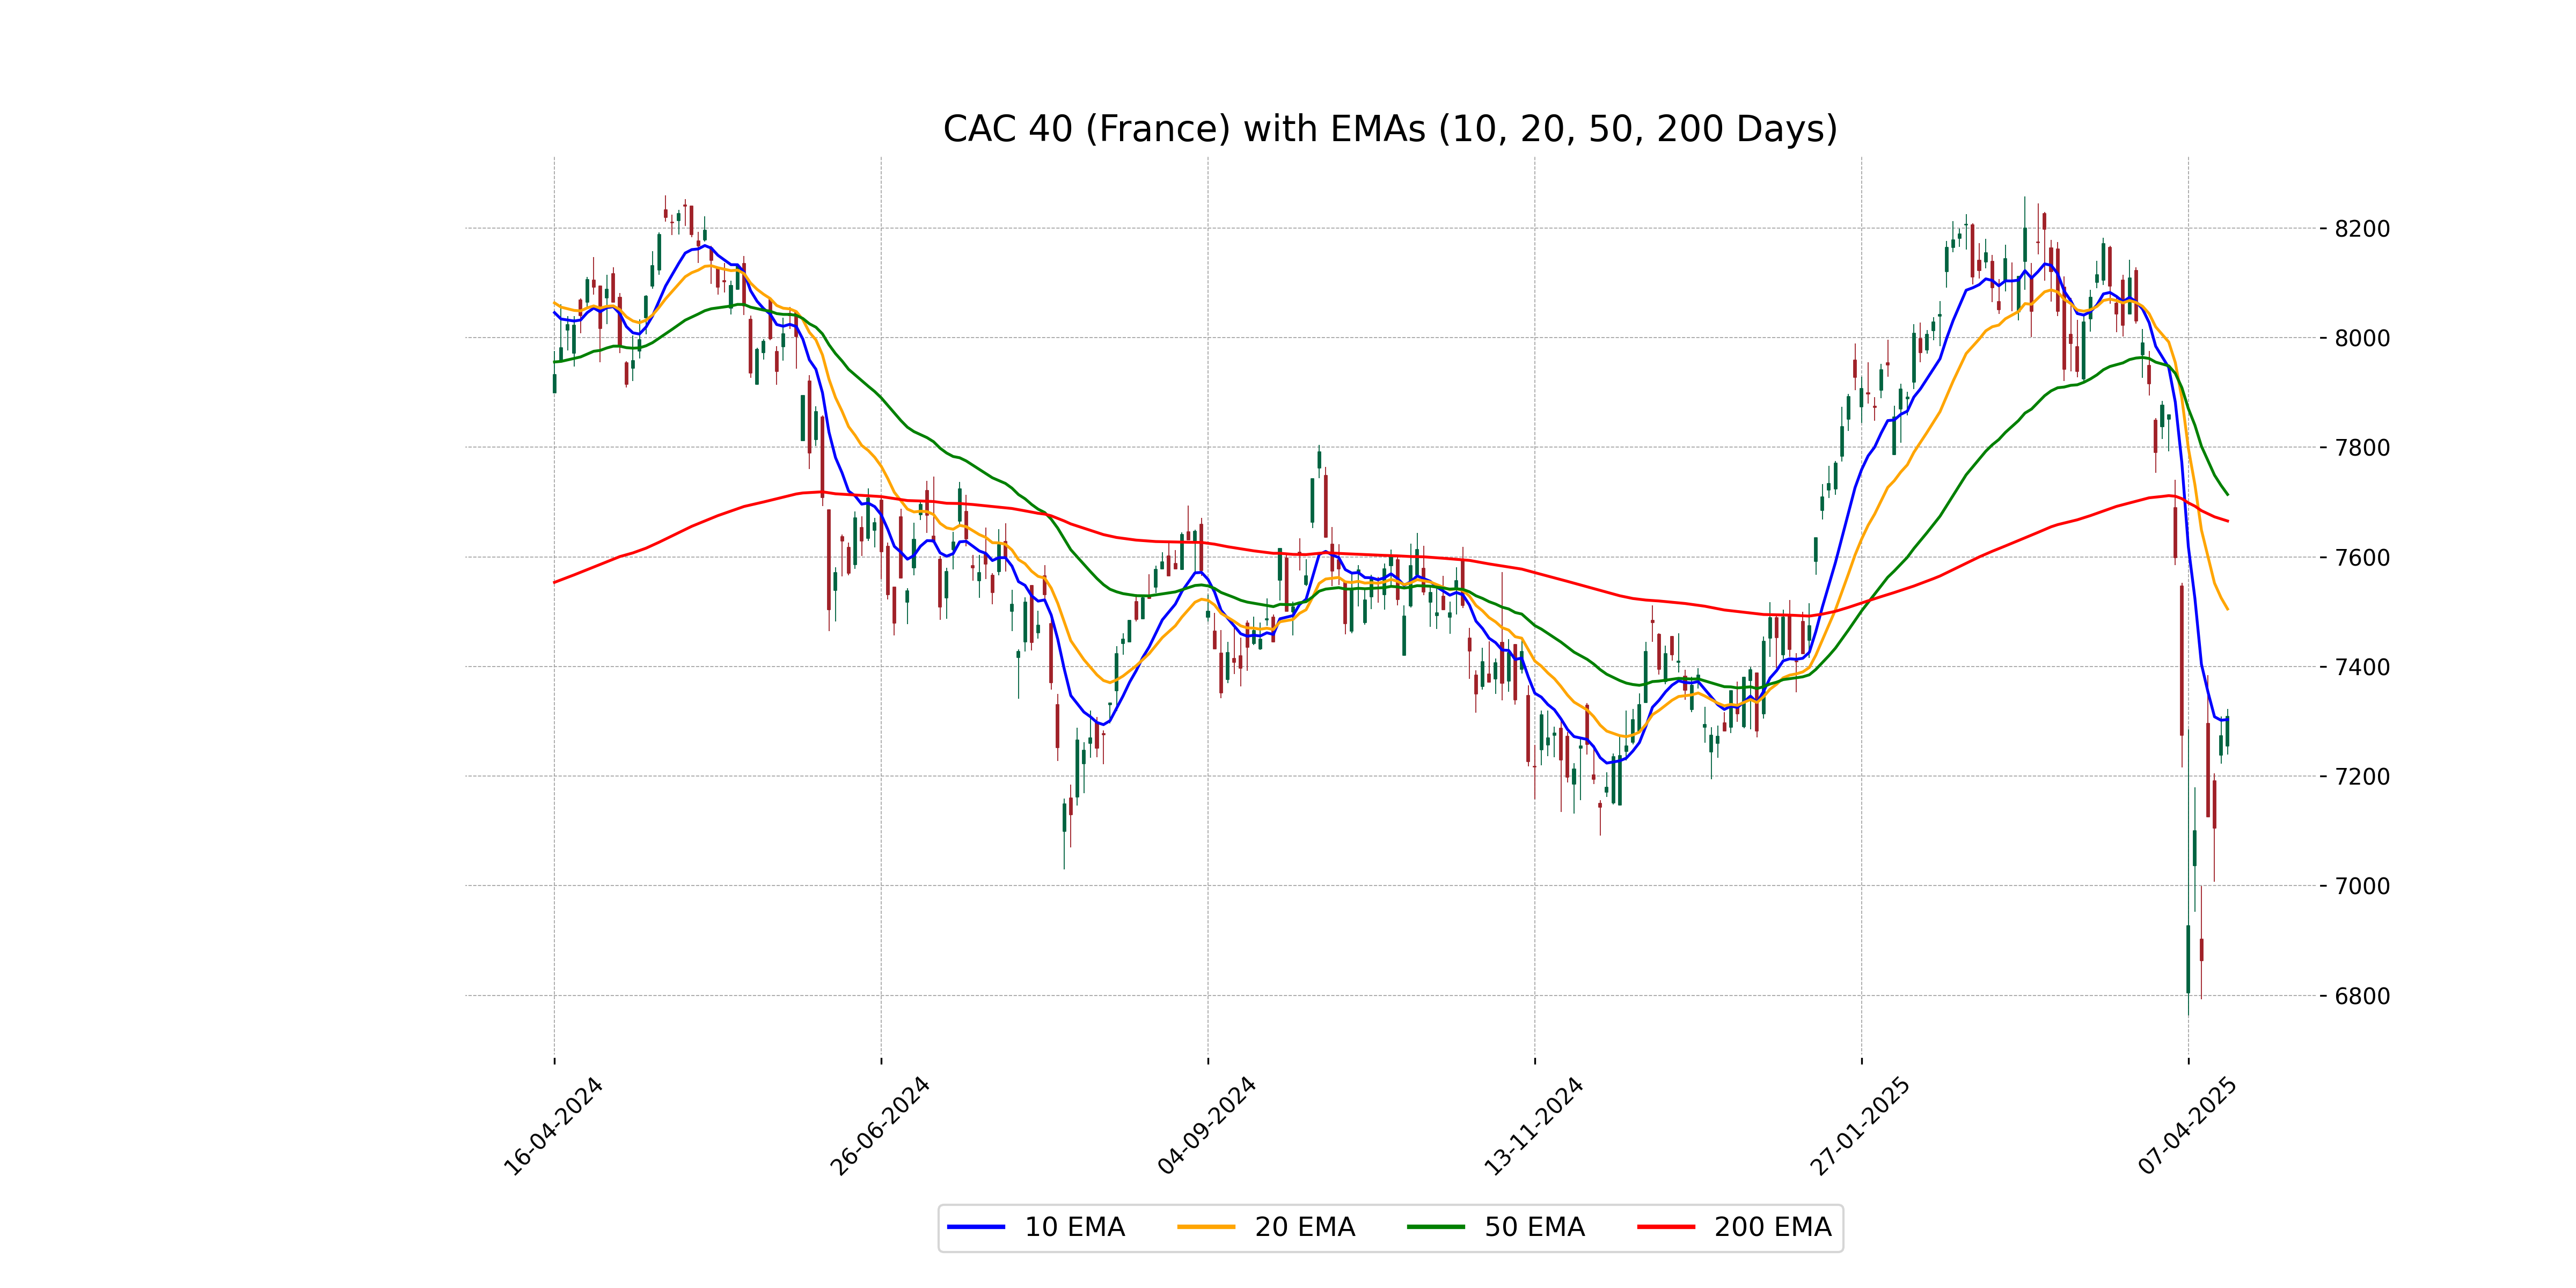
Relationship with Key Moving Averages
The CAC 40 is currently trading below its 50 EMA and 200 EMA, indicating a potential bearish trend. The current price is slightly above the 10 EMA but well below the 20 EMA, suggesting recent positive momentum hasn't fully shifted the overall trend upwards.
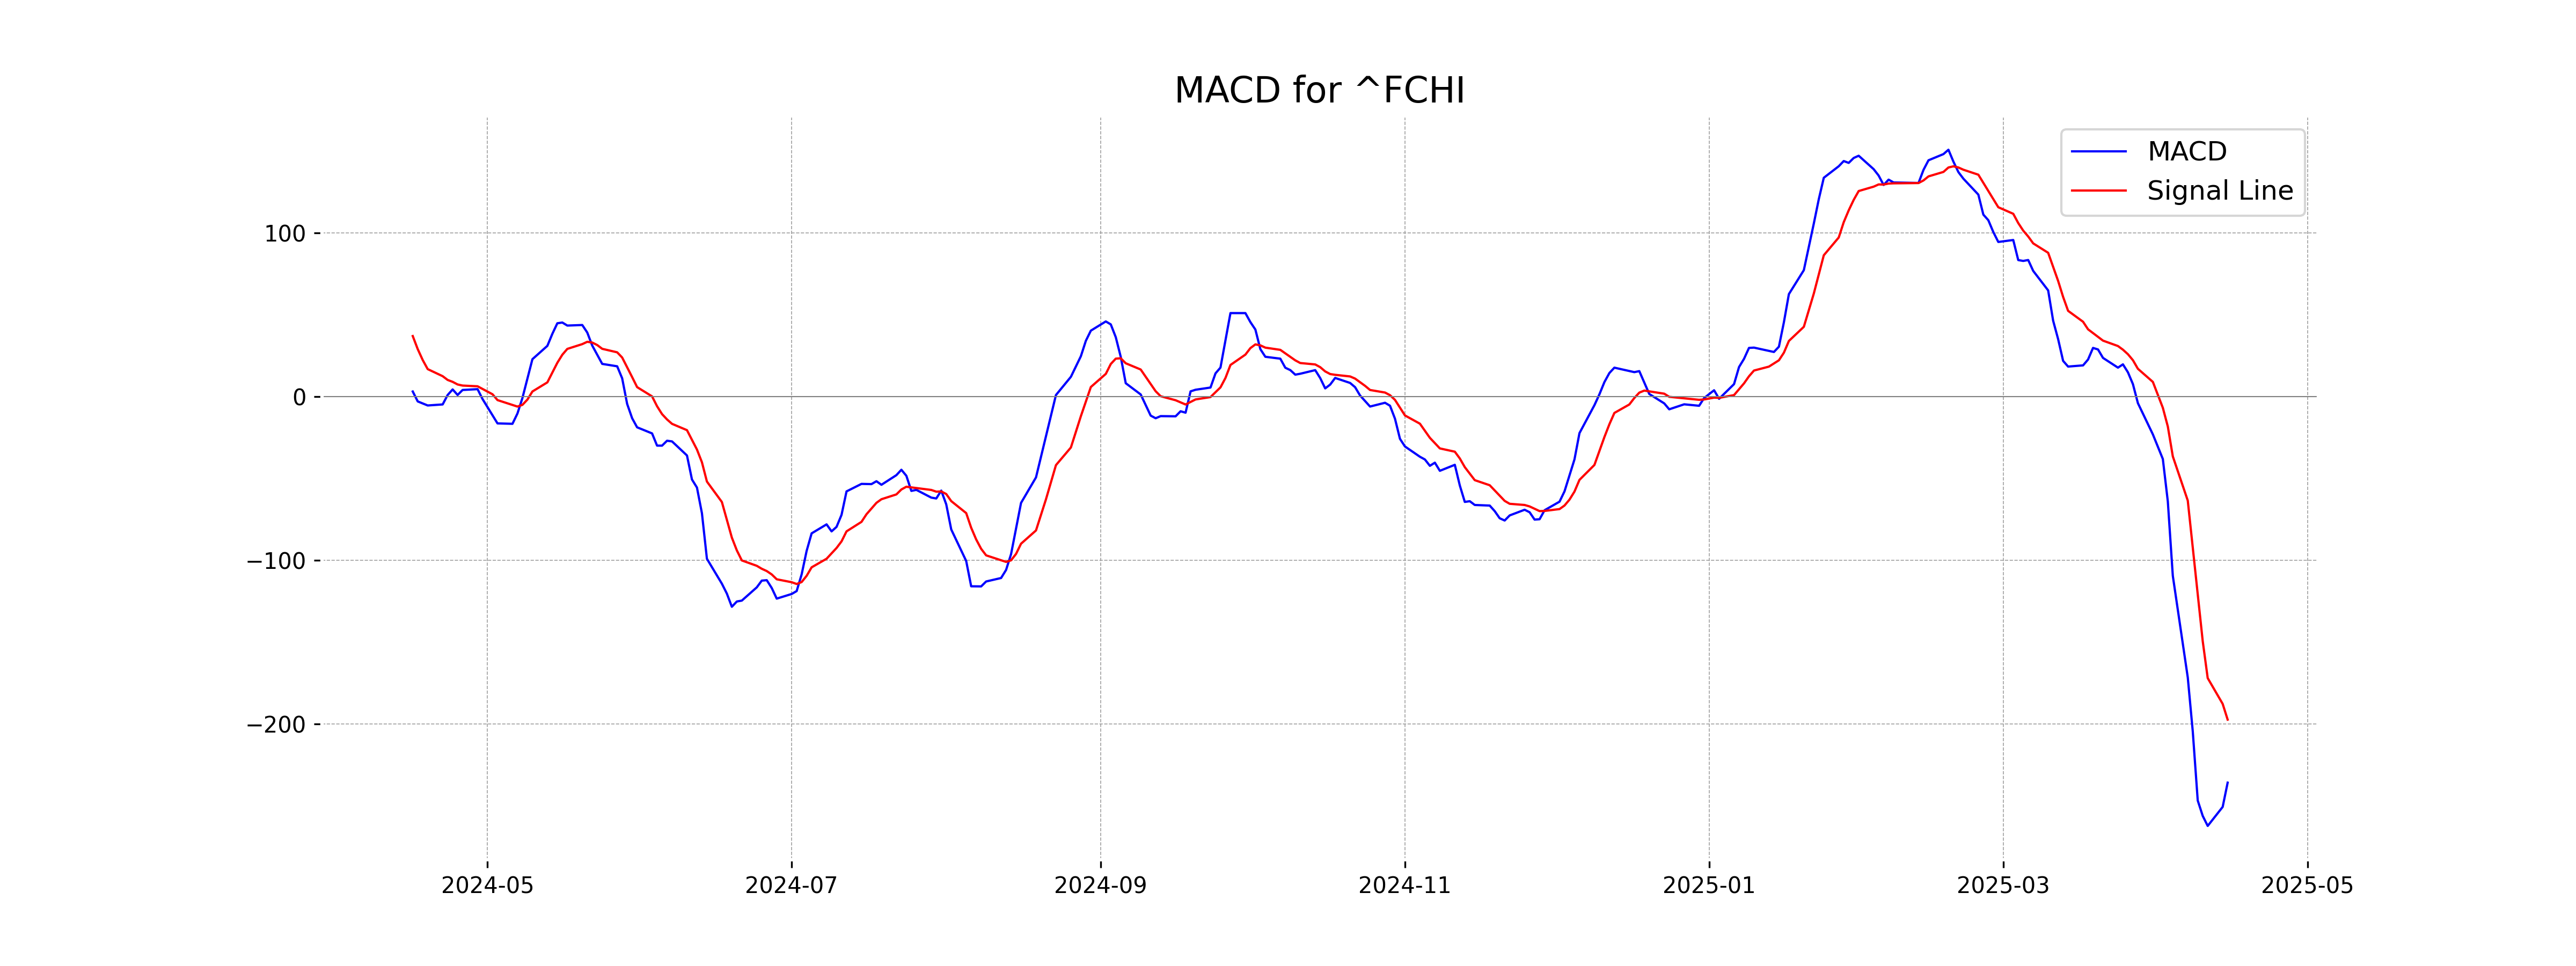
Moving Averages Trend (MACD)
CAC 40 (France) MACD Analysis: The MACD value for CAC 40 is -235.98, which is below the MACD Signal line of -197.46. This suggests a bearish momentum, as the MACD is typically used to identify trends and the difference indicates a strong downward trend currently.
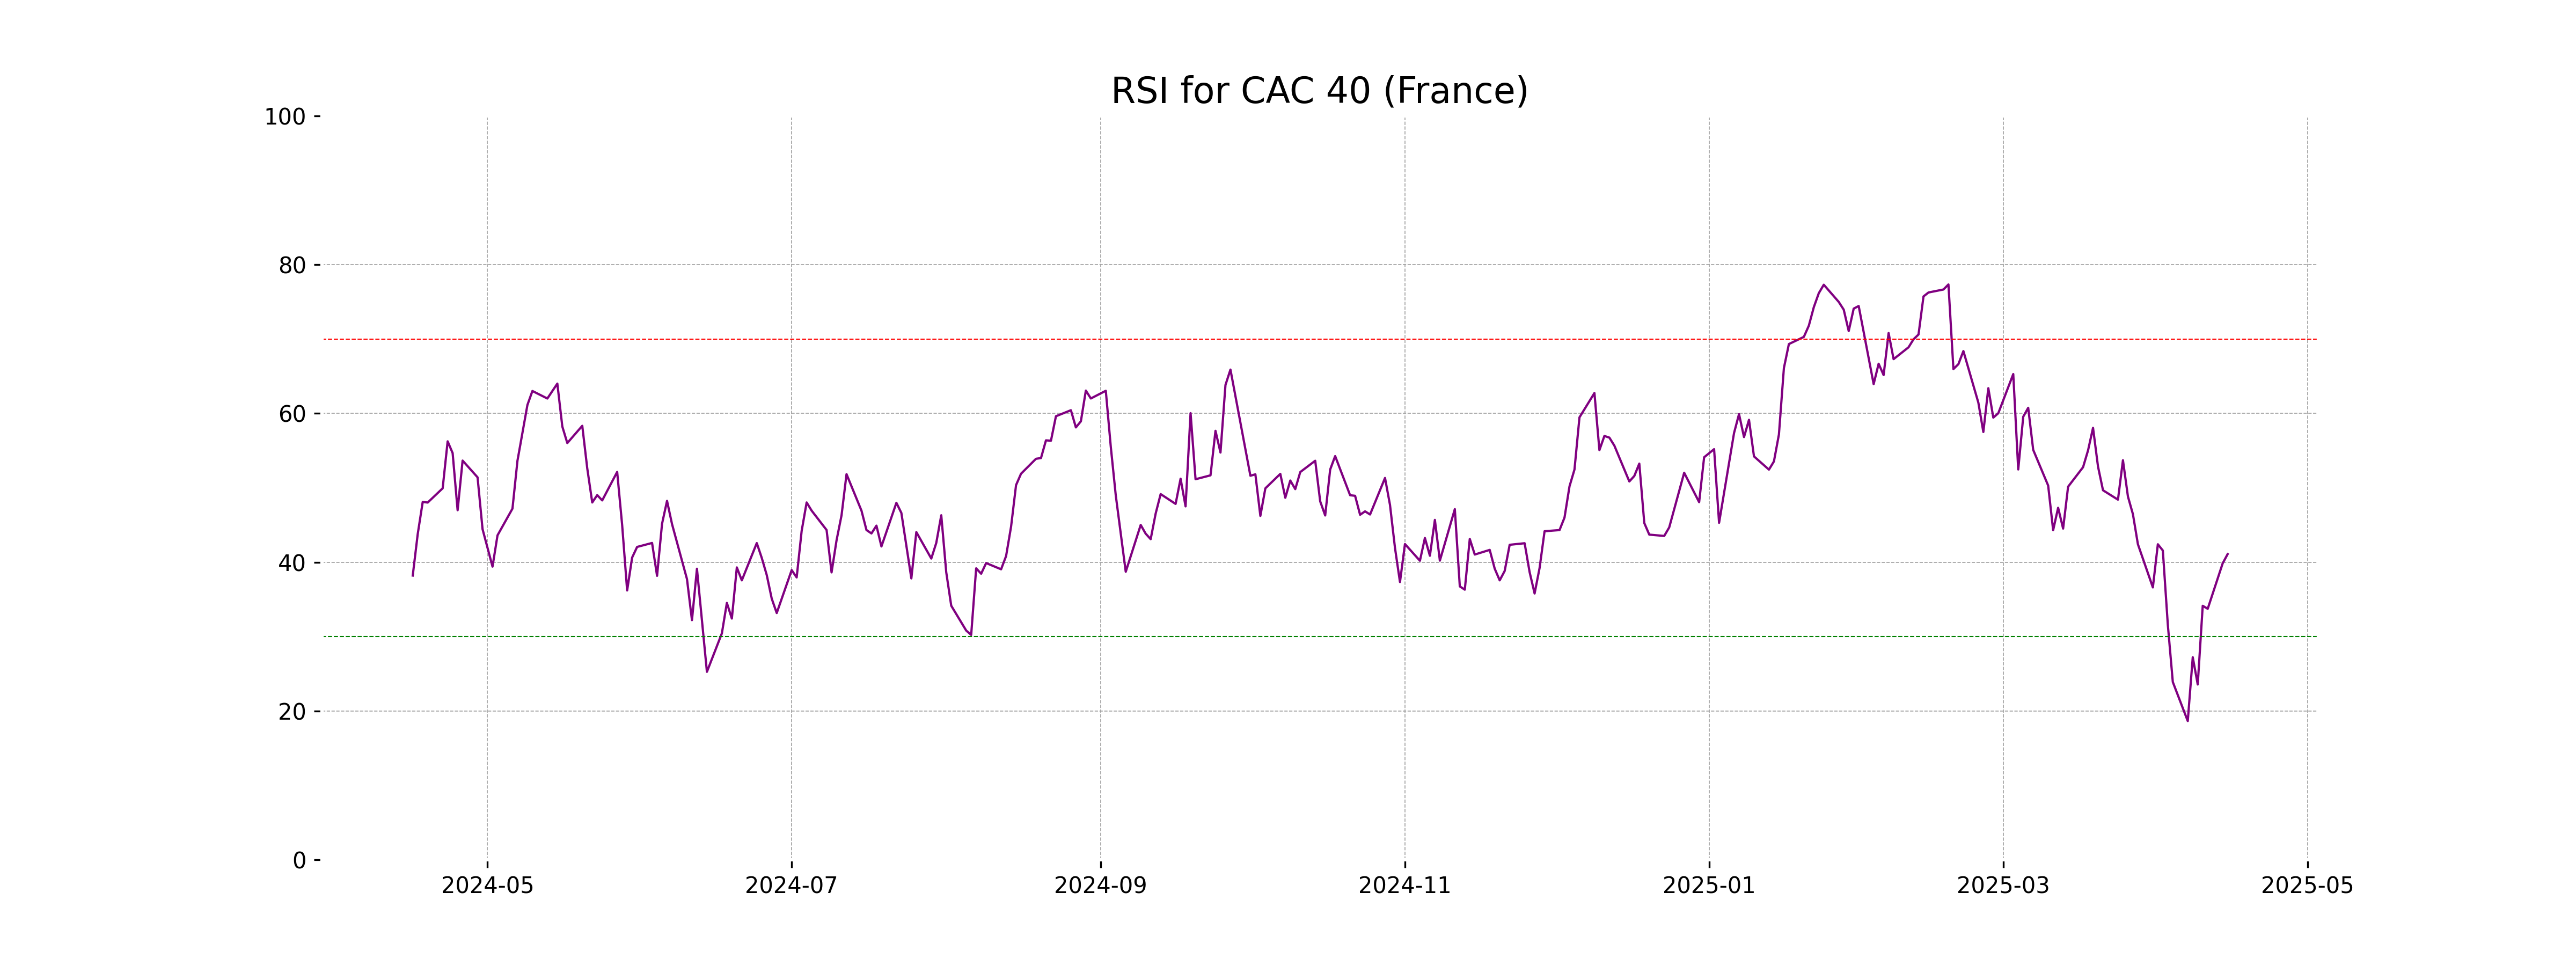
RSI Analysis
The Relative Strength Index (RSI) for CAC 40 (France) is 41.09, indicating that the index is currently in a neutral zone. Typically, an RSI reading below 30 suggests that an asset is oversold, while a reading above 70 indicates that it is overbought. Based on the current RSI, the CAC 40 is neither oversold nor overbought, suggesting a balanced momentum in the market.
Analysis for FTSE 100 (UK) - April 15, 2025
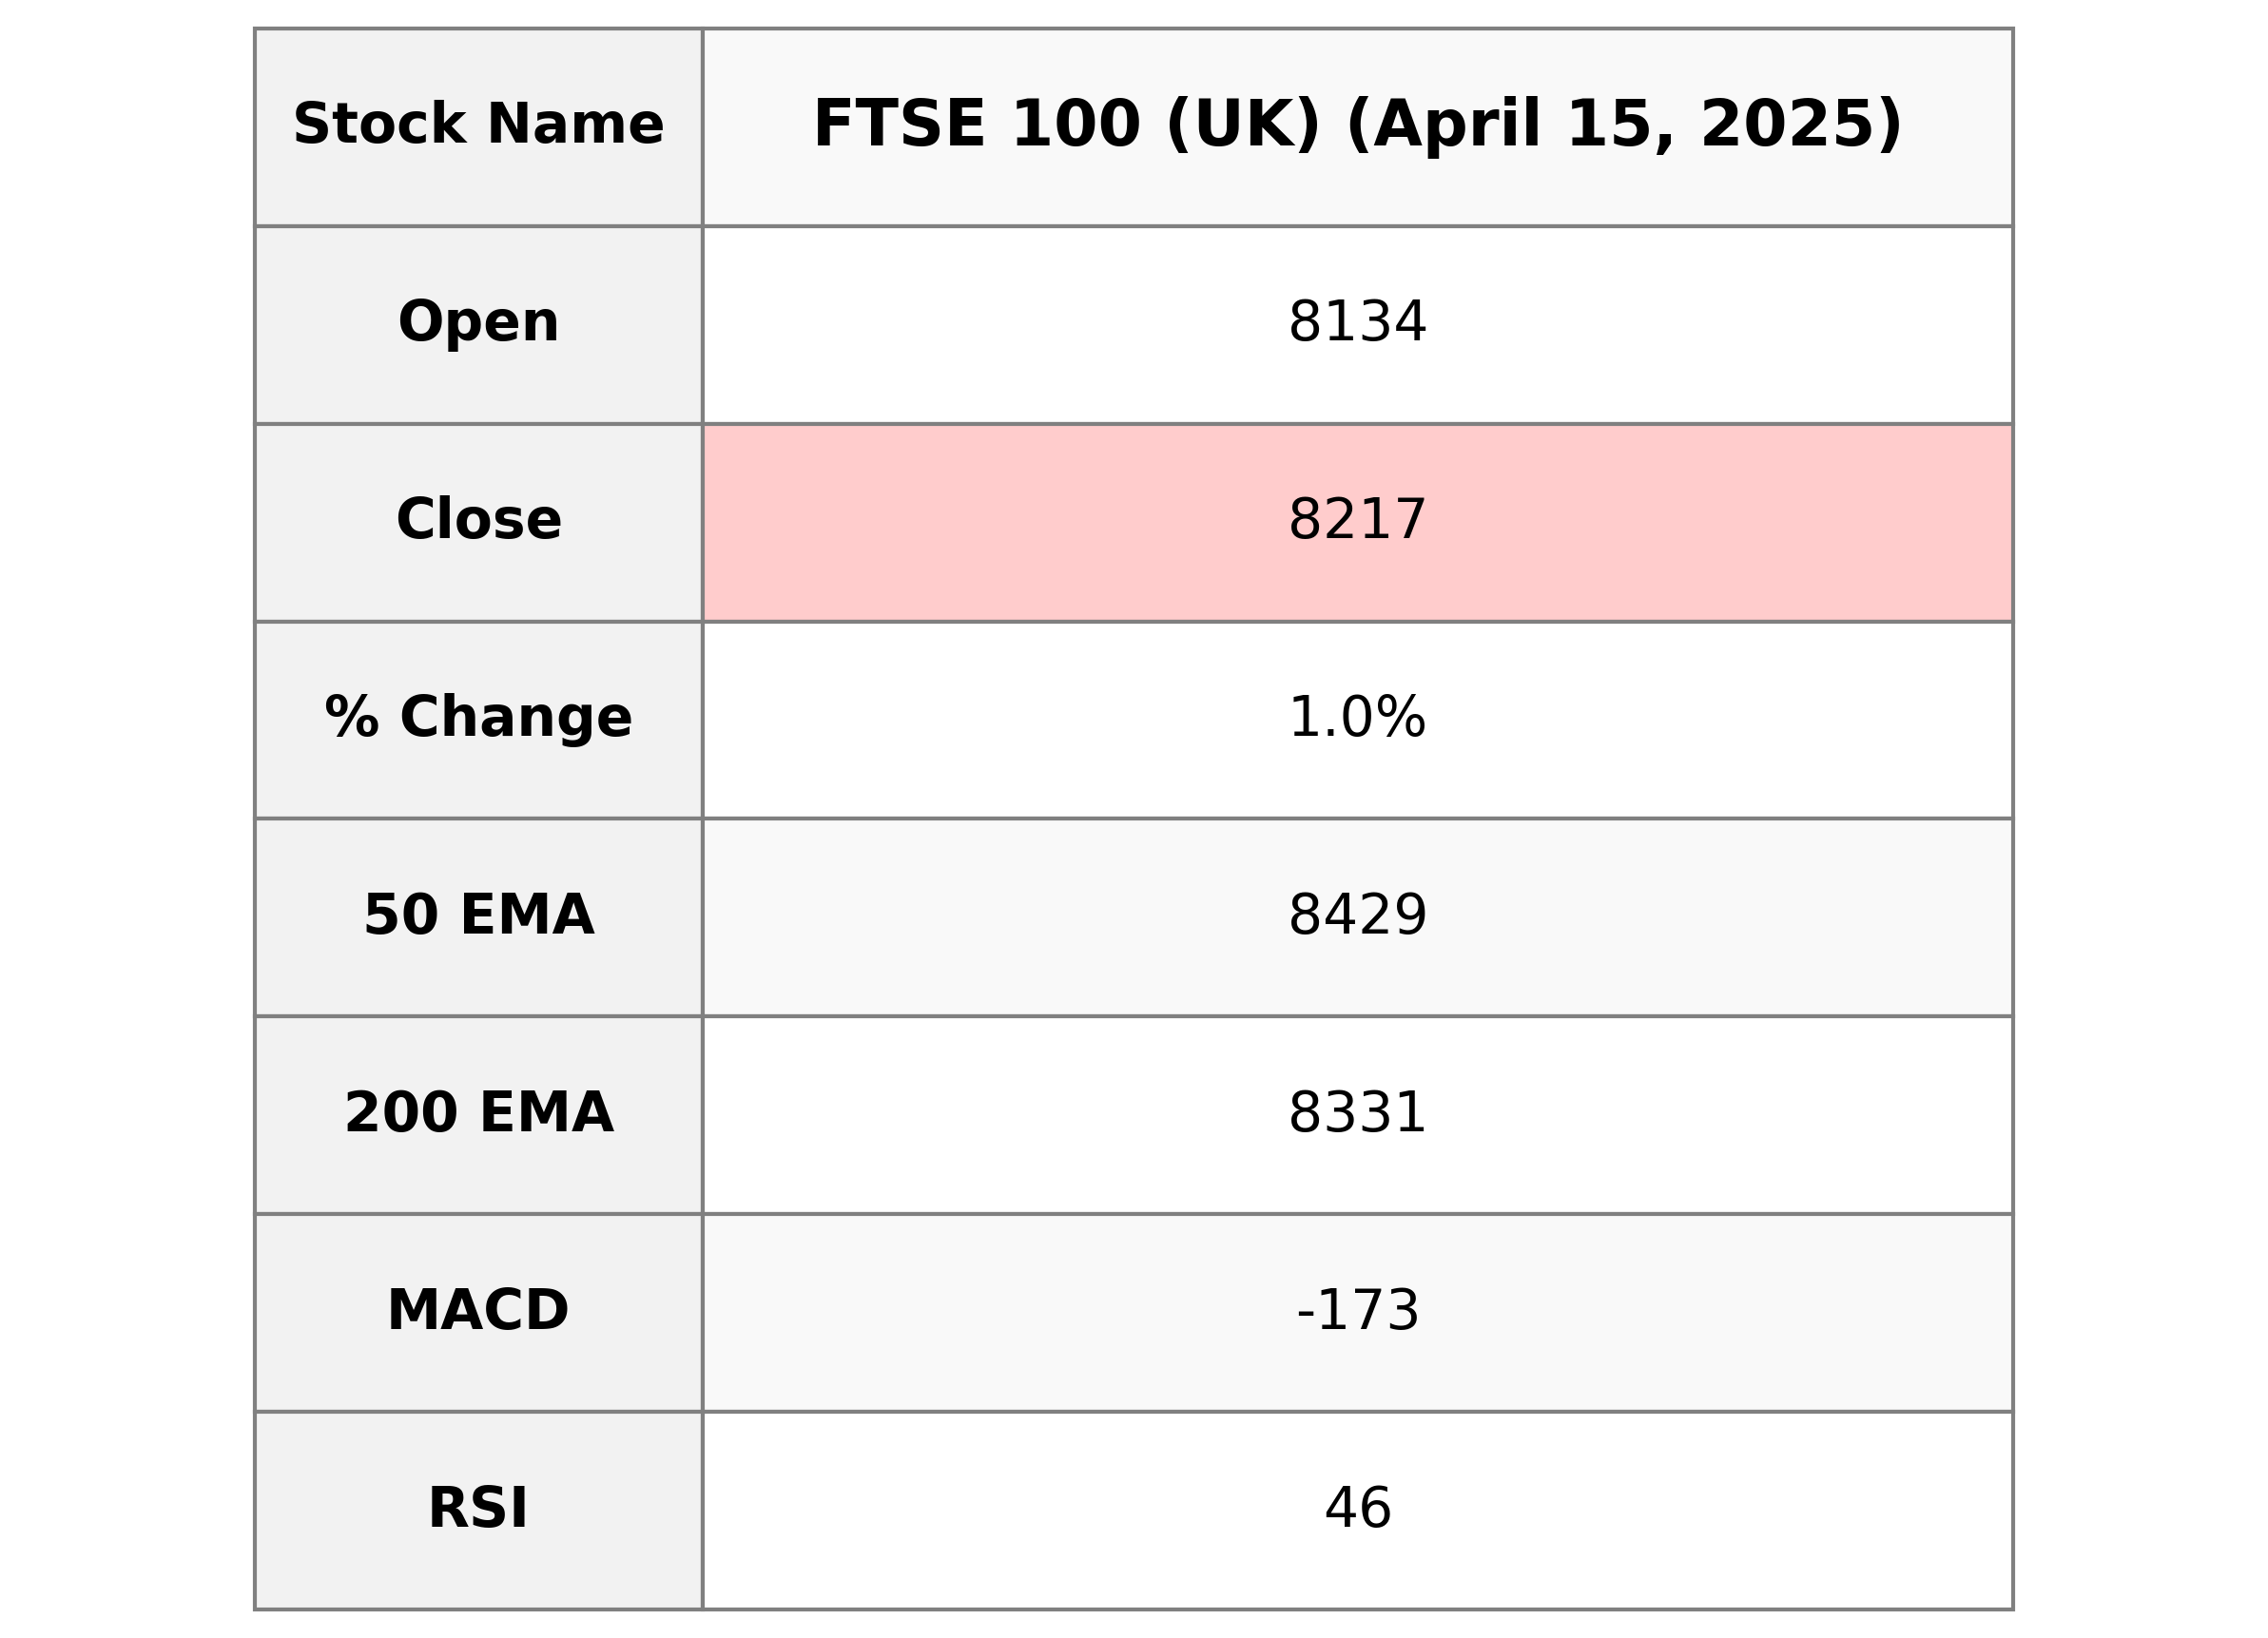
FTSE 100 (UK) opened at 8134.34 and closed higher at 8216.74, marking a 1.01% increase compared to the previous close of 8134.30. The index experienced a points change of 82.44 with a notable high of 8223.01 during the day. Despite the positive daily performance, the RSI indicates a neutral trend, and the MACD suggests bearish momentum as it is below the signal line.
Relationship with Key Moving Averages
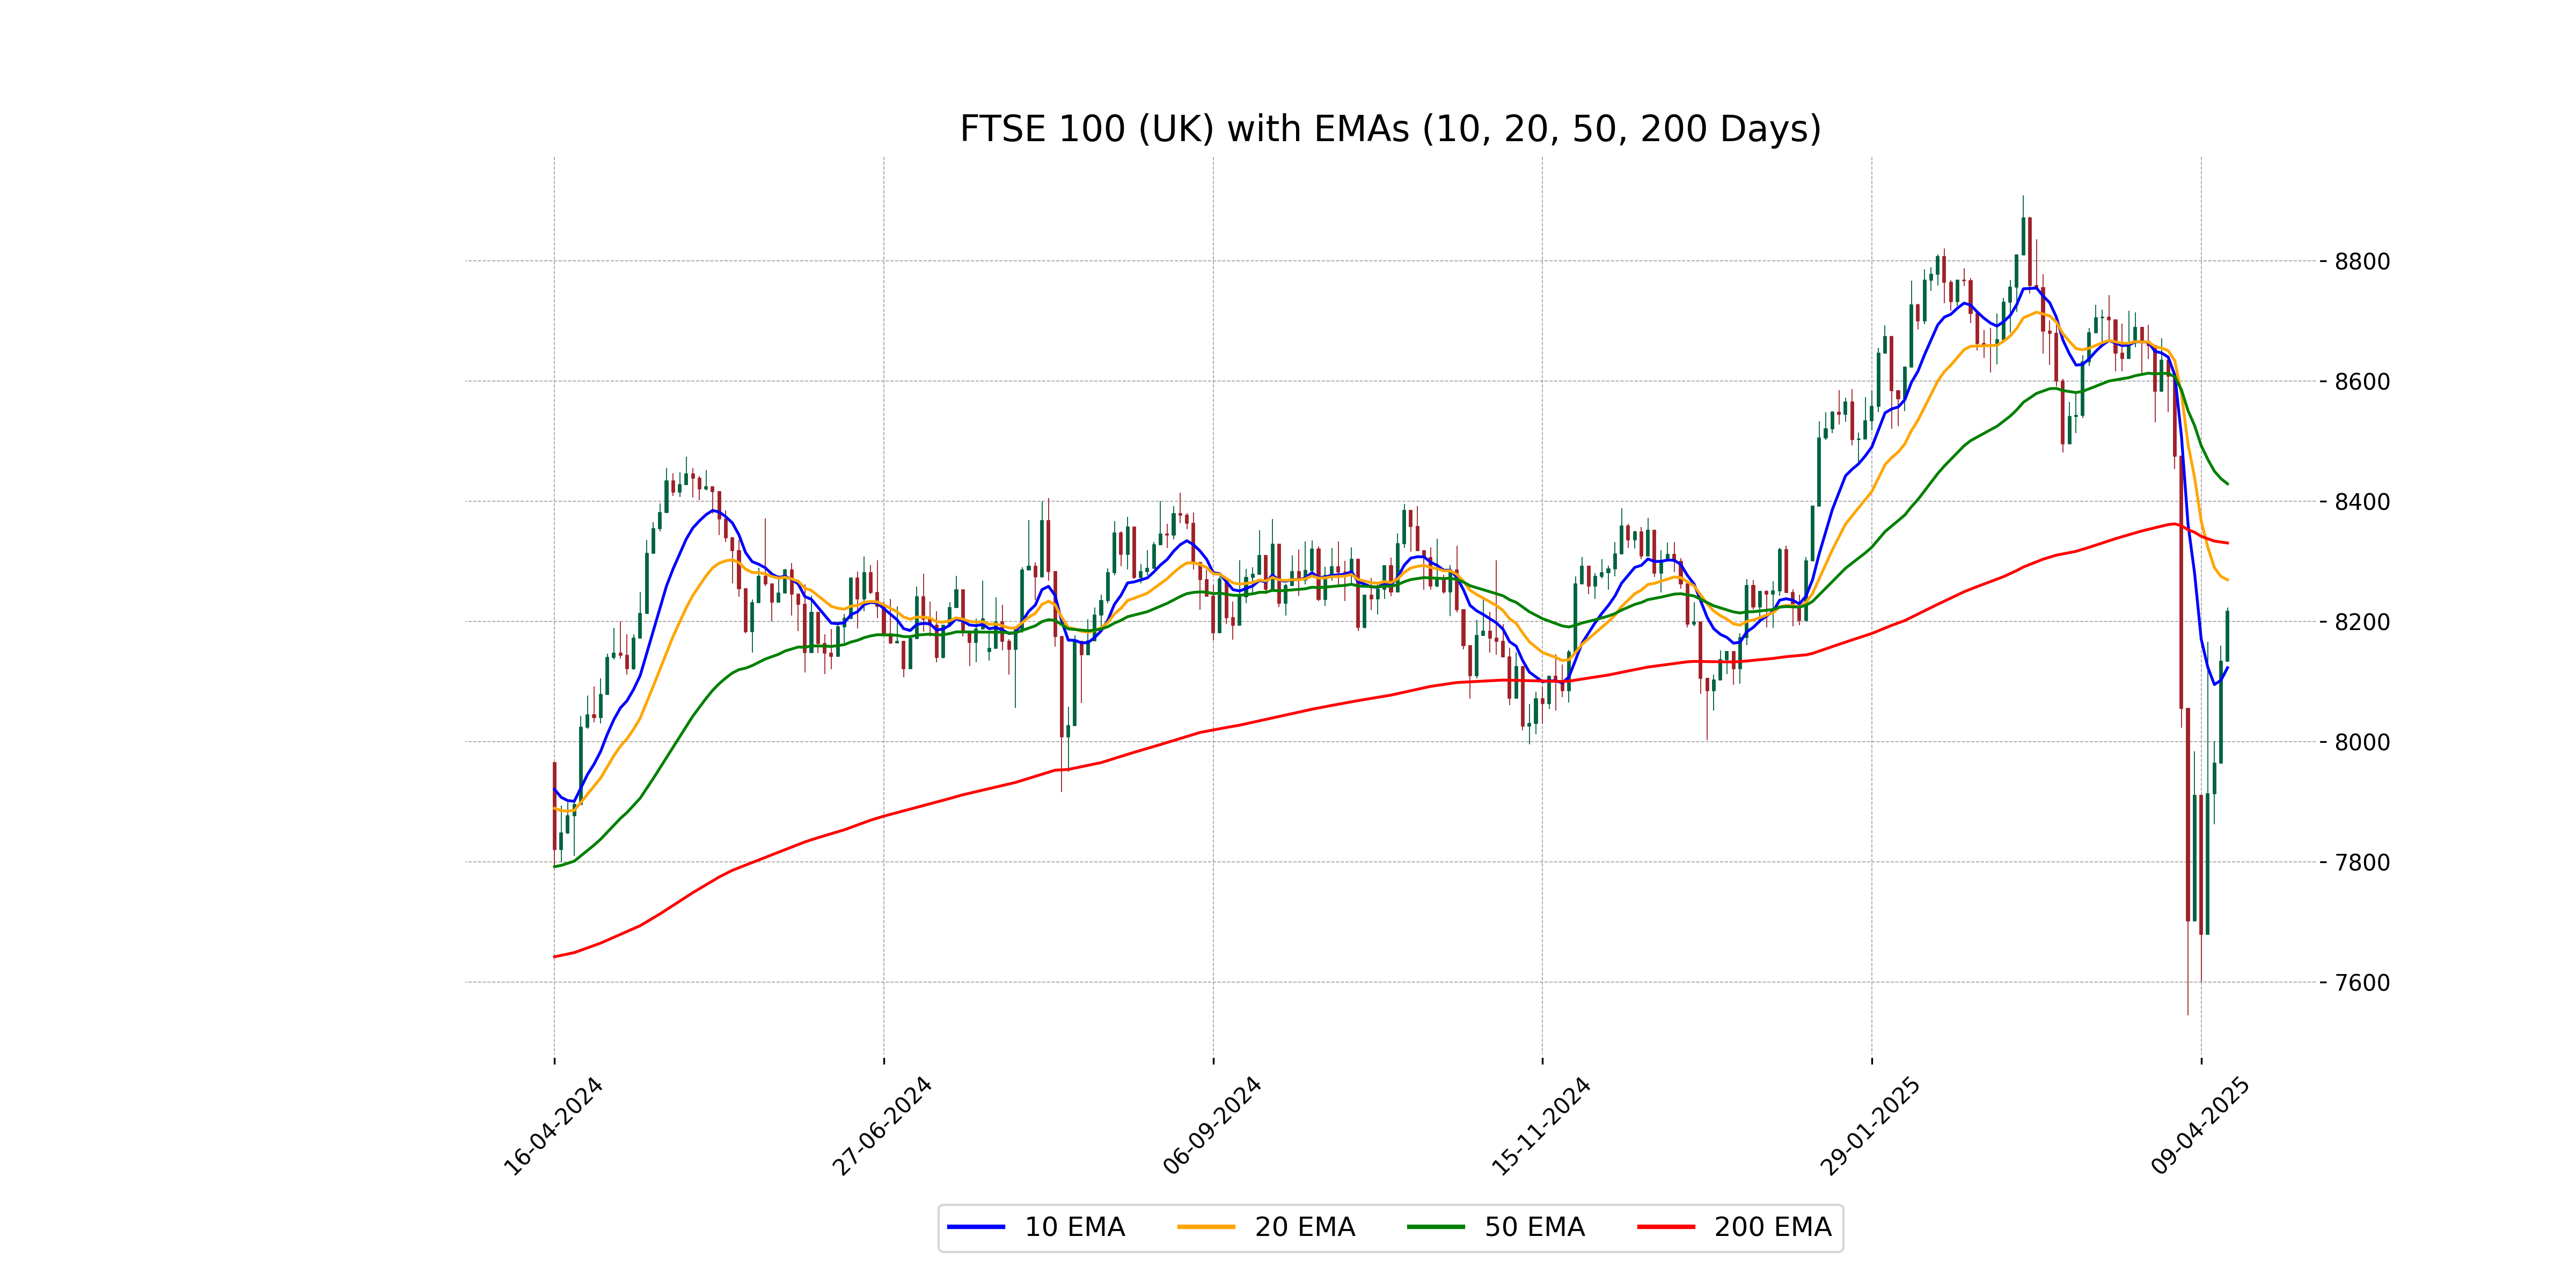
FTSE 100 (UK) is currently trading below its 50-day EMA of 8429.05 and its 200-day EMA of 8330.61, indicating a possible bearish trend. However, it is above its 10-day EMA of 8122.98 and approaching its 20-day EMA of 8269.35, which may suggest some short-term bullish momentum.
Moving Averages Trend (MACD)
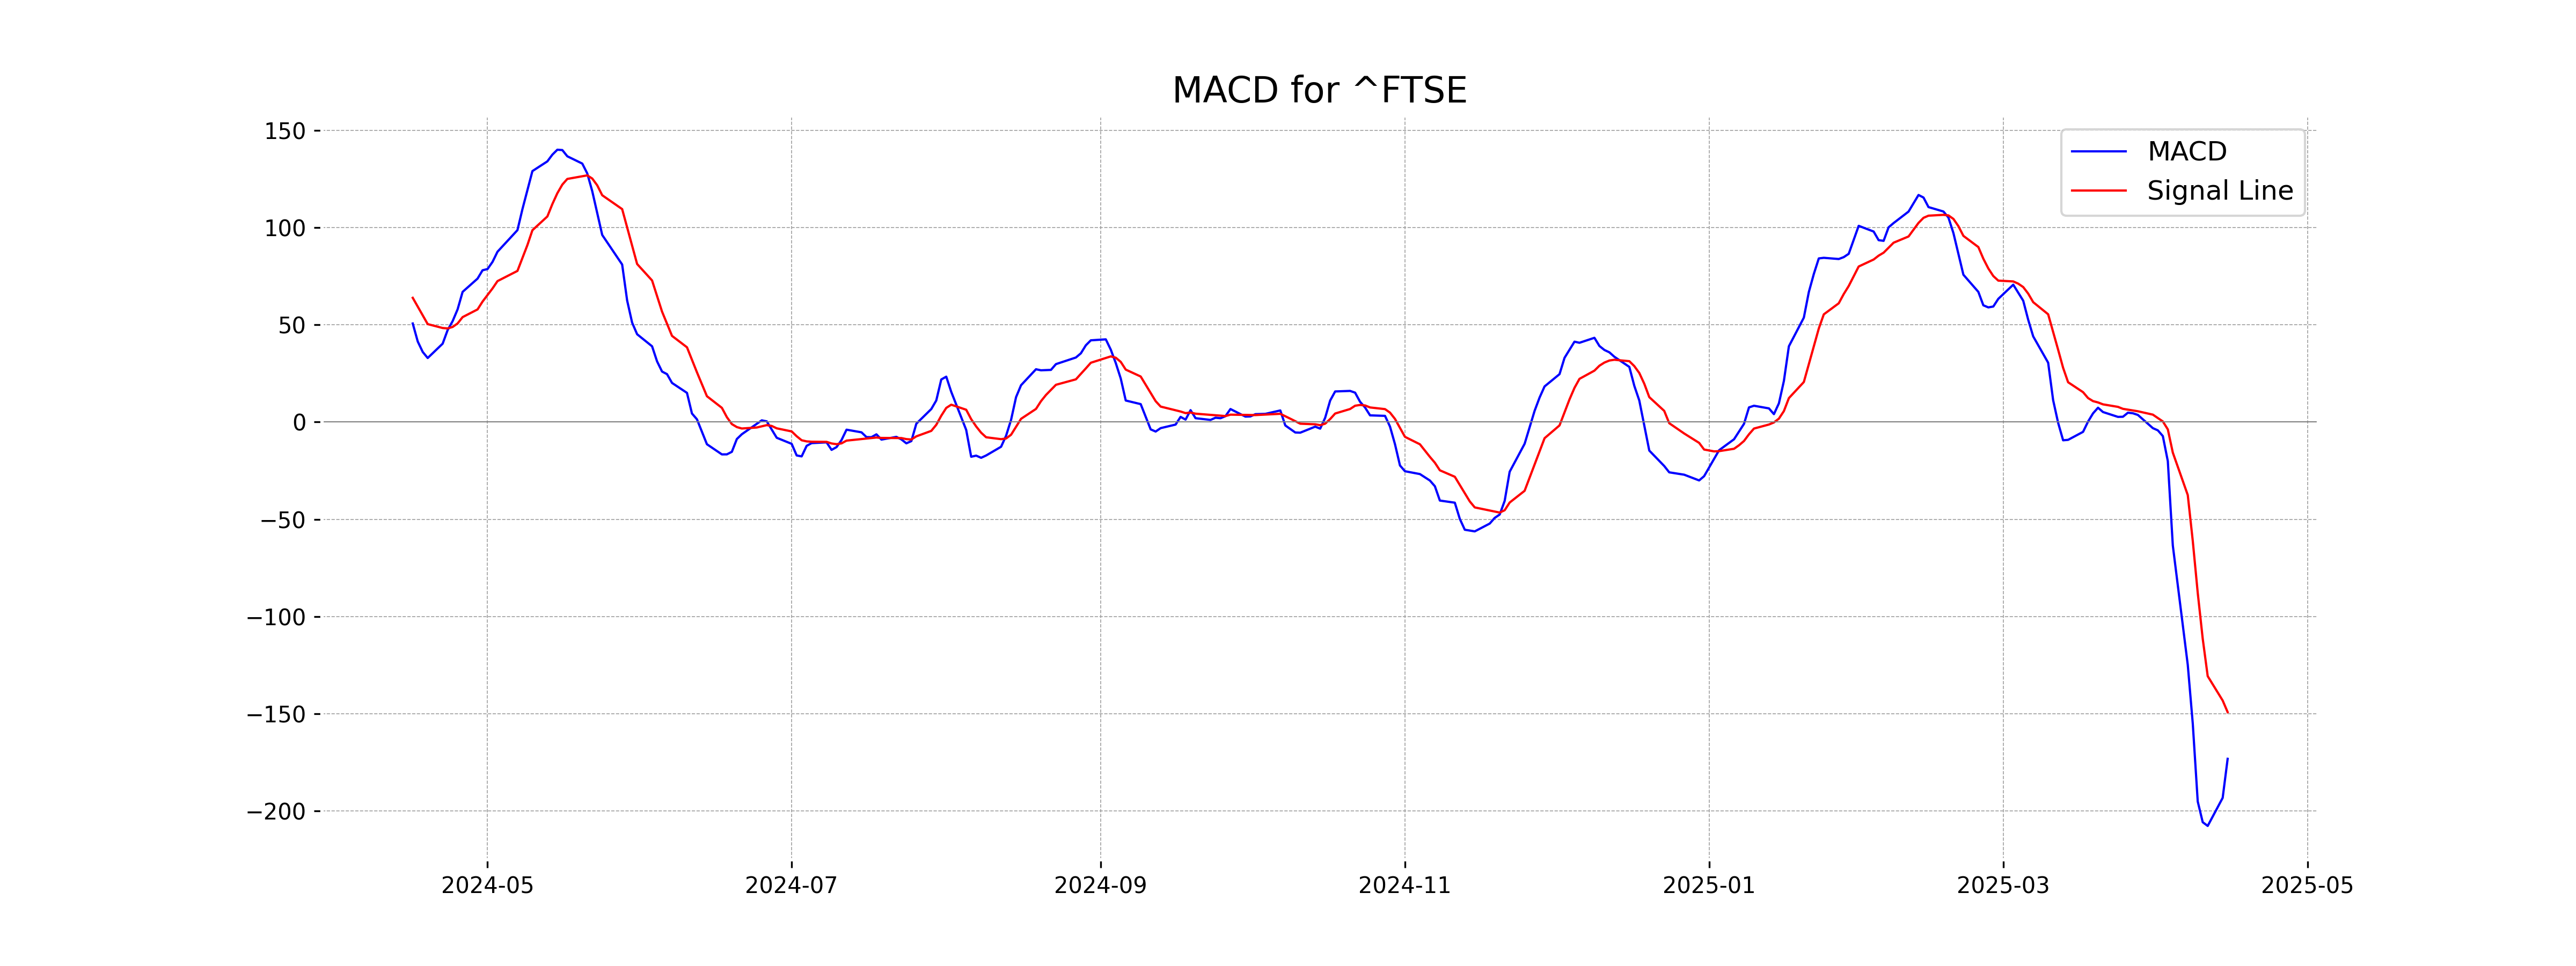
The MACD for FTSE 100 is negative at -173.15, which is below the MACD Signal line of -149.17. This suggests a bearish trend as the MACD line is diverging downwards from the Signal line, indicating potential downward momentum.
RSI Analysis
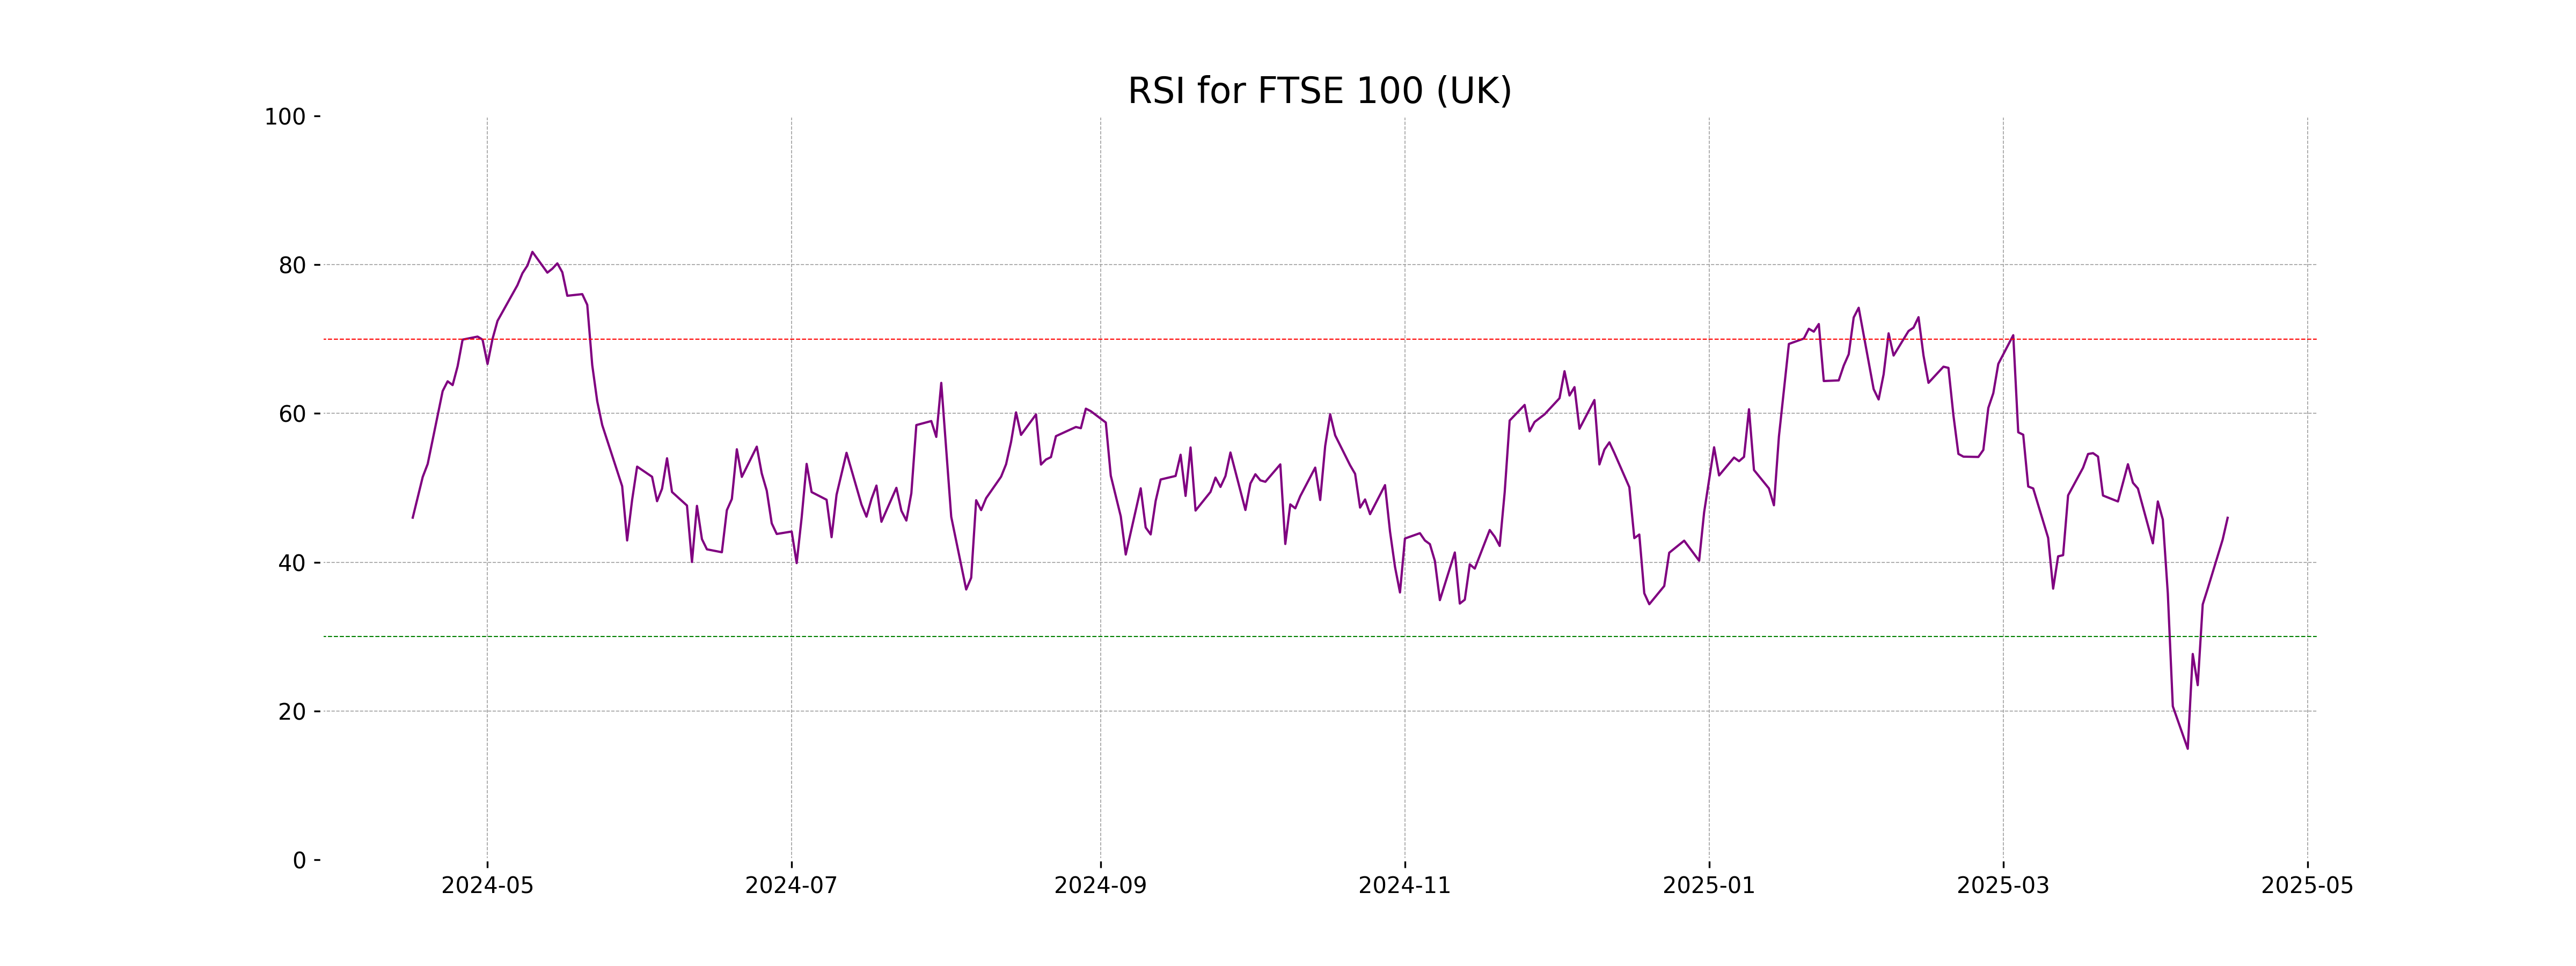
The RSI for the FTSE 100 is currently at 45.97, which suggests a neutral stance, indicating neither overbought nor oversold conditions. This level implies there's room for upward or downward movement if other market factors change.
Analysis for DAX (Germany) - April 15, 2025
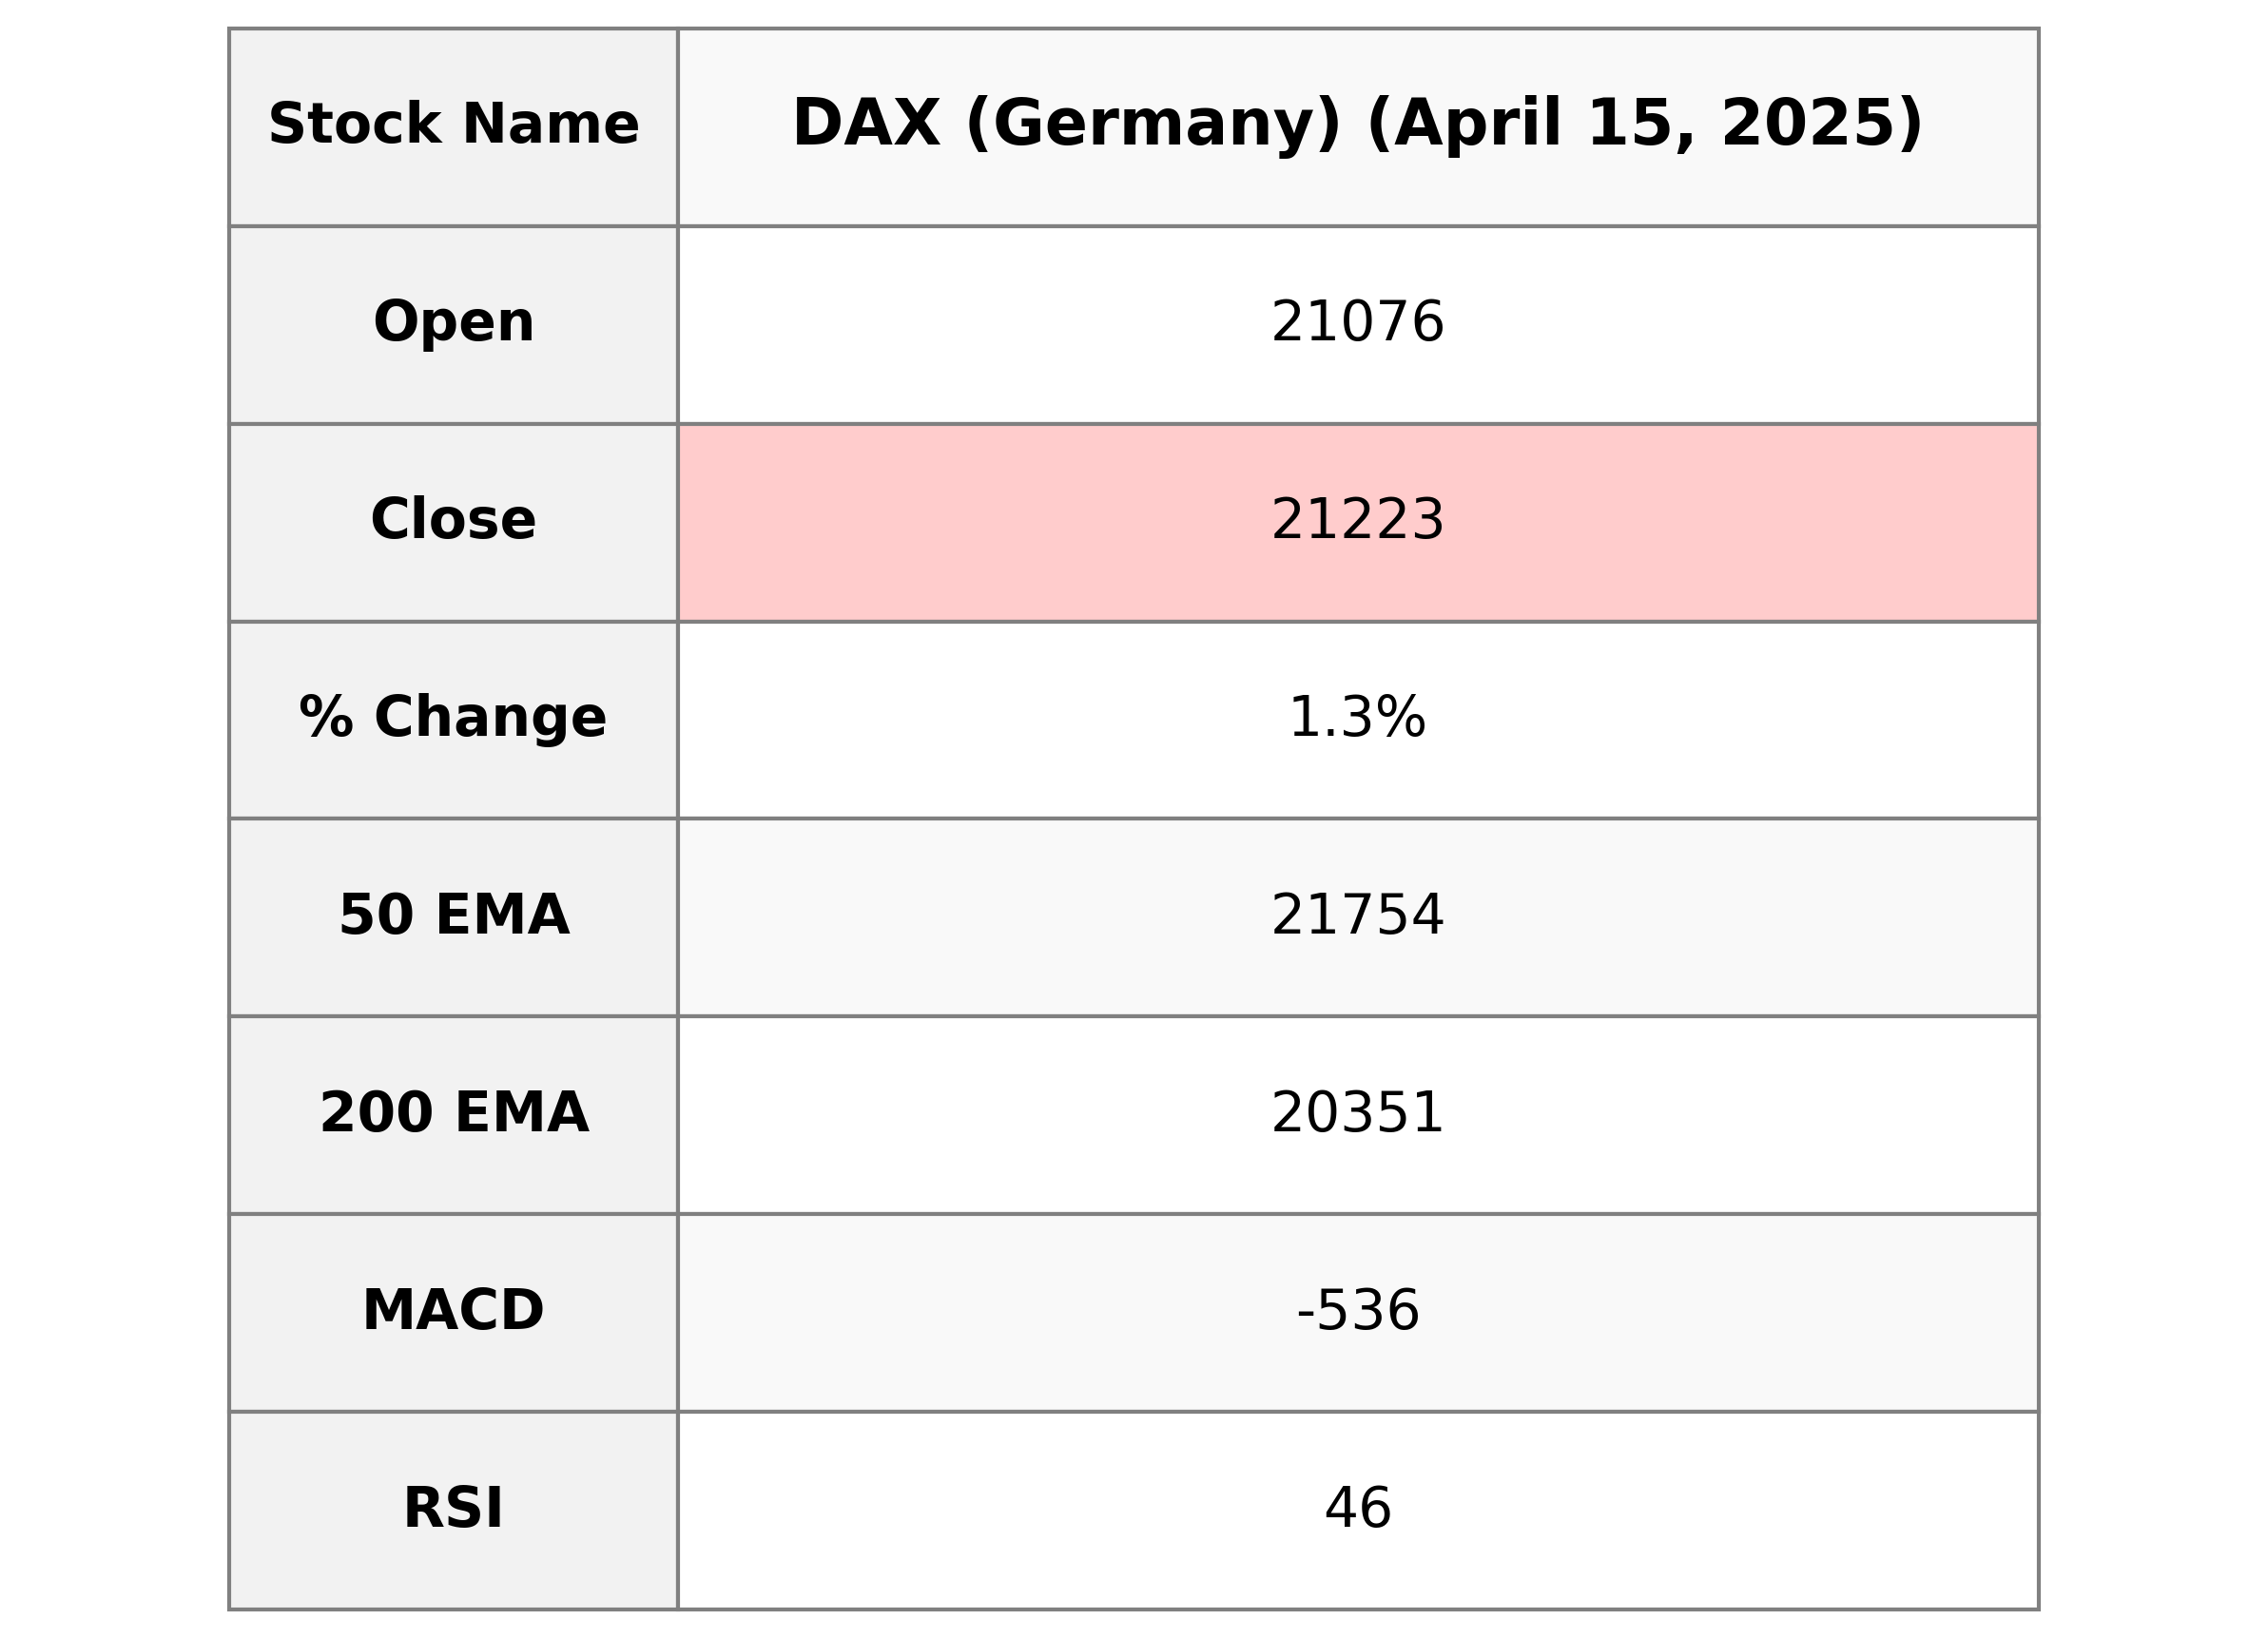
The DAX (Germany) opened at 21,076.06 and closed higher at 21,222.98, reflecting a 1.28% increase, or a gain of 268.15 points from the previous close. The index's RSI is at 46.18, indicating a neutral momentum, while the MACD shows a negative divergence with the signal line. Despite no data on volume, market cap, or earnings, the index remains below its 50 EMA, suggesting potential bearish trends in the short term.
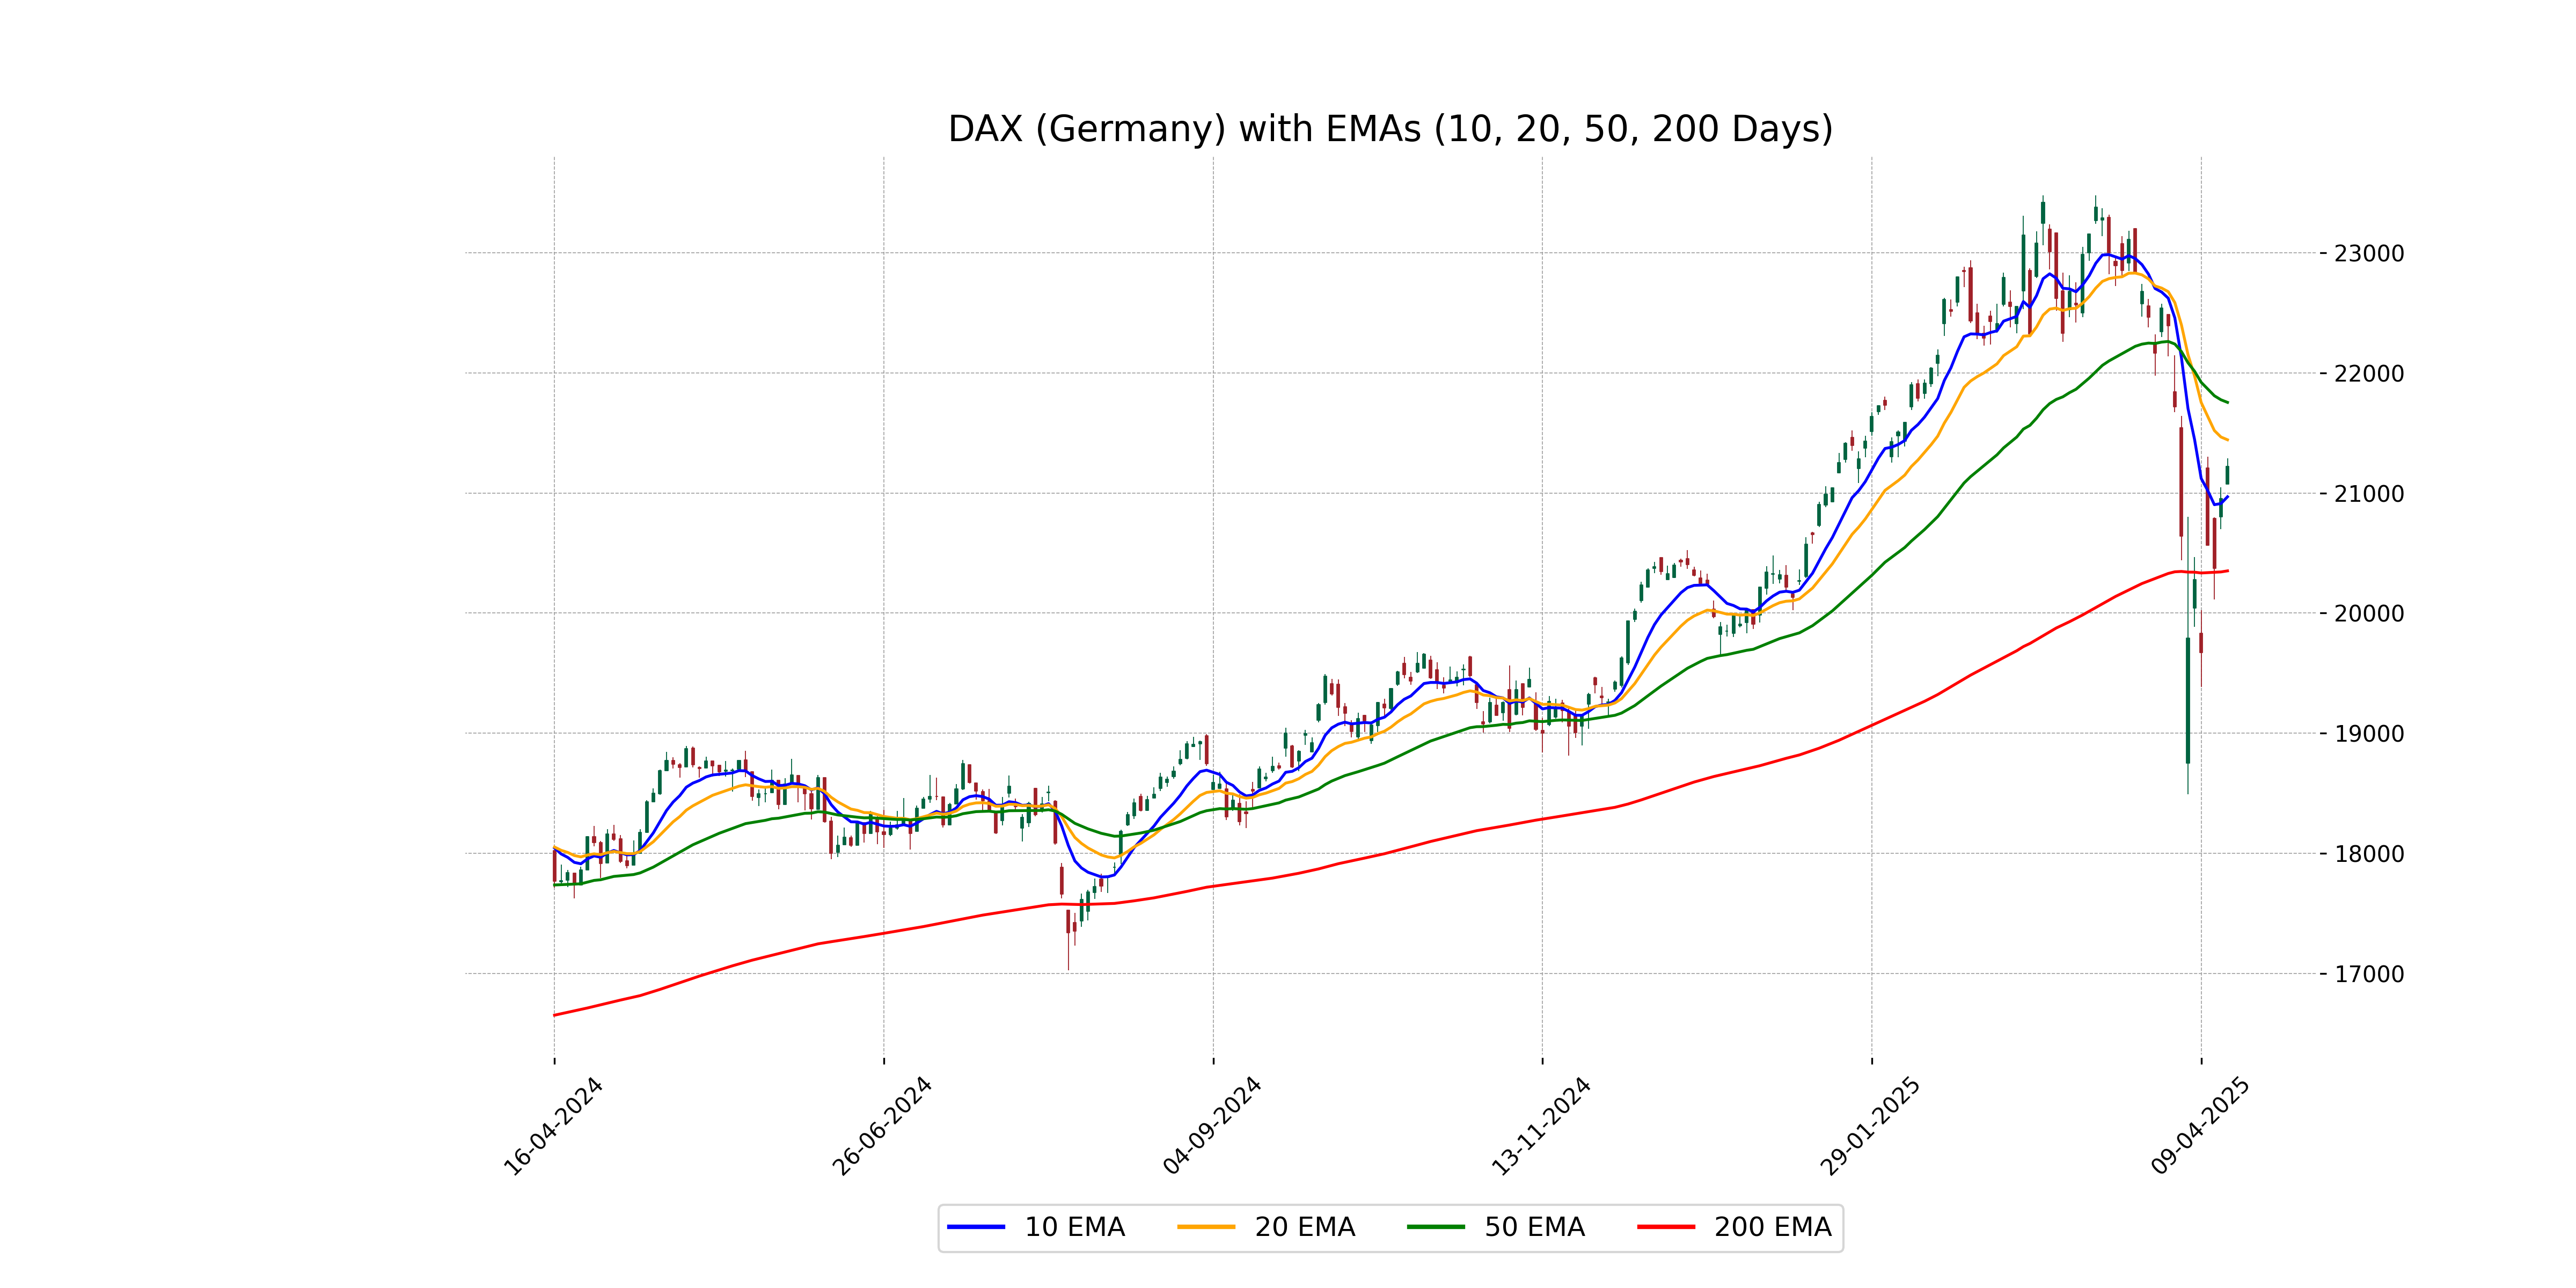
Relationship with Key Moving Averages
The DAX (Germany) closed higher than its open, with a closing price of 21,222.98 and a percentage change increase of 1.28%. The 10 EMA (20,968.40) is slightly below the close, while the 50 EMA (21,754.02) and 20 EMA (21,442.63) are above. The 200 EMA (20,351.35) is below the current close, indicating potential short-term support, though the MACD trend indicates a bearish momentum.
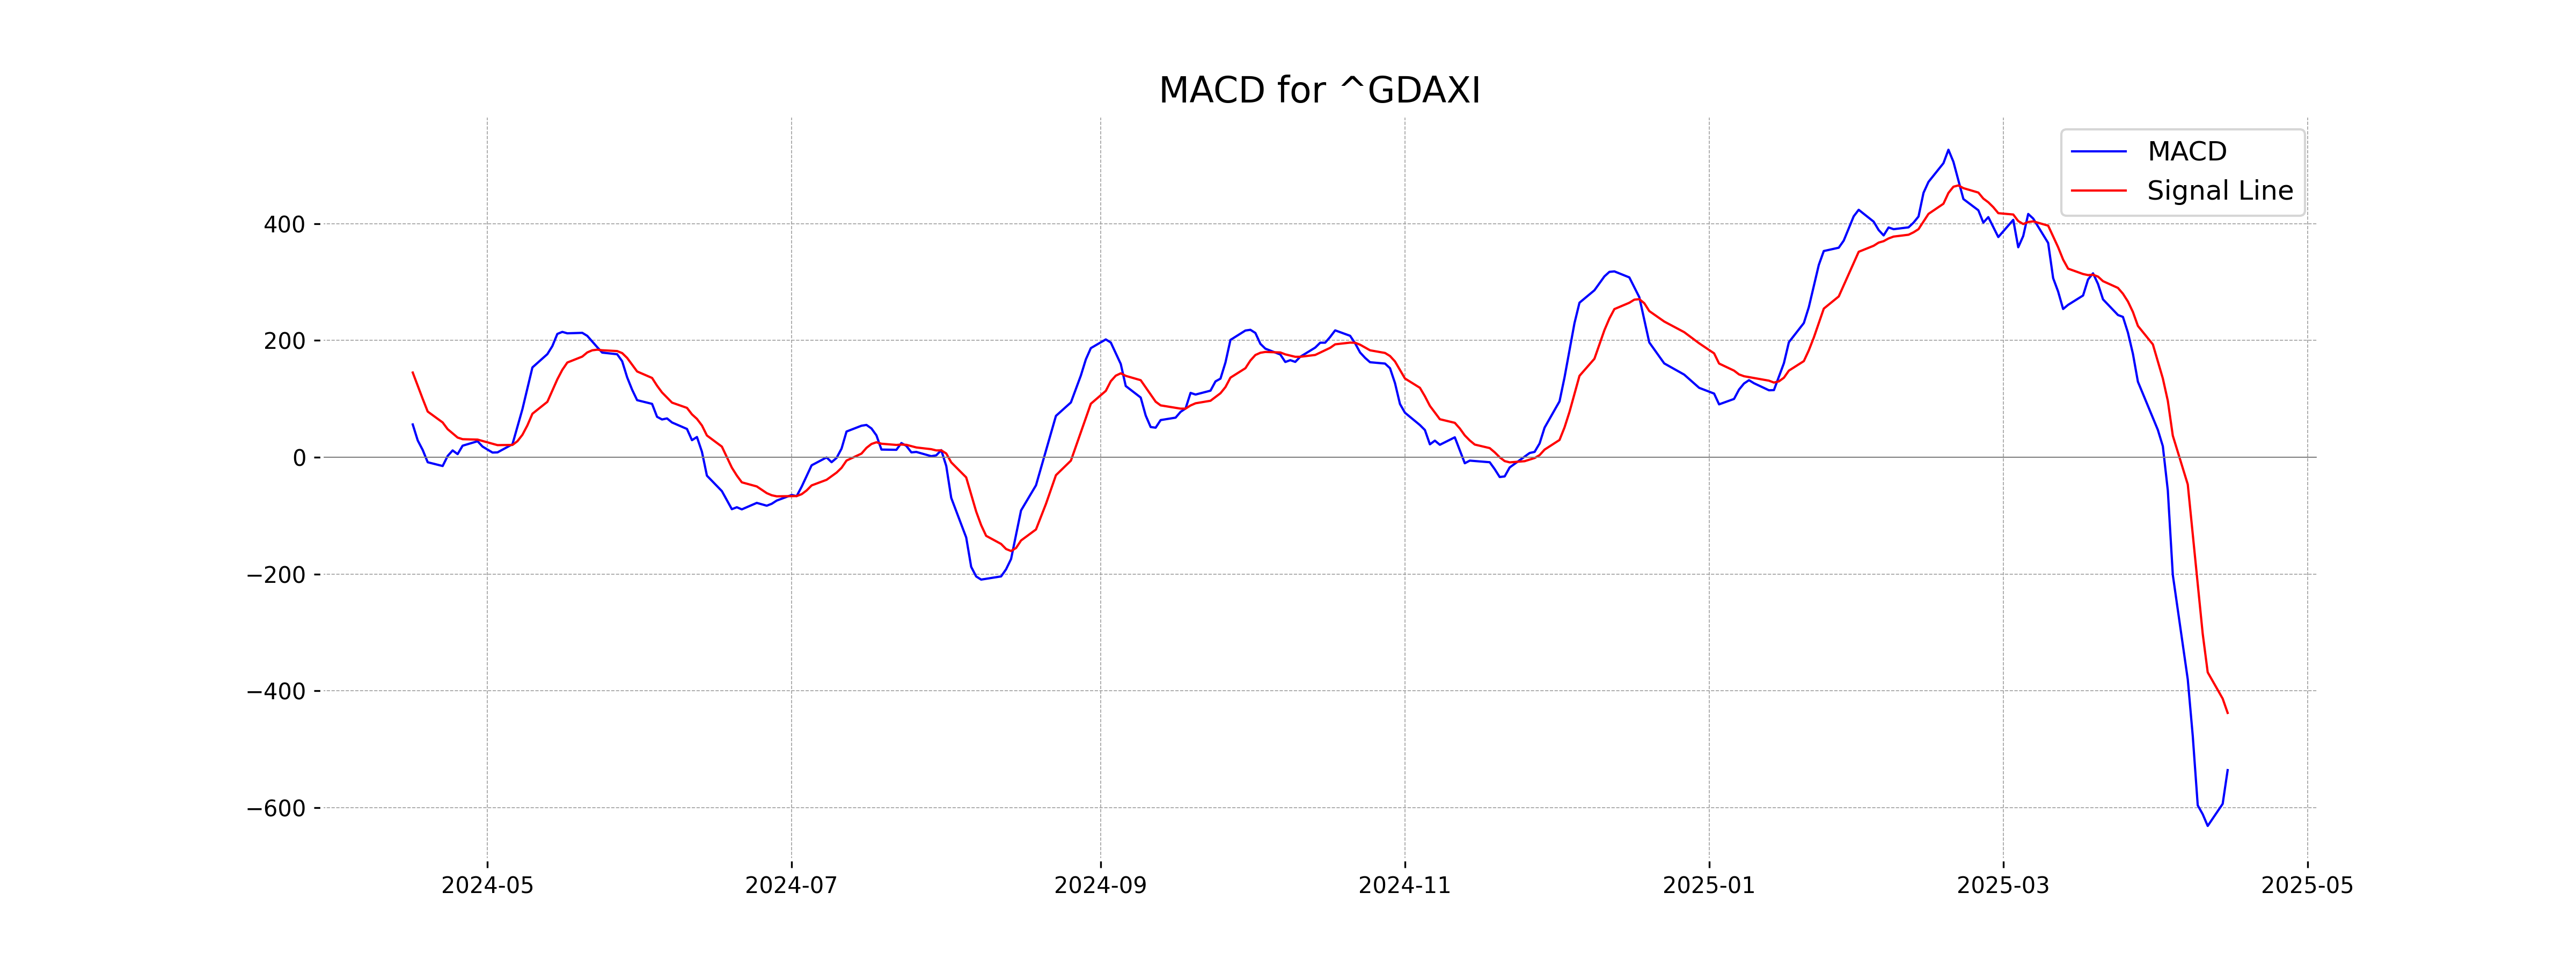
Moving Averages Trend (MACD)
The MACD for DAX (Germany) is currently negative, with a MACD value of -535.92 and a Signal Line of -437.96. This suggests that bearish momentum might be prevalent in the market.
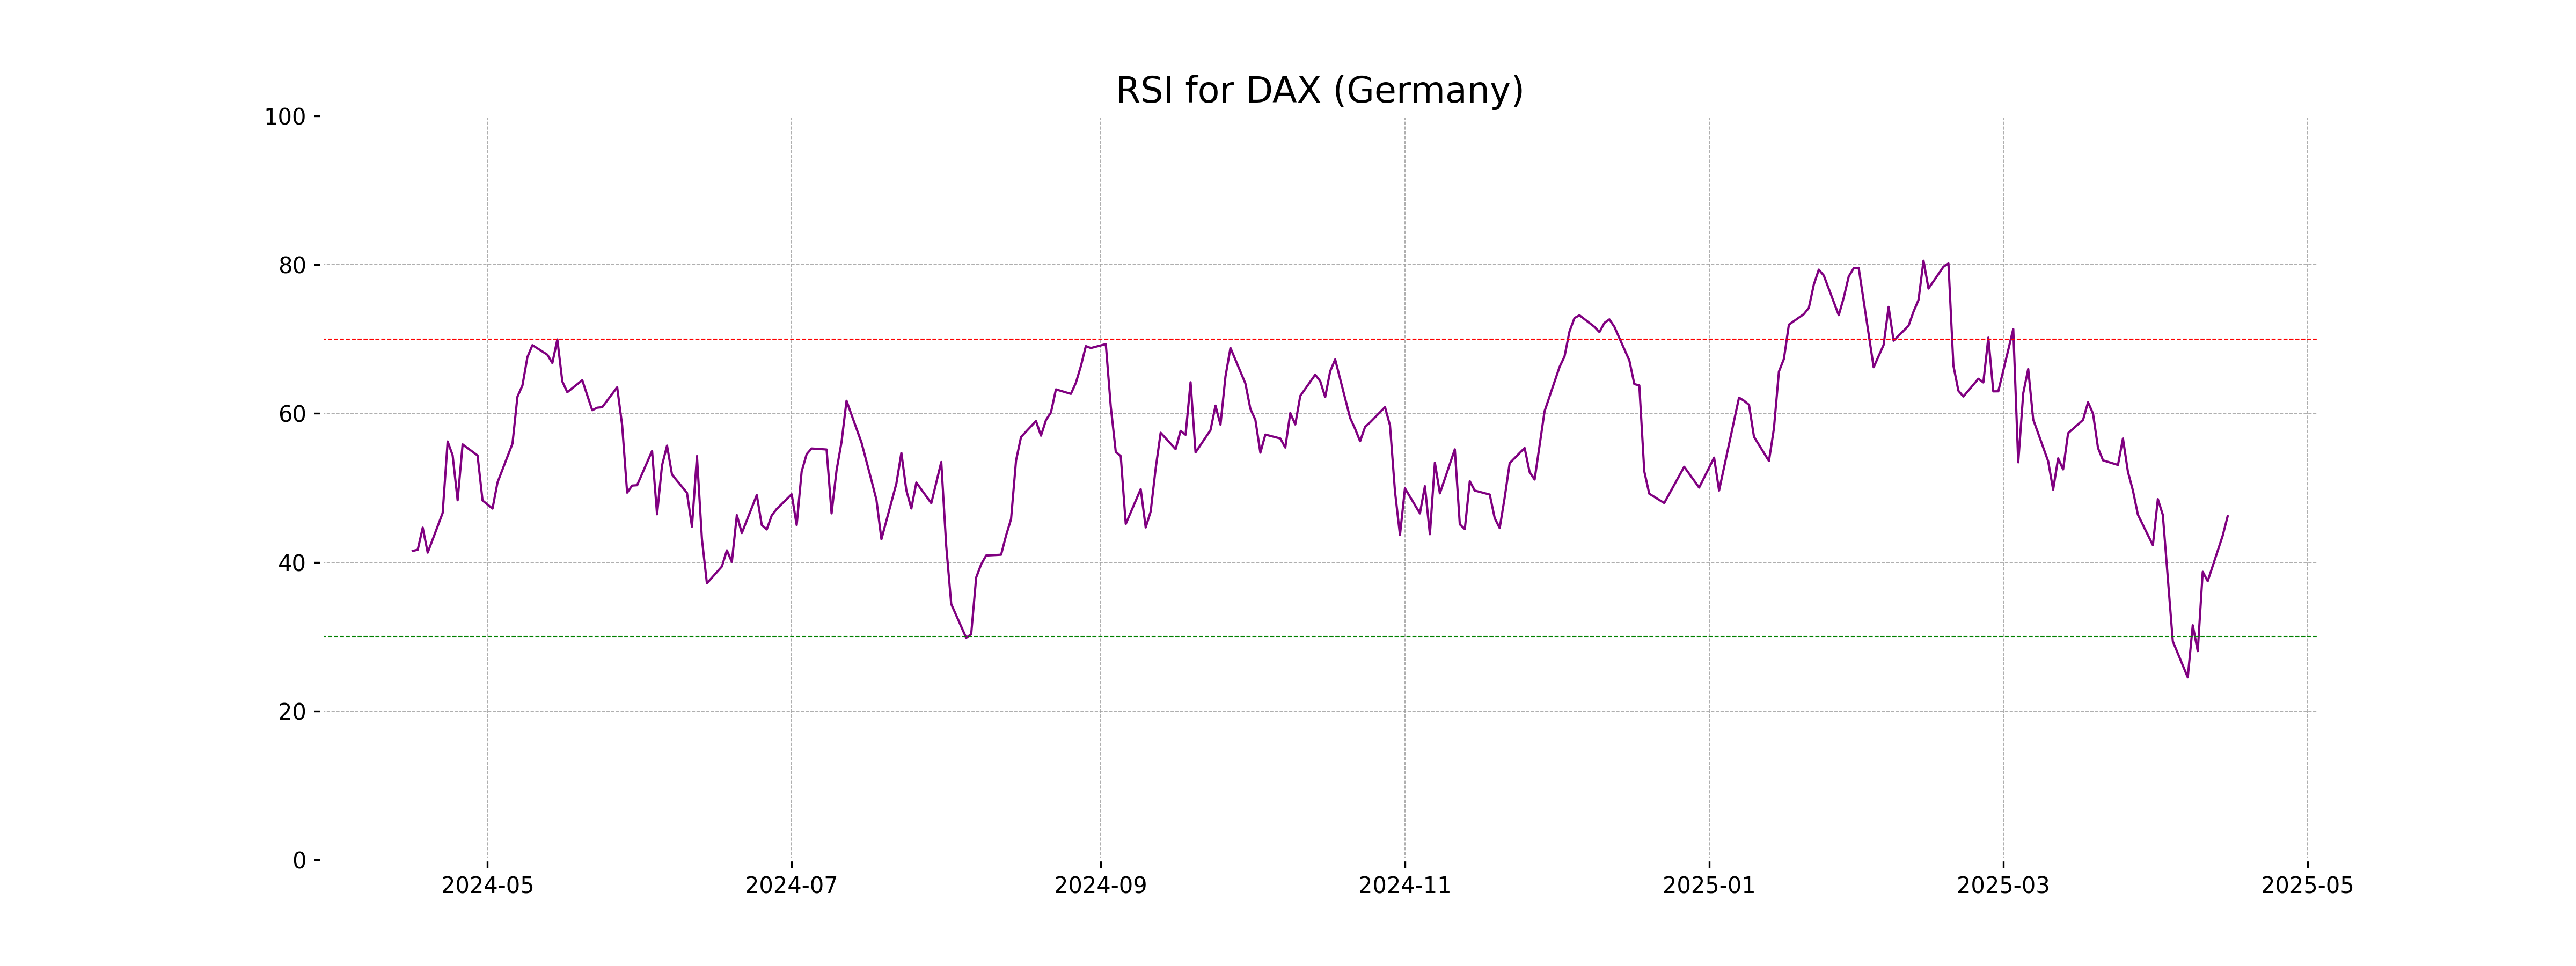
RSI Analysis
```text The RSI of DAX (Germany) is 46.18, which suggests that the index is in a neutral zone. It is neither overbought nor oversold, indicating balanced momentum. Monitoring changes in RSI can help predict potential market movements. ```
Analysis for S&P 500 (US) - April 15, 2025

The S&P 500 opened at 5441.96, reached a high of 5459.46 and a low of 5358.02, closing at 5405.97, which is a 0.79% increase from the previous close of 5363.36. Despite the slight positive change, the RSI of 45.79 suggests a neutral to slightly bearish sentiment, while a negative MACD indicates potential downward momentum in the near term.
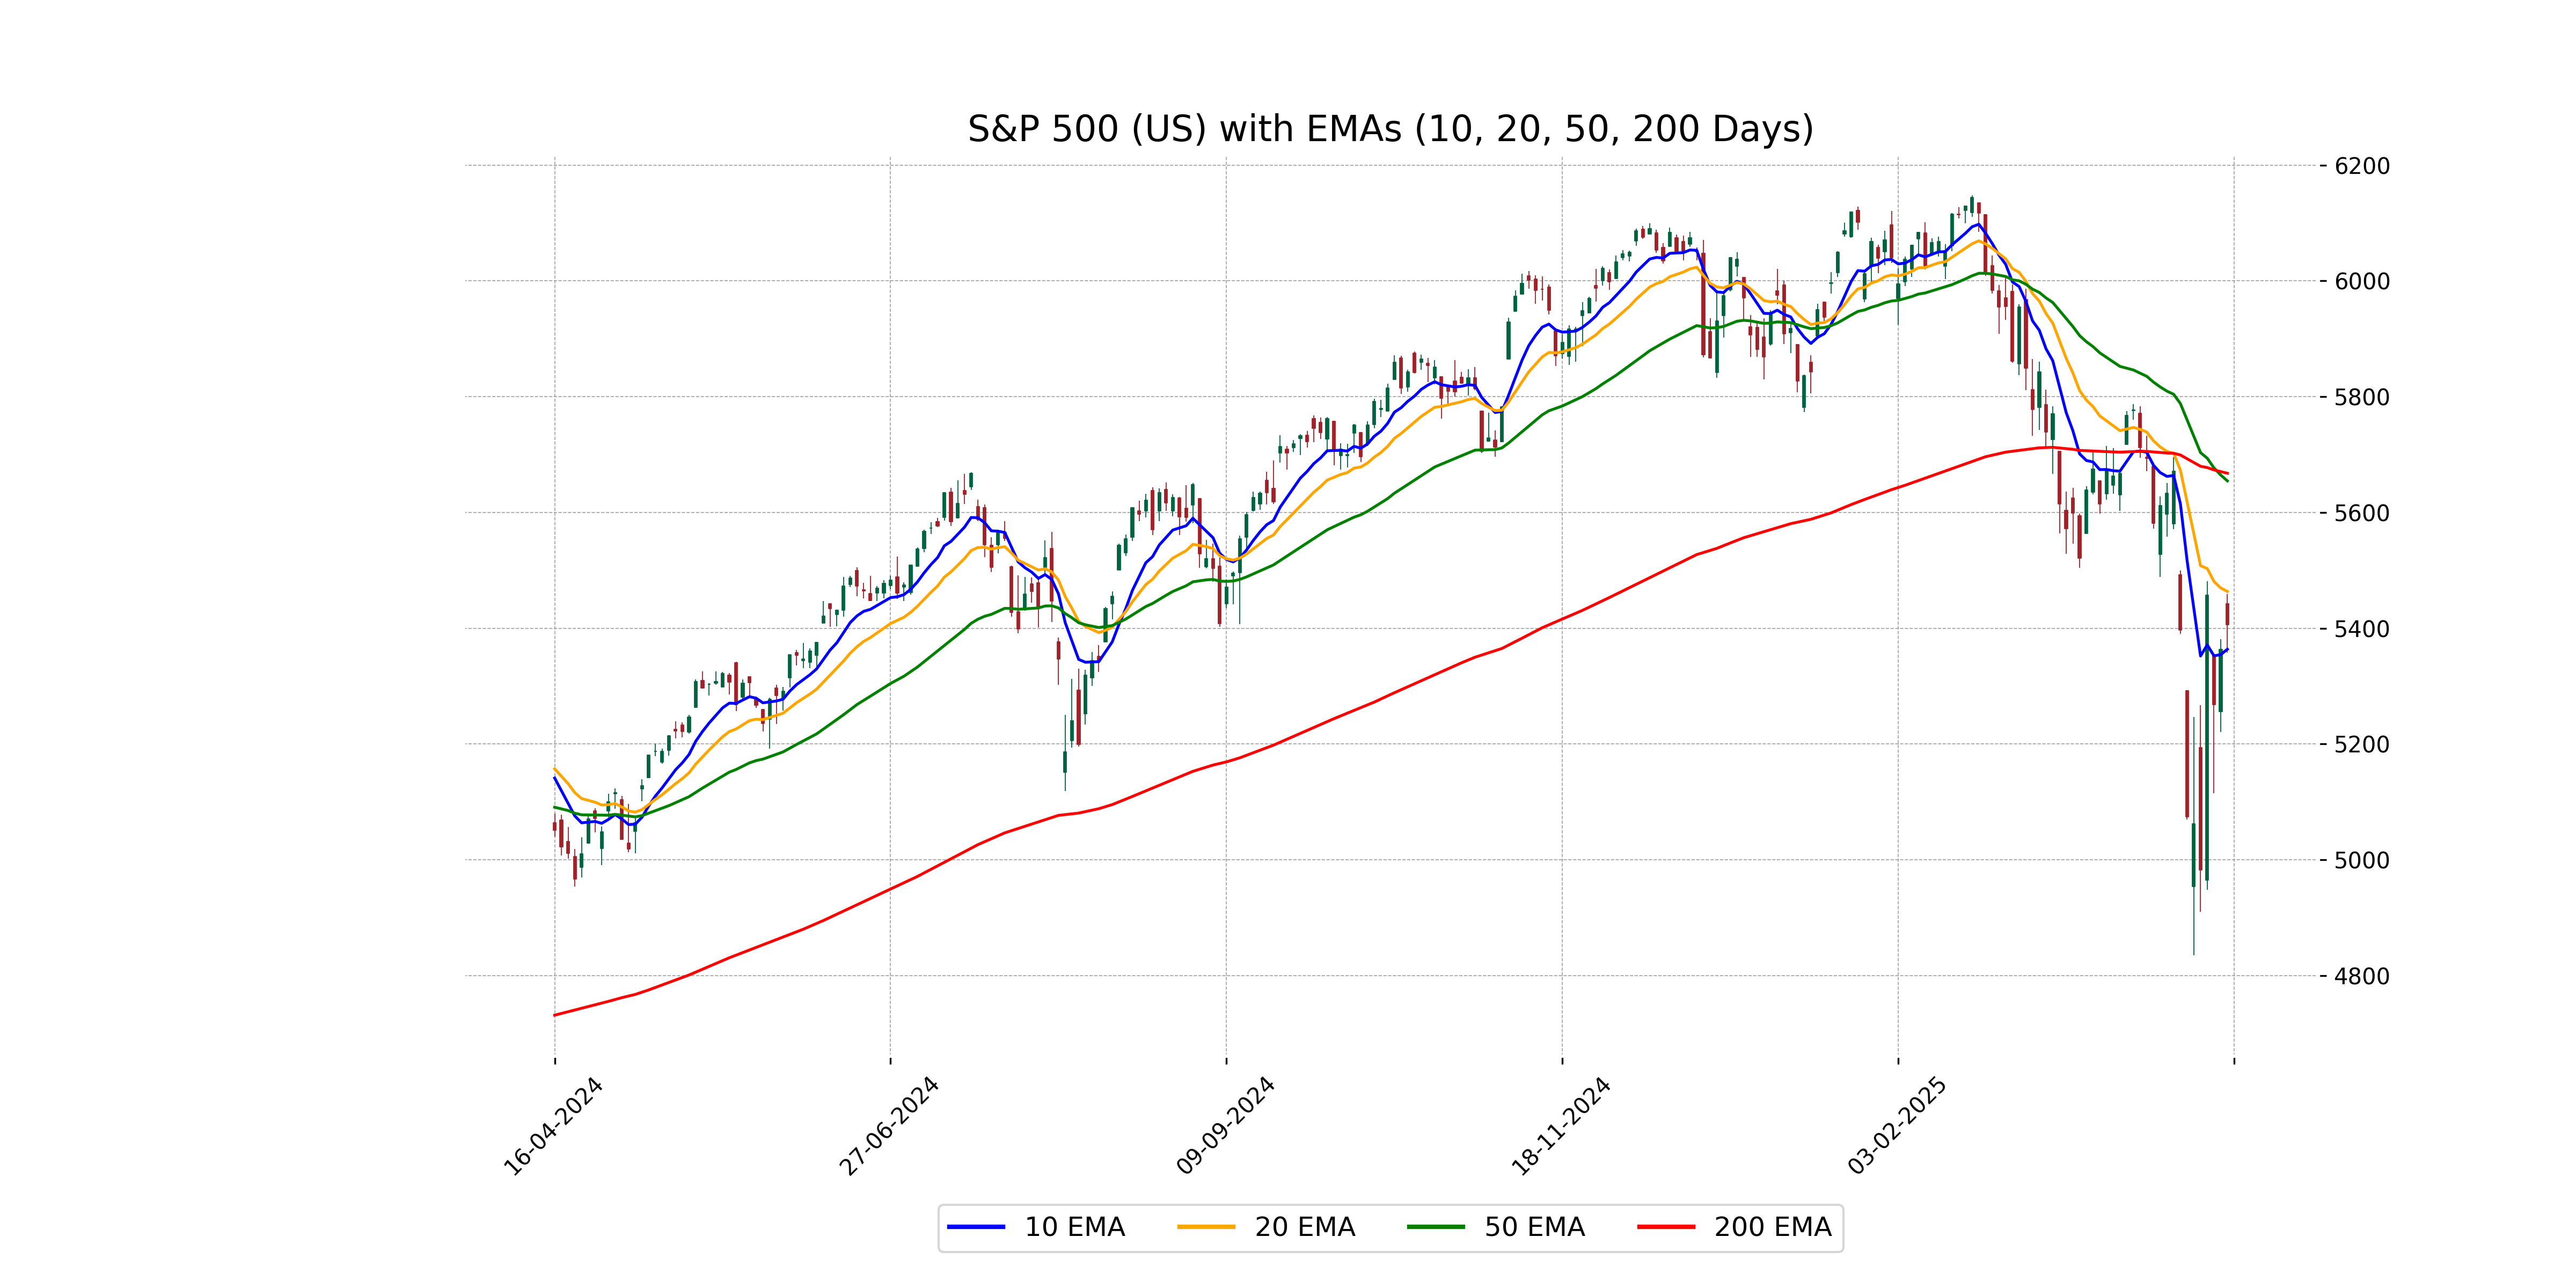
Relationship with Key Moving Averages
The S&P 500 is currently trading below its 50-day EMA (5654.57) and 200-day EMA (5667.74), indicating a bearish trend over the medium to long term. However, it is slightly above the 10-day EMA (5363.79), suggesting a short-term uptick.
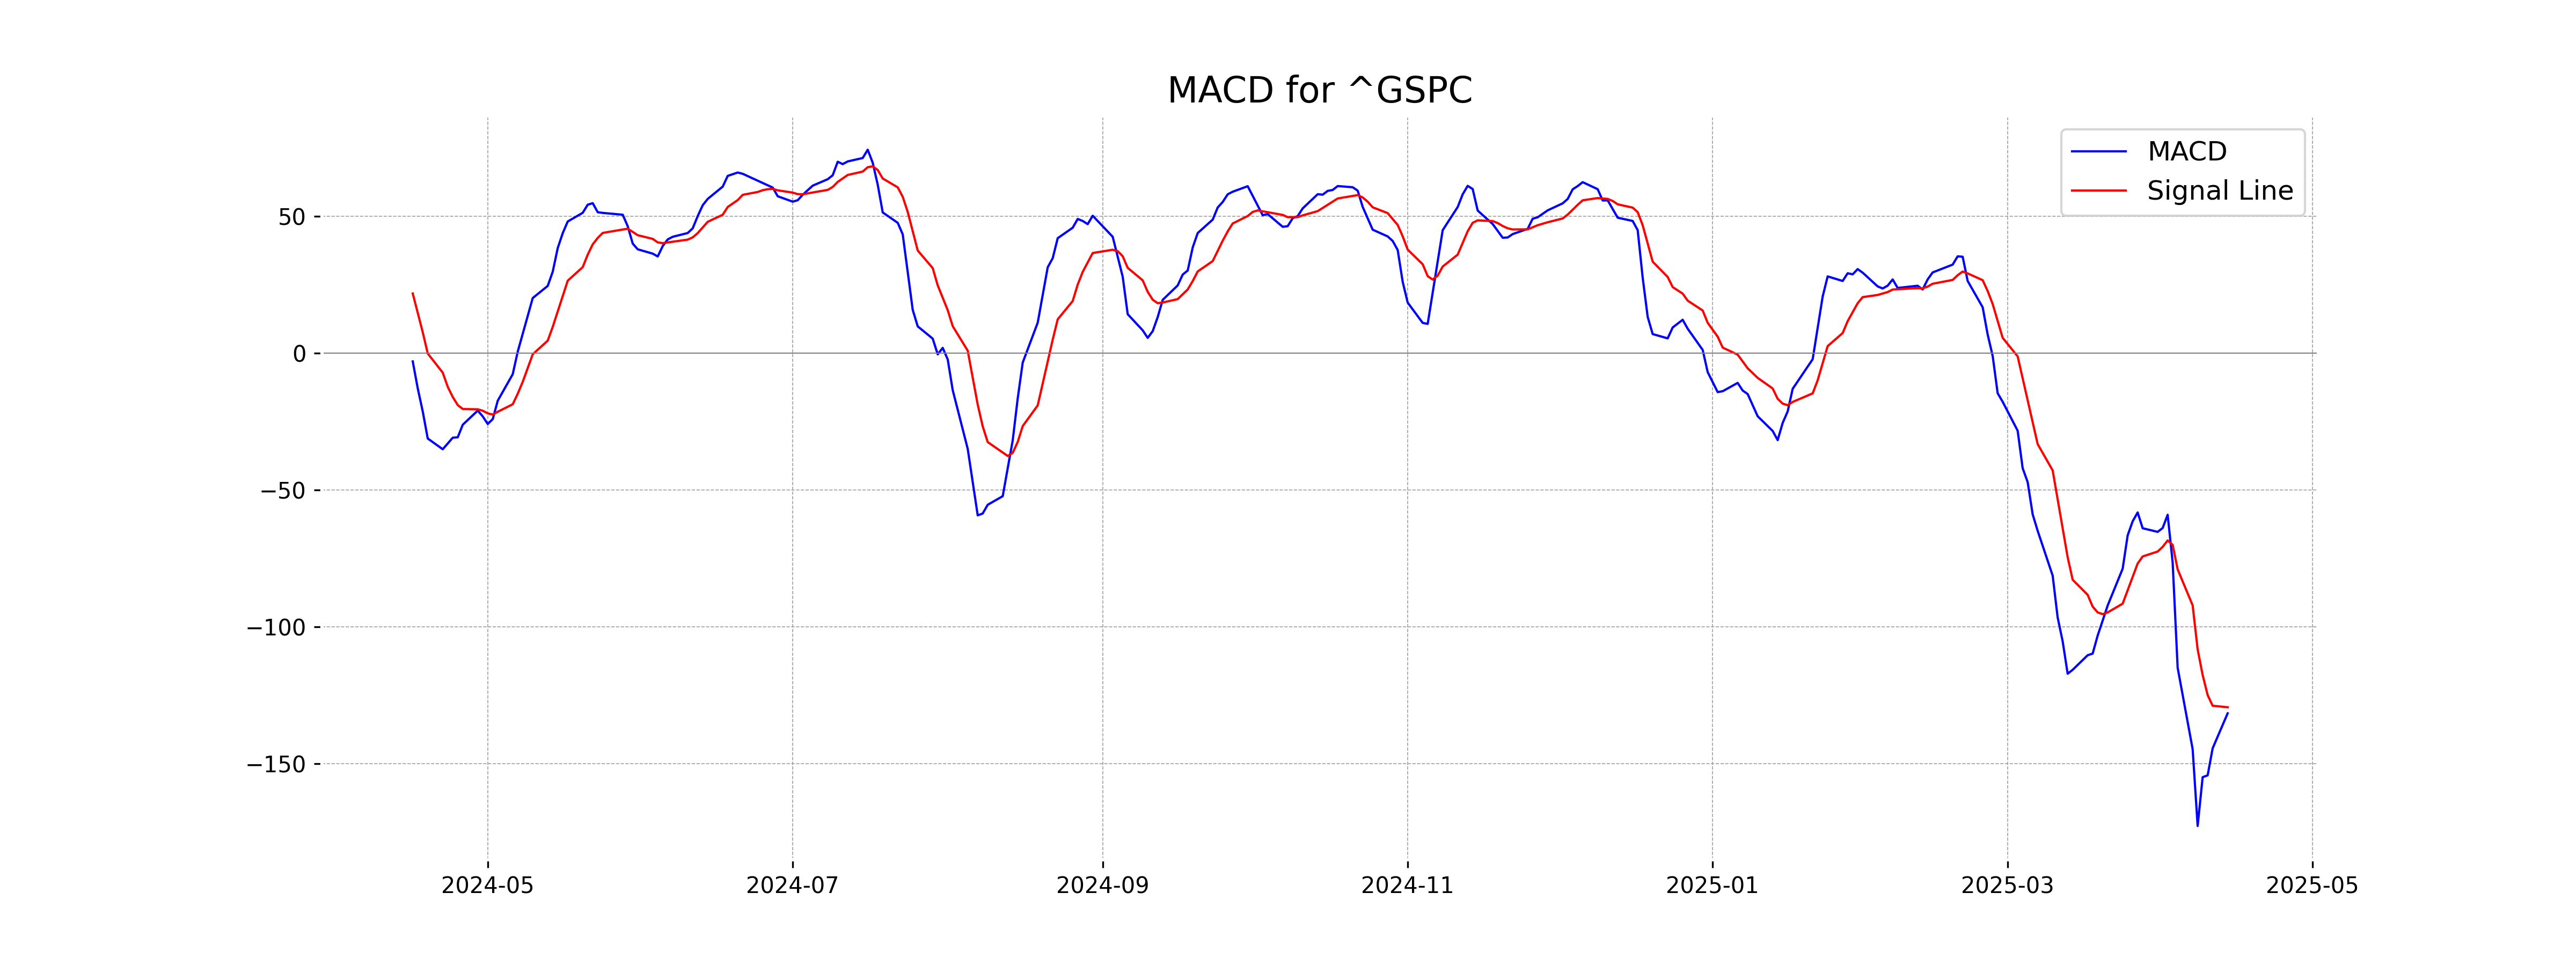
Moving Averages Trend (MACD)
The MACD for S&P 500 is -131.65, which is below the Signal line of -129.43, suggesting a bearish momentum in the market. This indicates that the recent downtrend may continue unless there's a change in momentum.
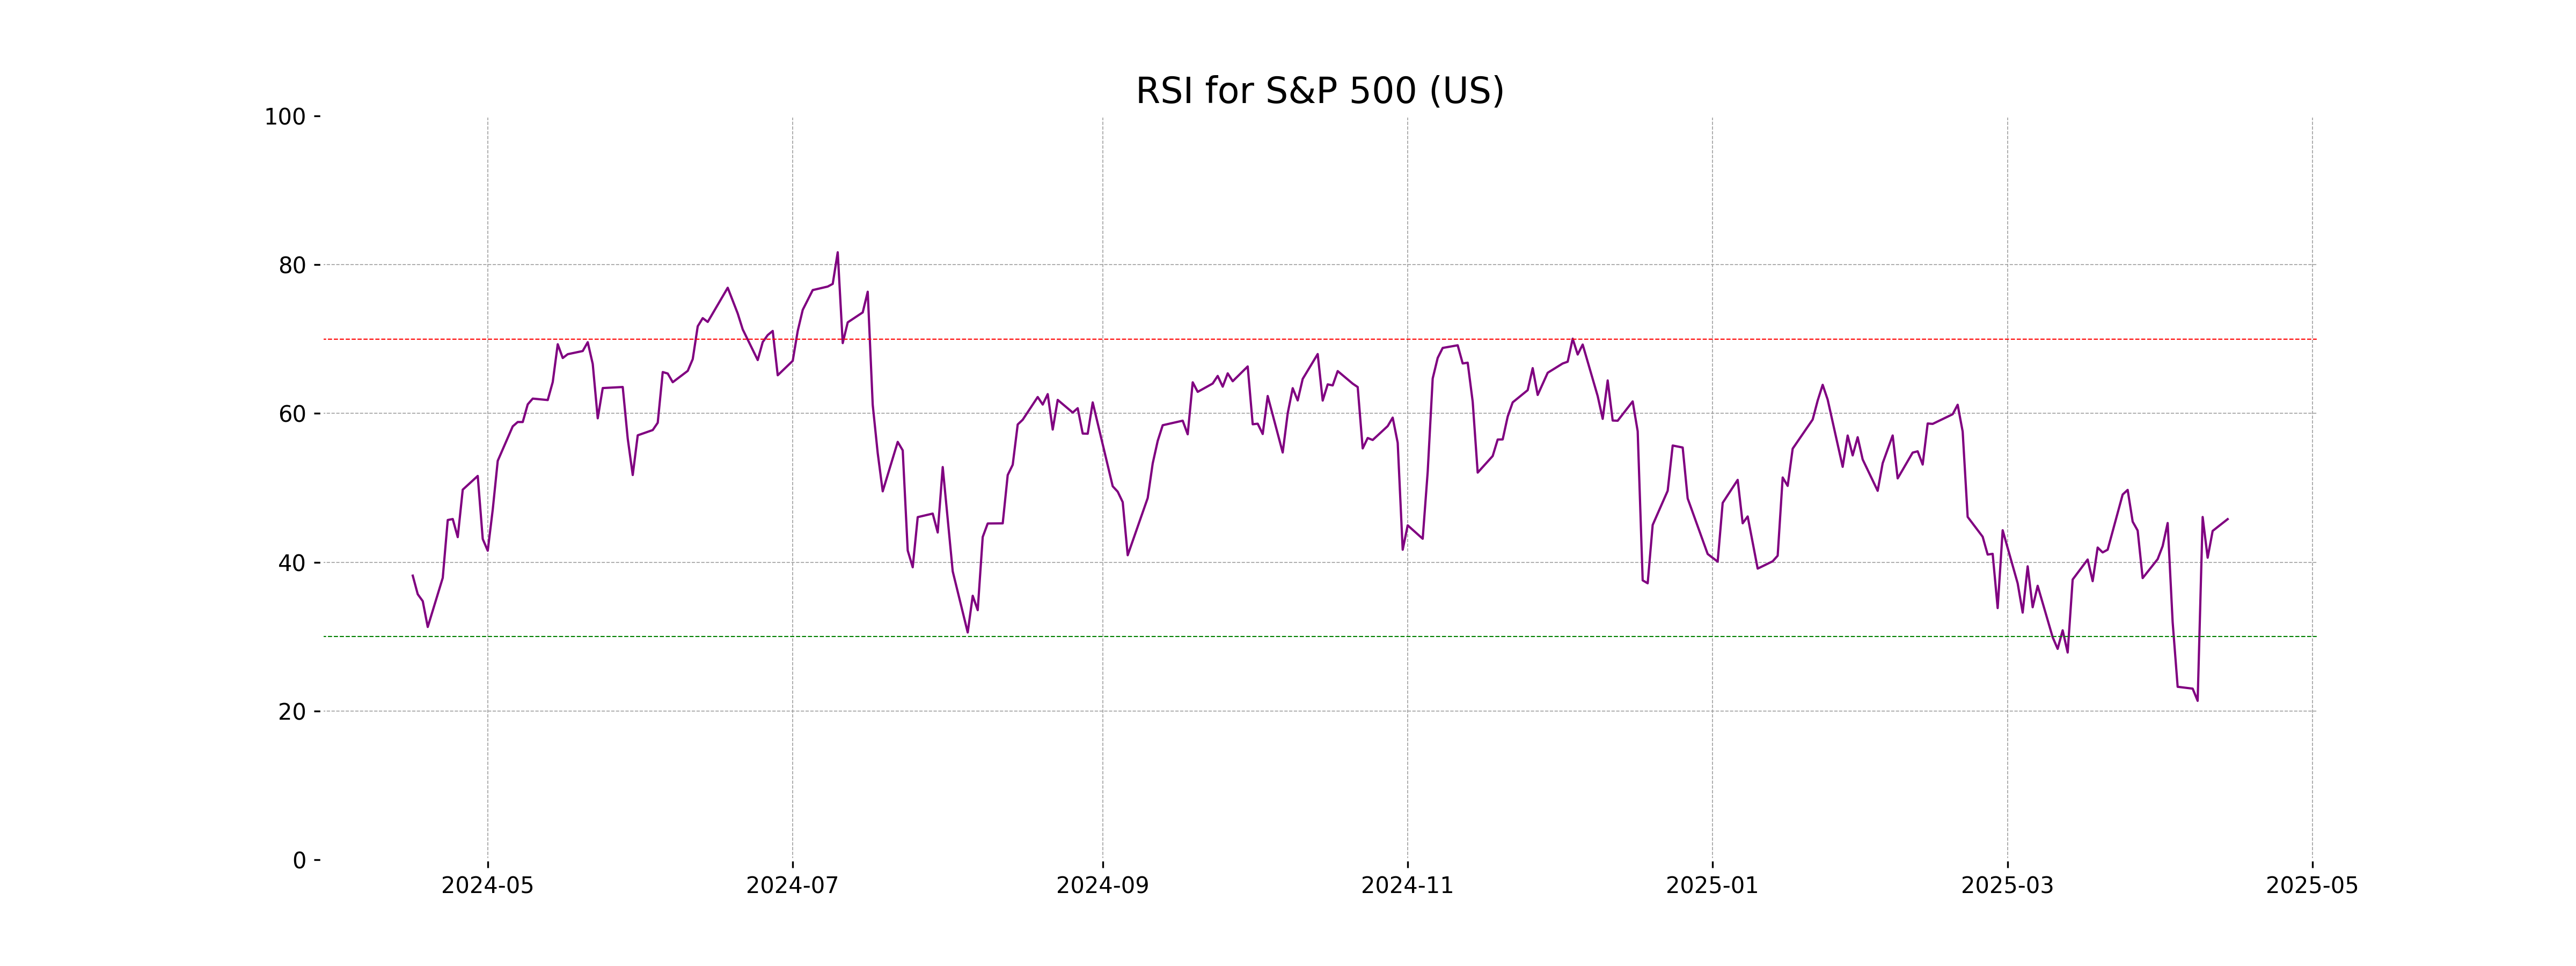
RSI Analysis
The Relative Strength Index (RSI) for the S&P 500 is 45.79, which is below the typical mid-point of 50. This suggests that the index is neither overbought nor oversold, leaning slightly towards a bearish sentiment.
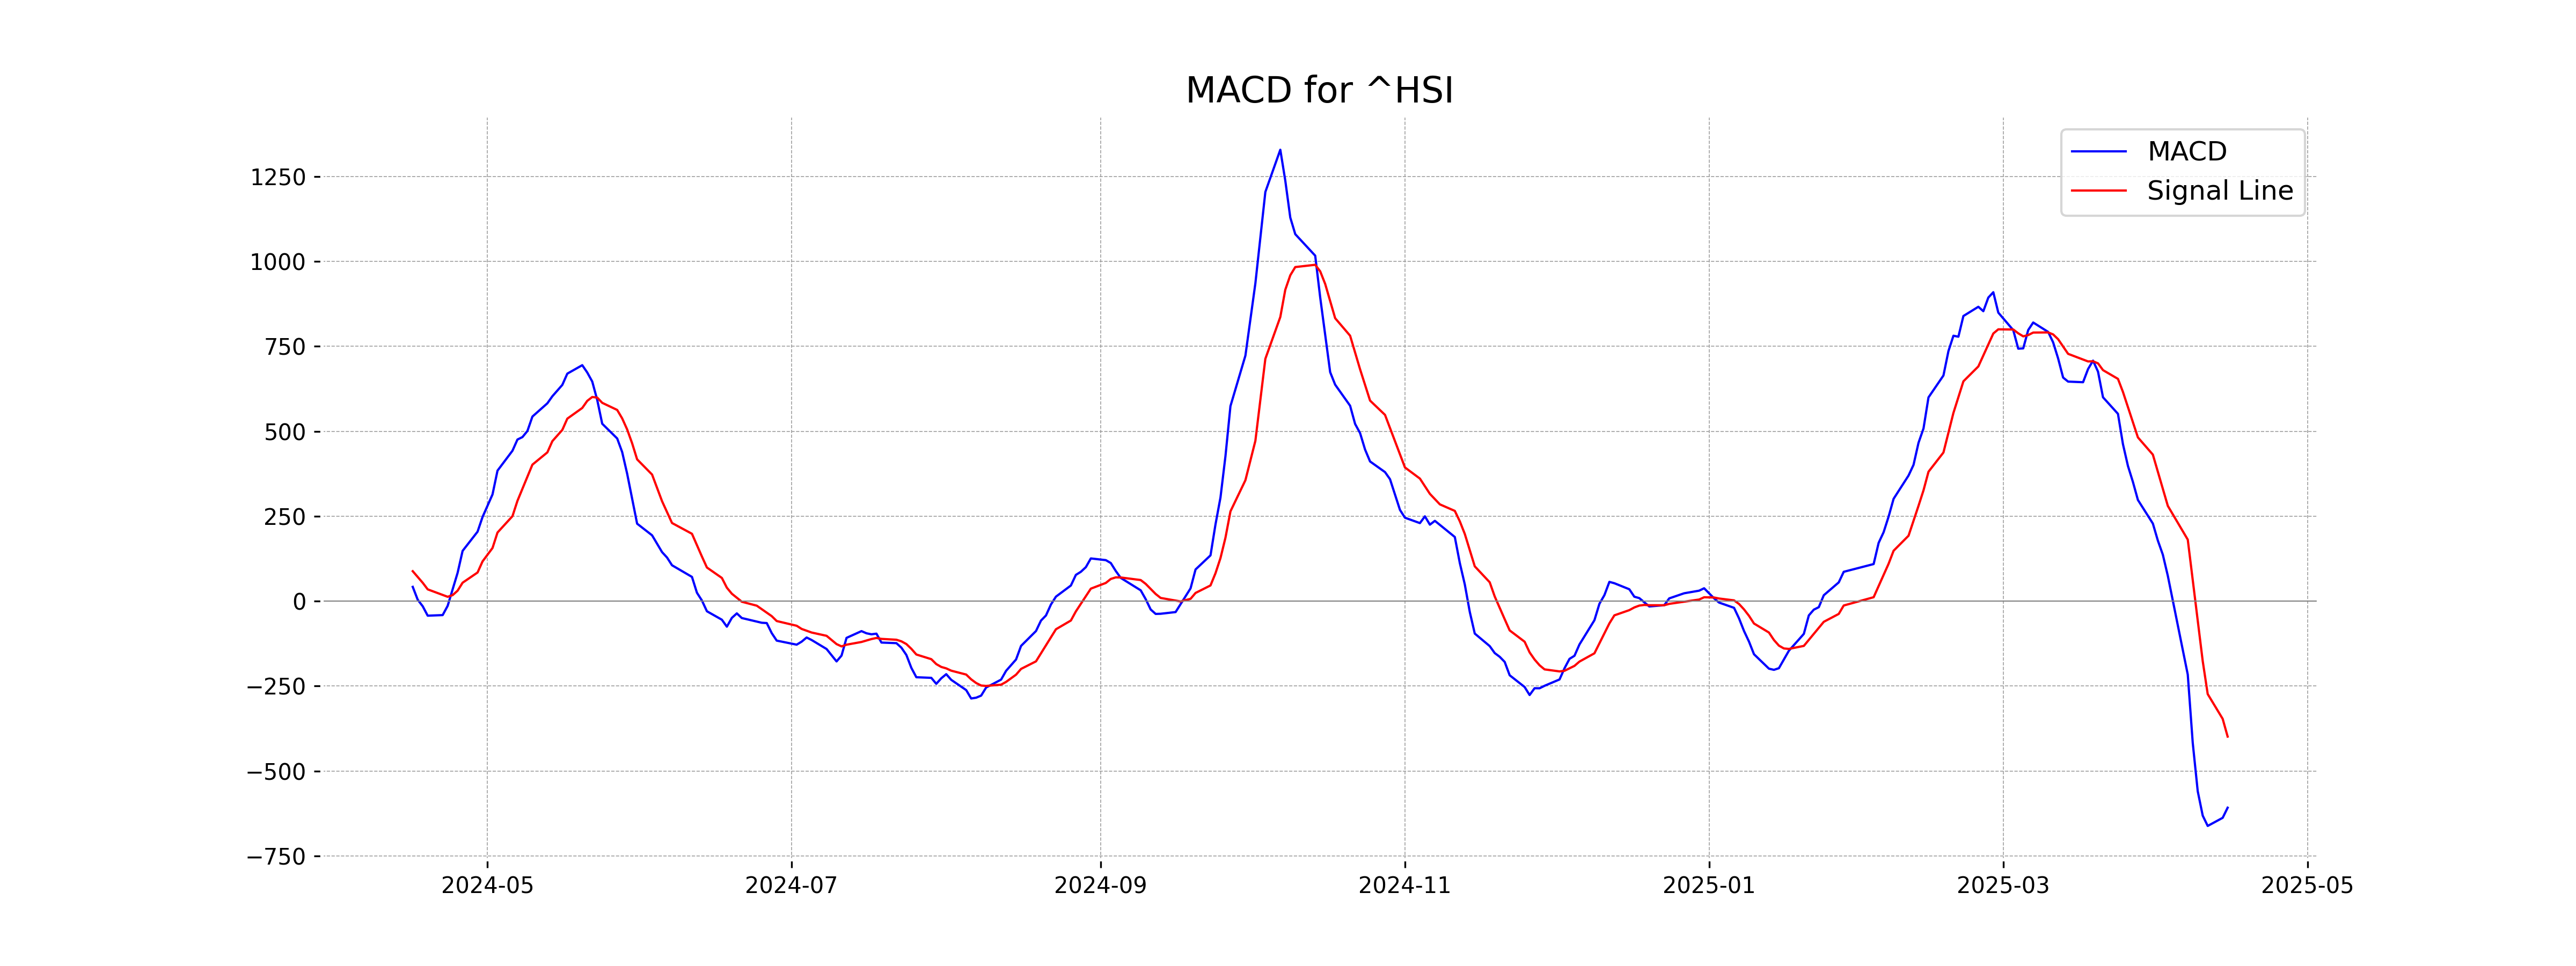
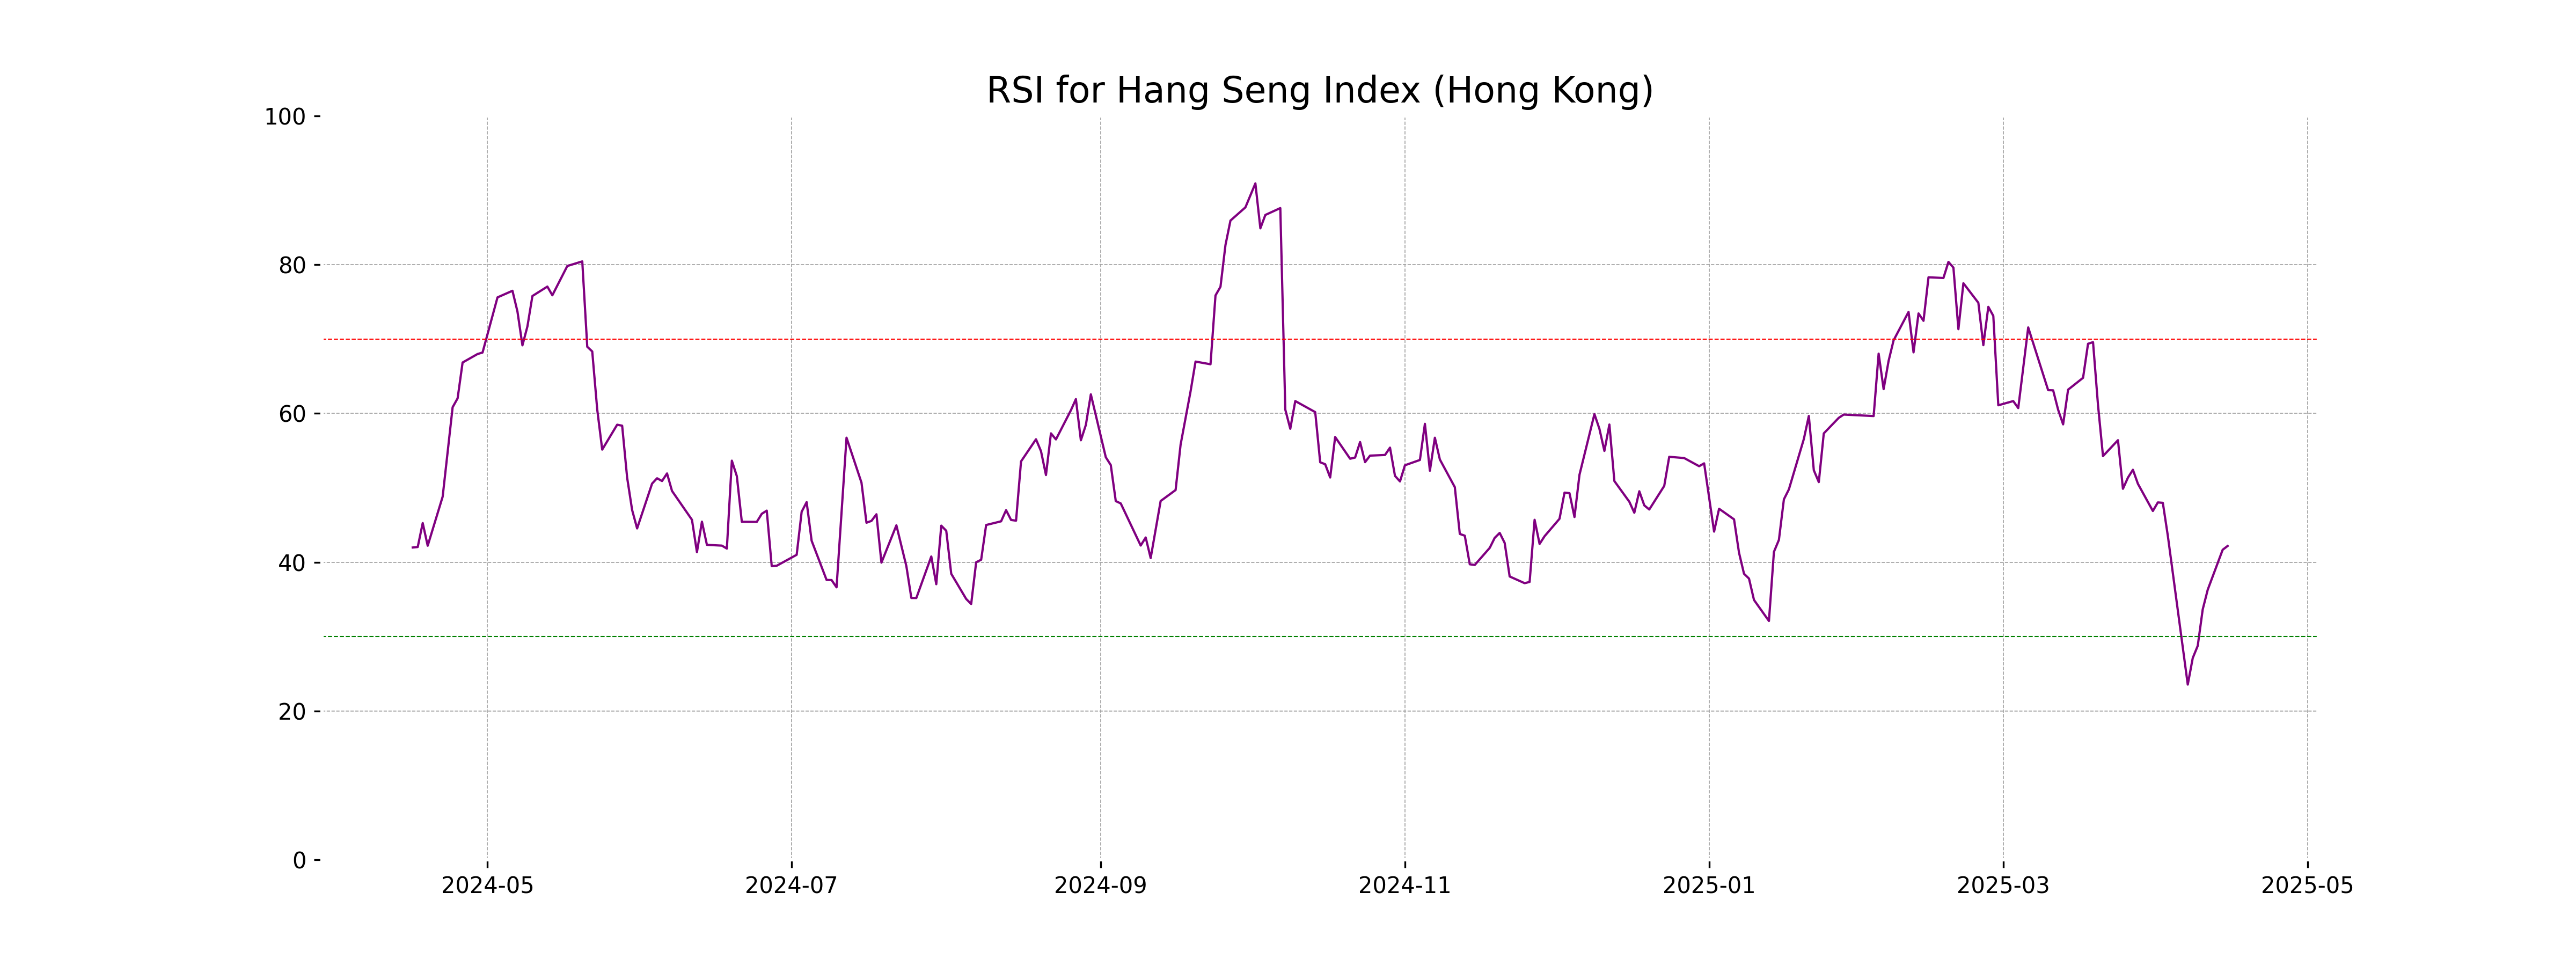
Analysis for Hang Seng Index (Hong Kong) - April 15, 2025

The Hang Seng Index (Hong Kong) opened at 21,603.52, reached a high of the same value, and closed at 21,466.27. It experienced a points change of 48.87 from the previous close of 21,417.40, resulting in a 0.23% increase. The RSI indicates relatively weak momentum at 42.19, and the MACD suggests a bearish trend with a value of -608.18.
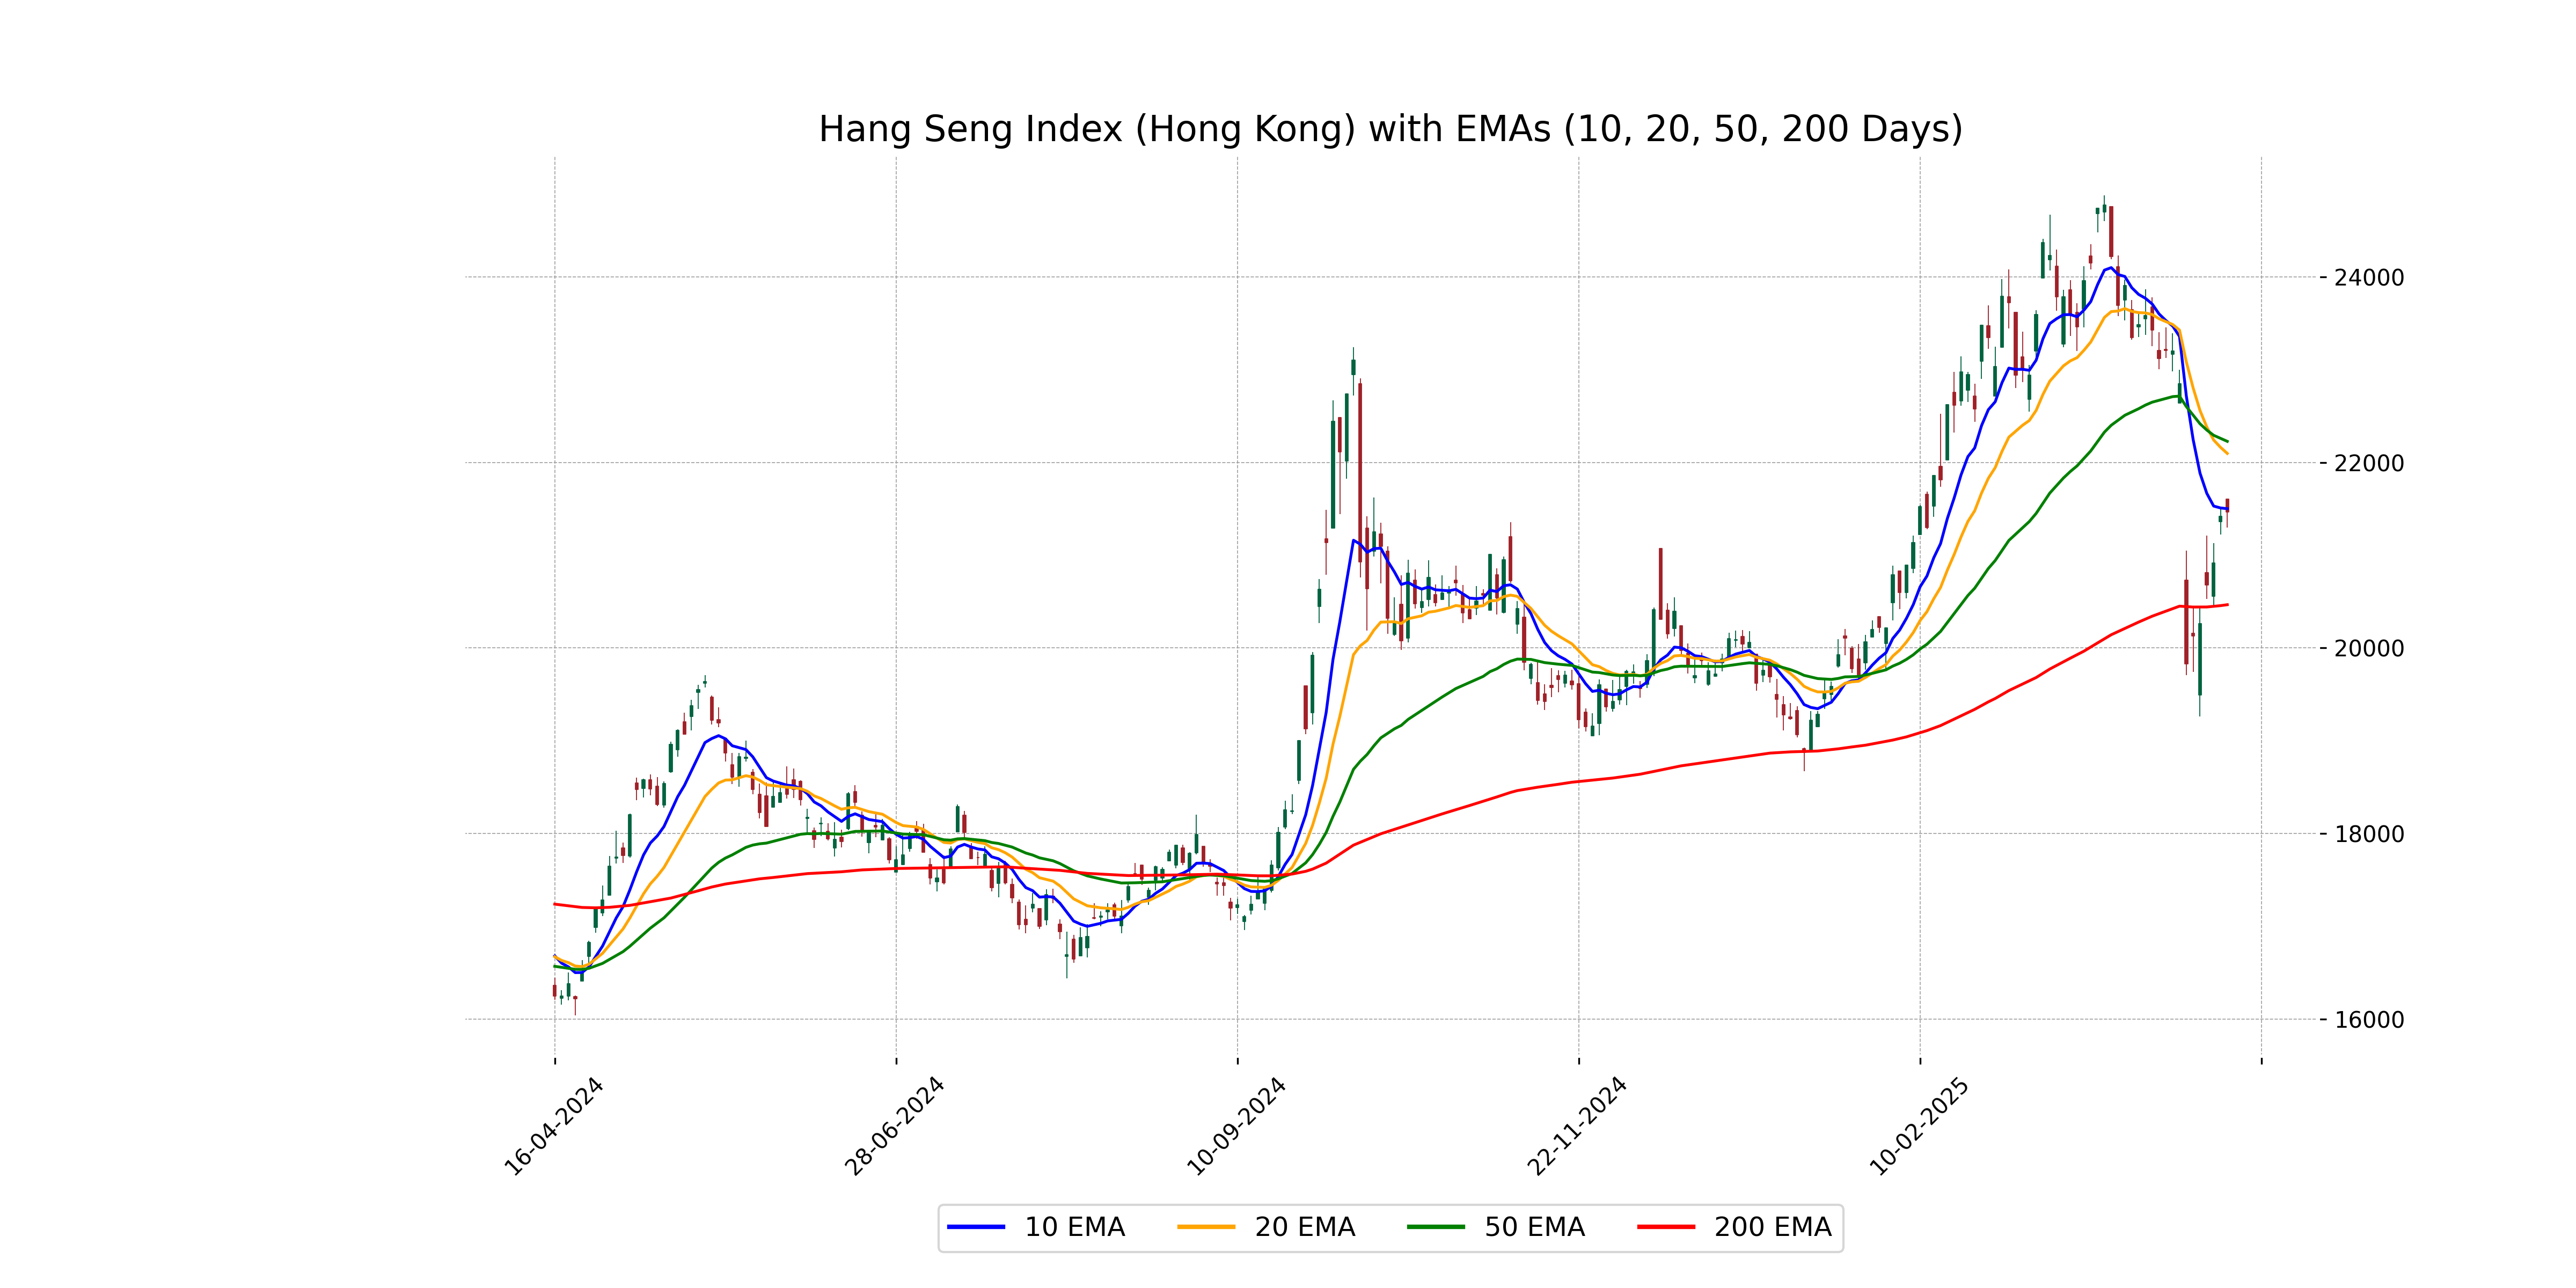
Relationship with Key Moving Averages
Based on the given data, the Hang Seng Index is trading below its 50 EMA and 20 EMA, indicating a current weak trend compared to these averages. However, it is trading slightly above the 200 EMA, suggesting potential support at this long-term level.
Moving Averages Trend (MACD)
The Hang Seng Index is exhibiting a bearish momentum as indicated by the MACD value of -608.18, which is below the MACD Signal line of -398.90. This suggests a potential continuation of the downward trend, reflecting the recent weakening in the index's performance.
RSI Analysis
The RSI (Relative Strength Index) for the Hang Seng Index is 42.19. Typically, an RSI below 30 is considered oversold, and above 70 is considered overbought. With an RSI of 42.19, the index is in the neutral zone, suggesting neither strong upward nor downward momentum at this time.
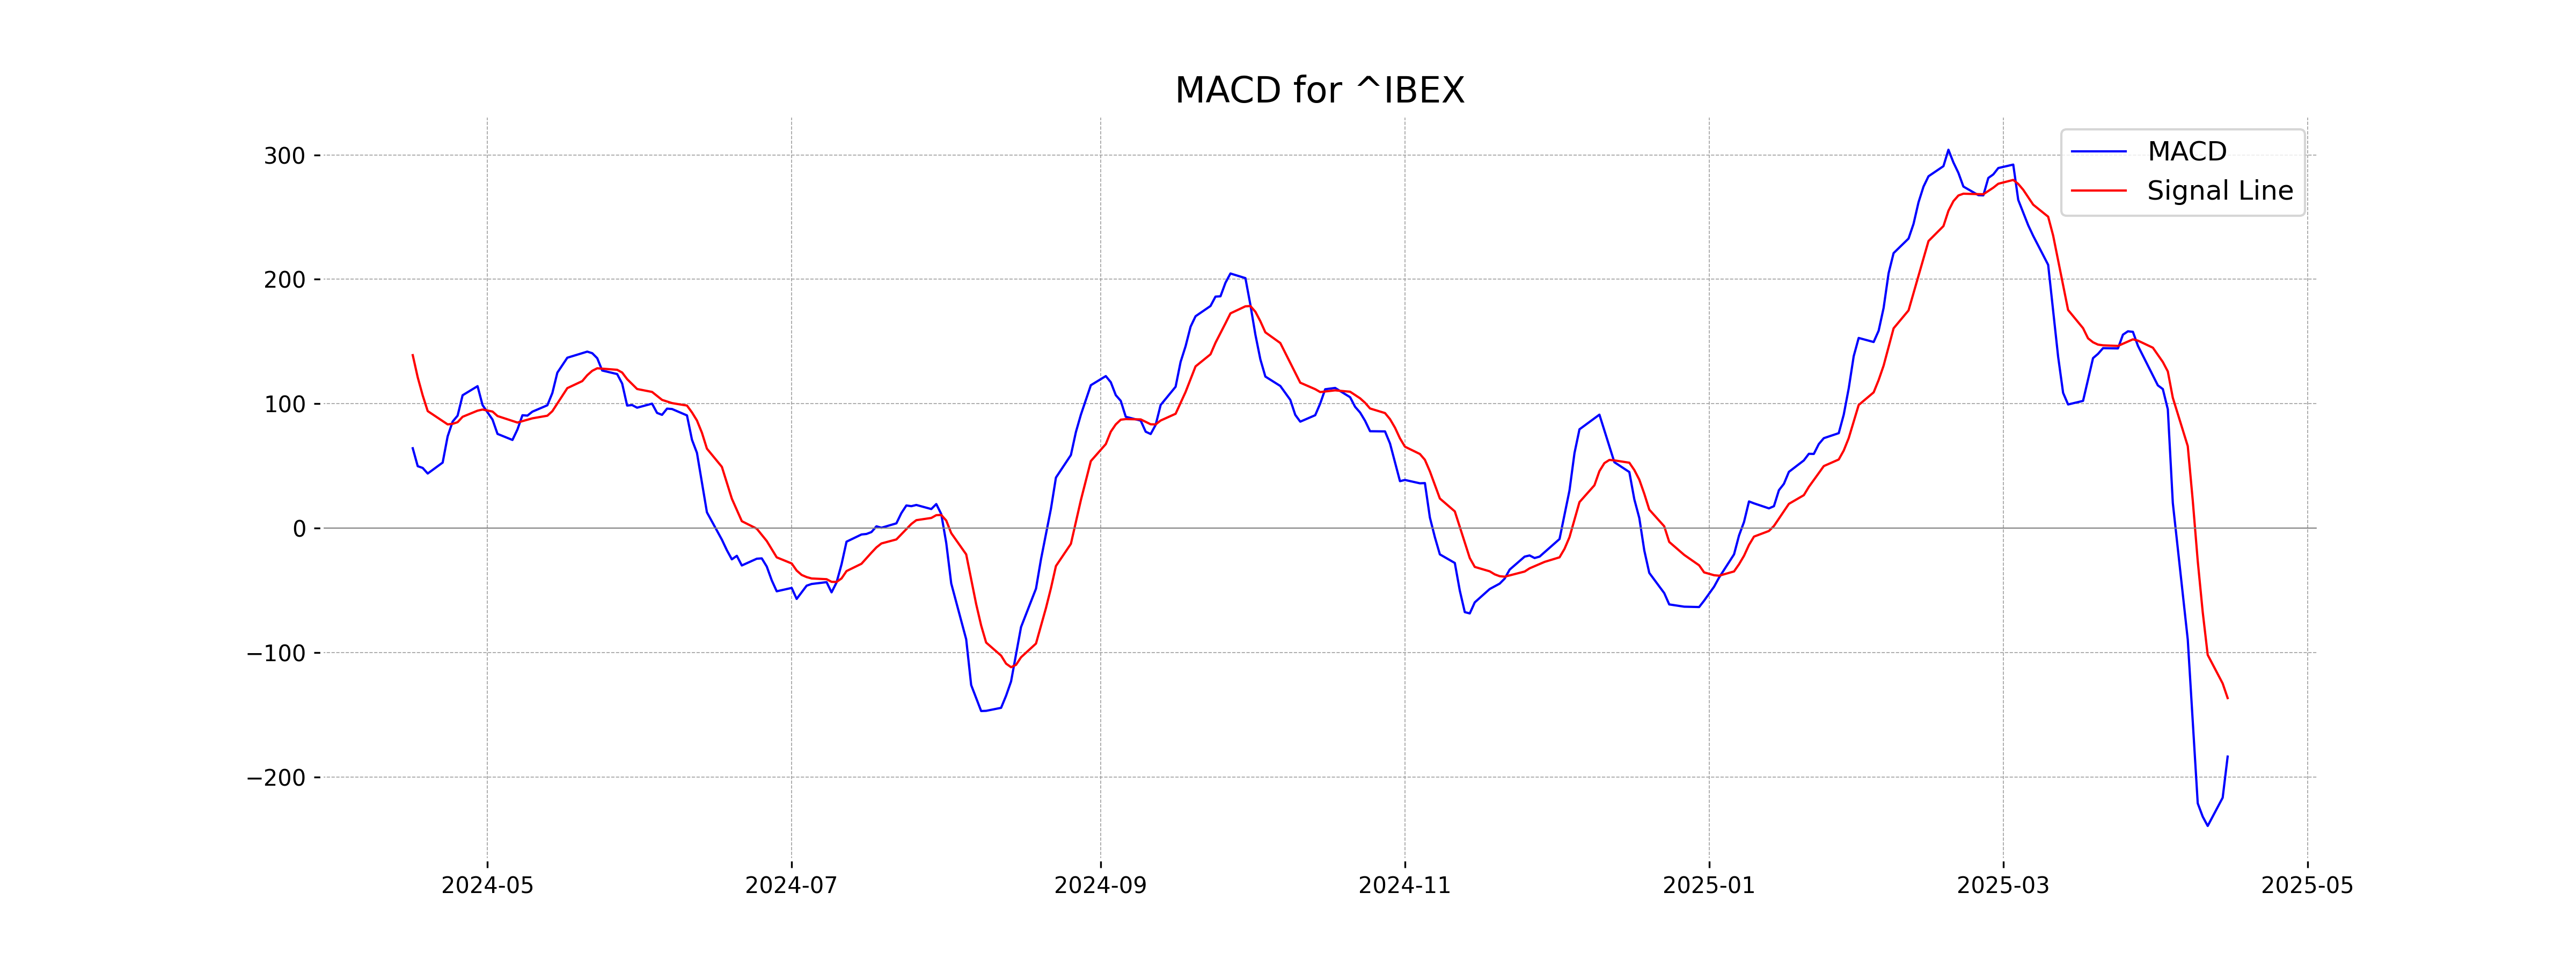
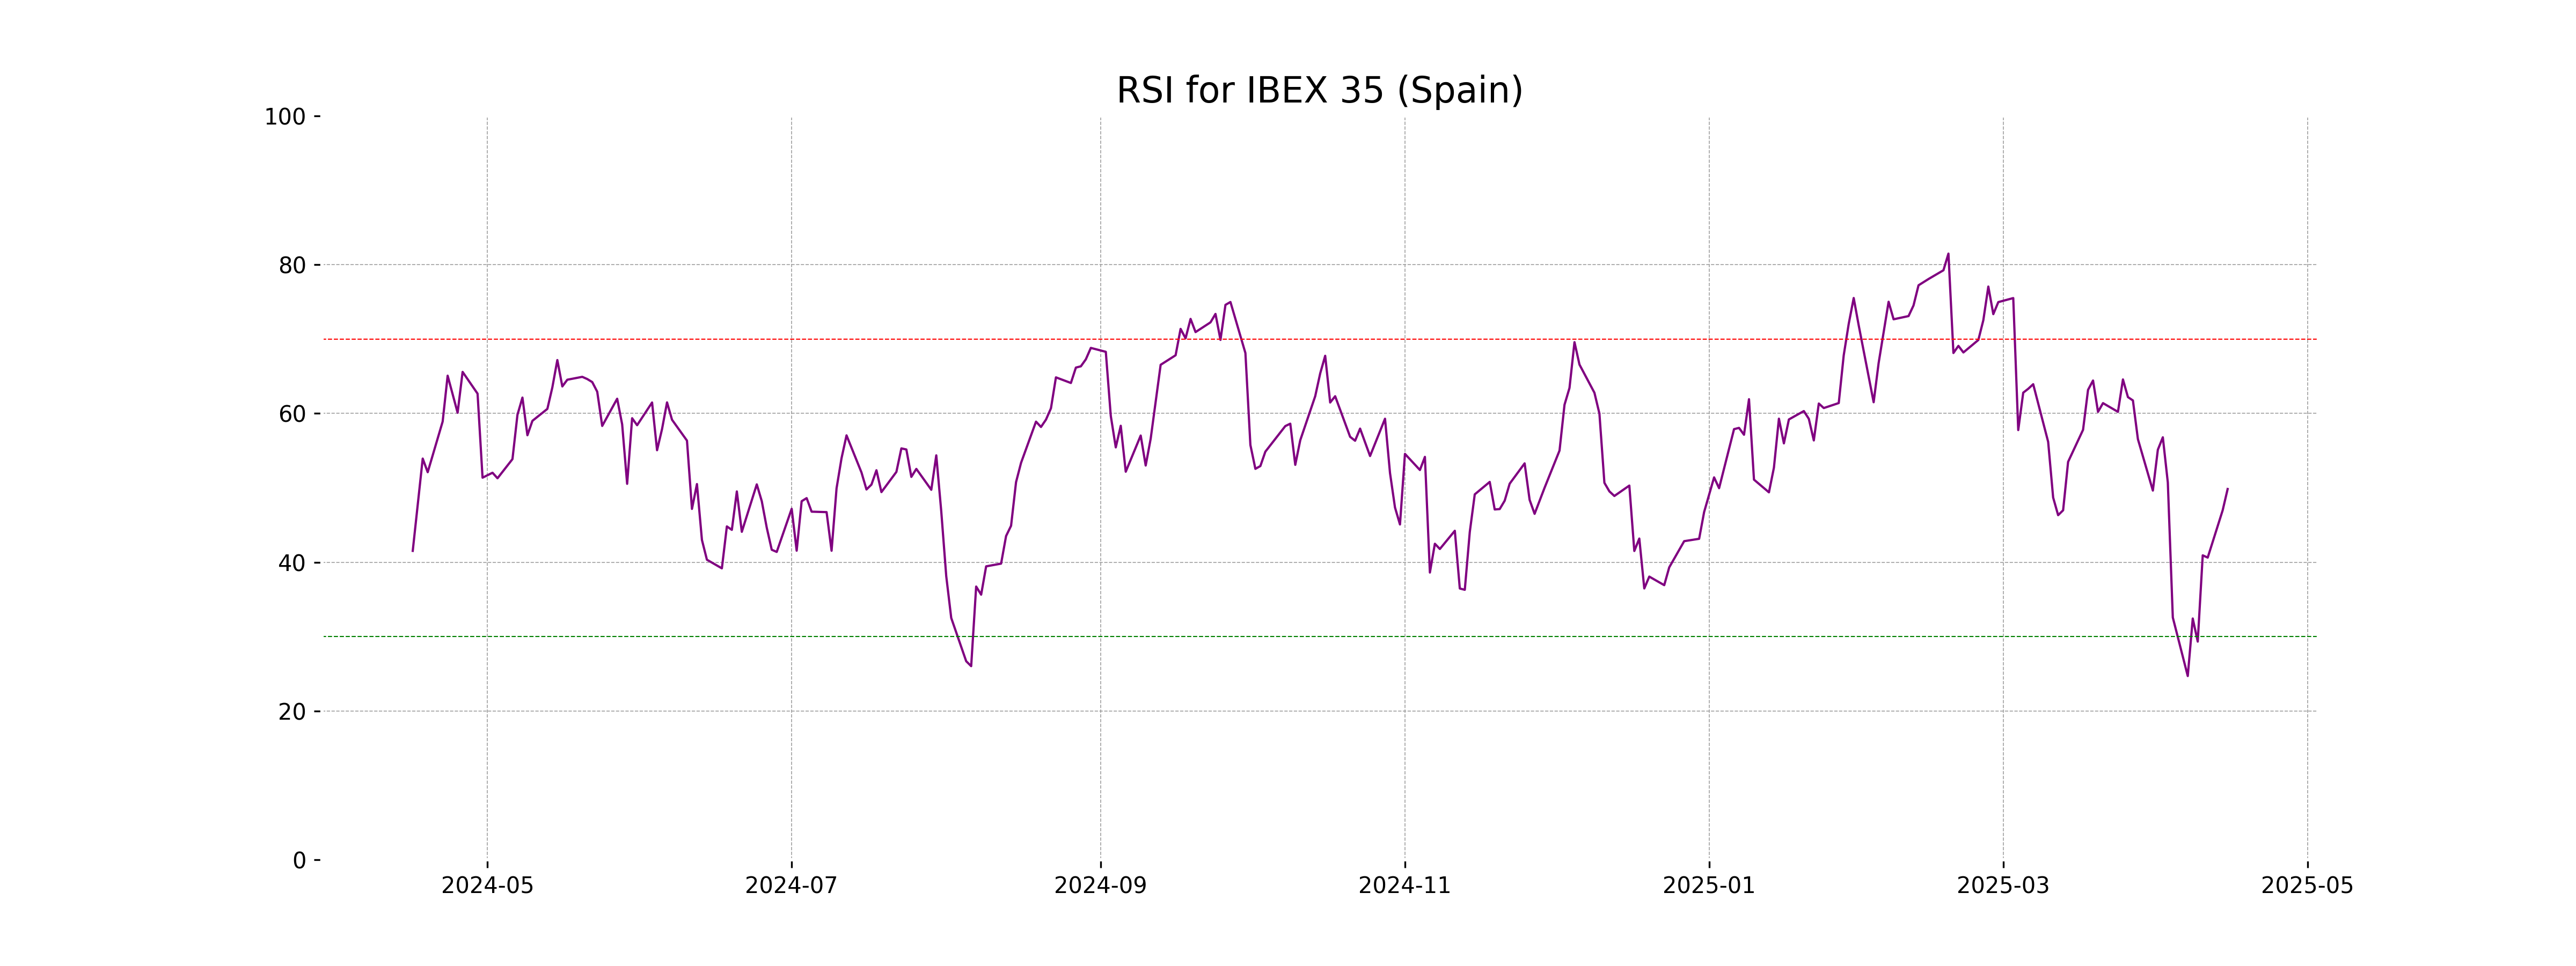
Analysis for IBEX 35 (Spain) - April 15, 2025

The IBEX 35 index opened at 12,649.40 and closed at 12,770.10, marking a gain with a 1.27% change and an increase of 160.30 points from the previous close of 12,609.80. The index demonstrated a slightly higher movement compared to its 50-day EMA of 12,757.03, and the RSI was approximately neutral at 49.84, indicating minimal momentum.
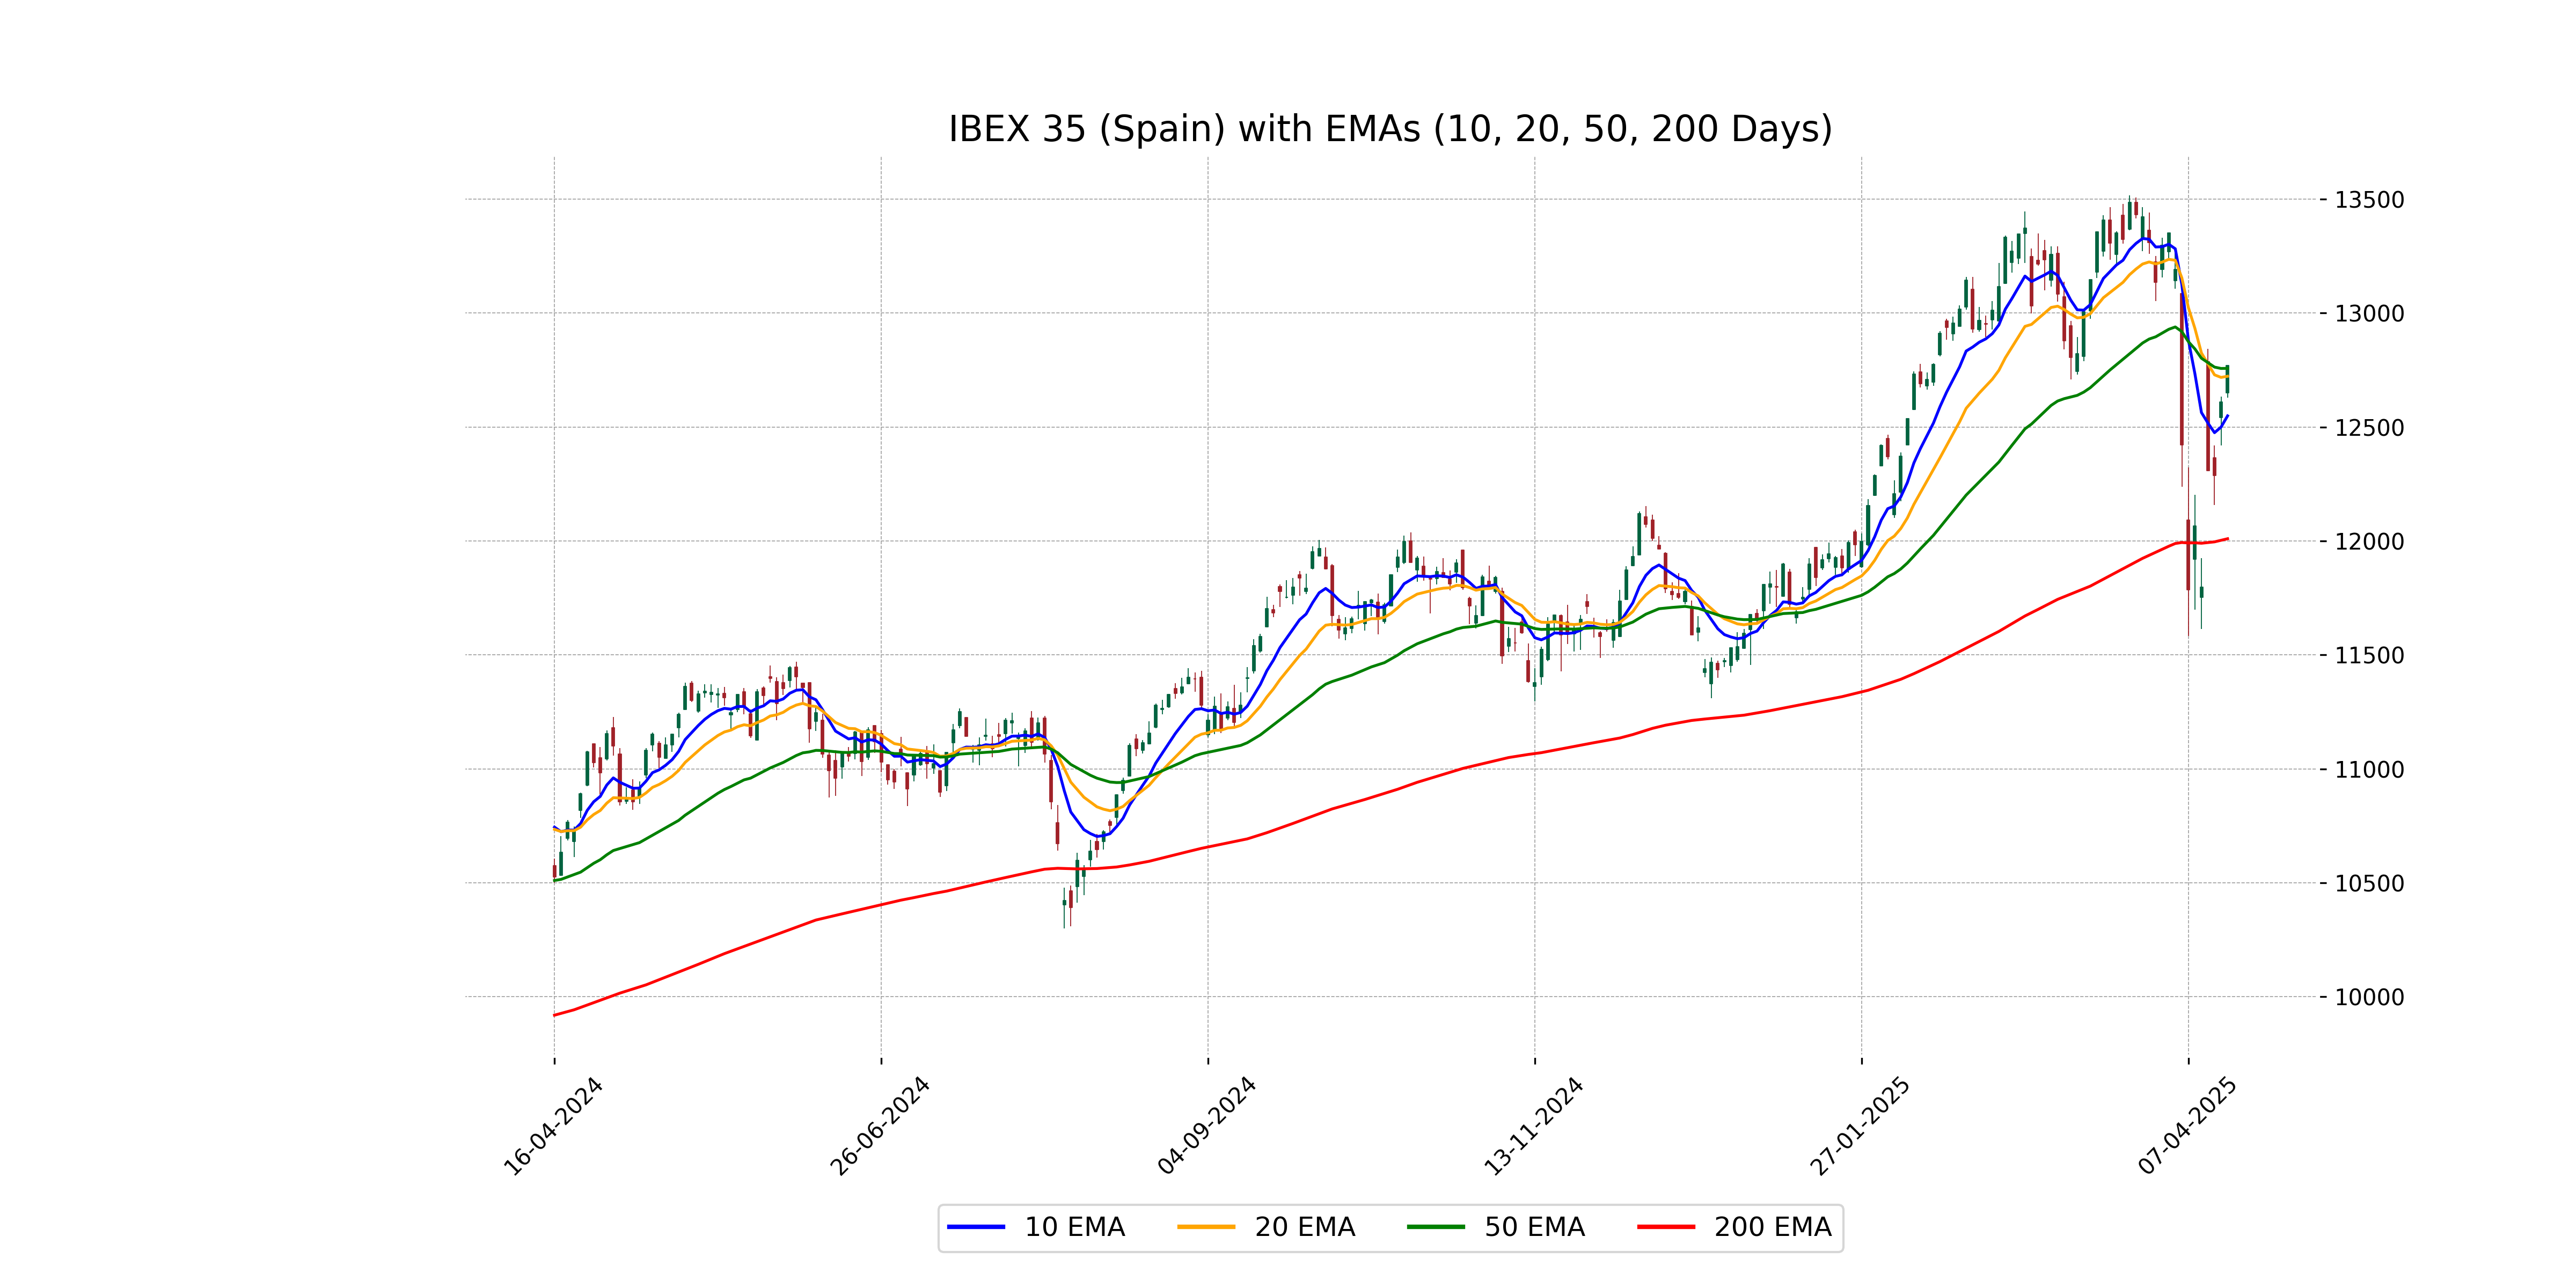
Relationship with Key Moving Averages
The closing value of IBEX 35 at 12770.10 is above its 10 EMA (12548.55) and 50 EMA (12757.03), indicating short-term upward momentum. However, it is still above its 200 EMA (12009.53), suggesting a strong long-term positive trend.
Moving Averages Trend (MACD)
MACD Analysis for IBEX 35 (Spain): The MACD value of -183.66 is below the MACD Signal Line of -136.63, suggesting a bearish trend. This indicates potential continued downward momentum in the near term, and investors may approach with caution.
RSI Analysis
The RSI for IBEX 35 is 49.84, indicating it is in a neutral zone. This suggests that the index is neither overbought nor oversold at the moment. Traders might look for additional indicators to determine potential market trends.
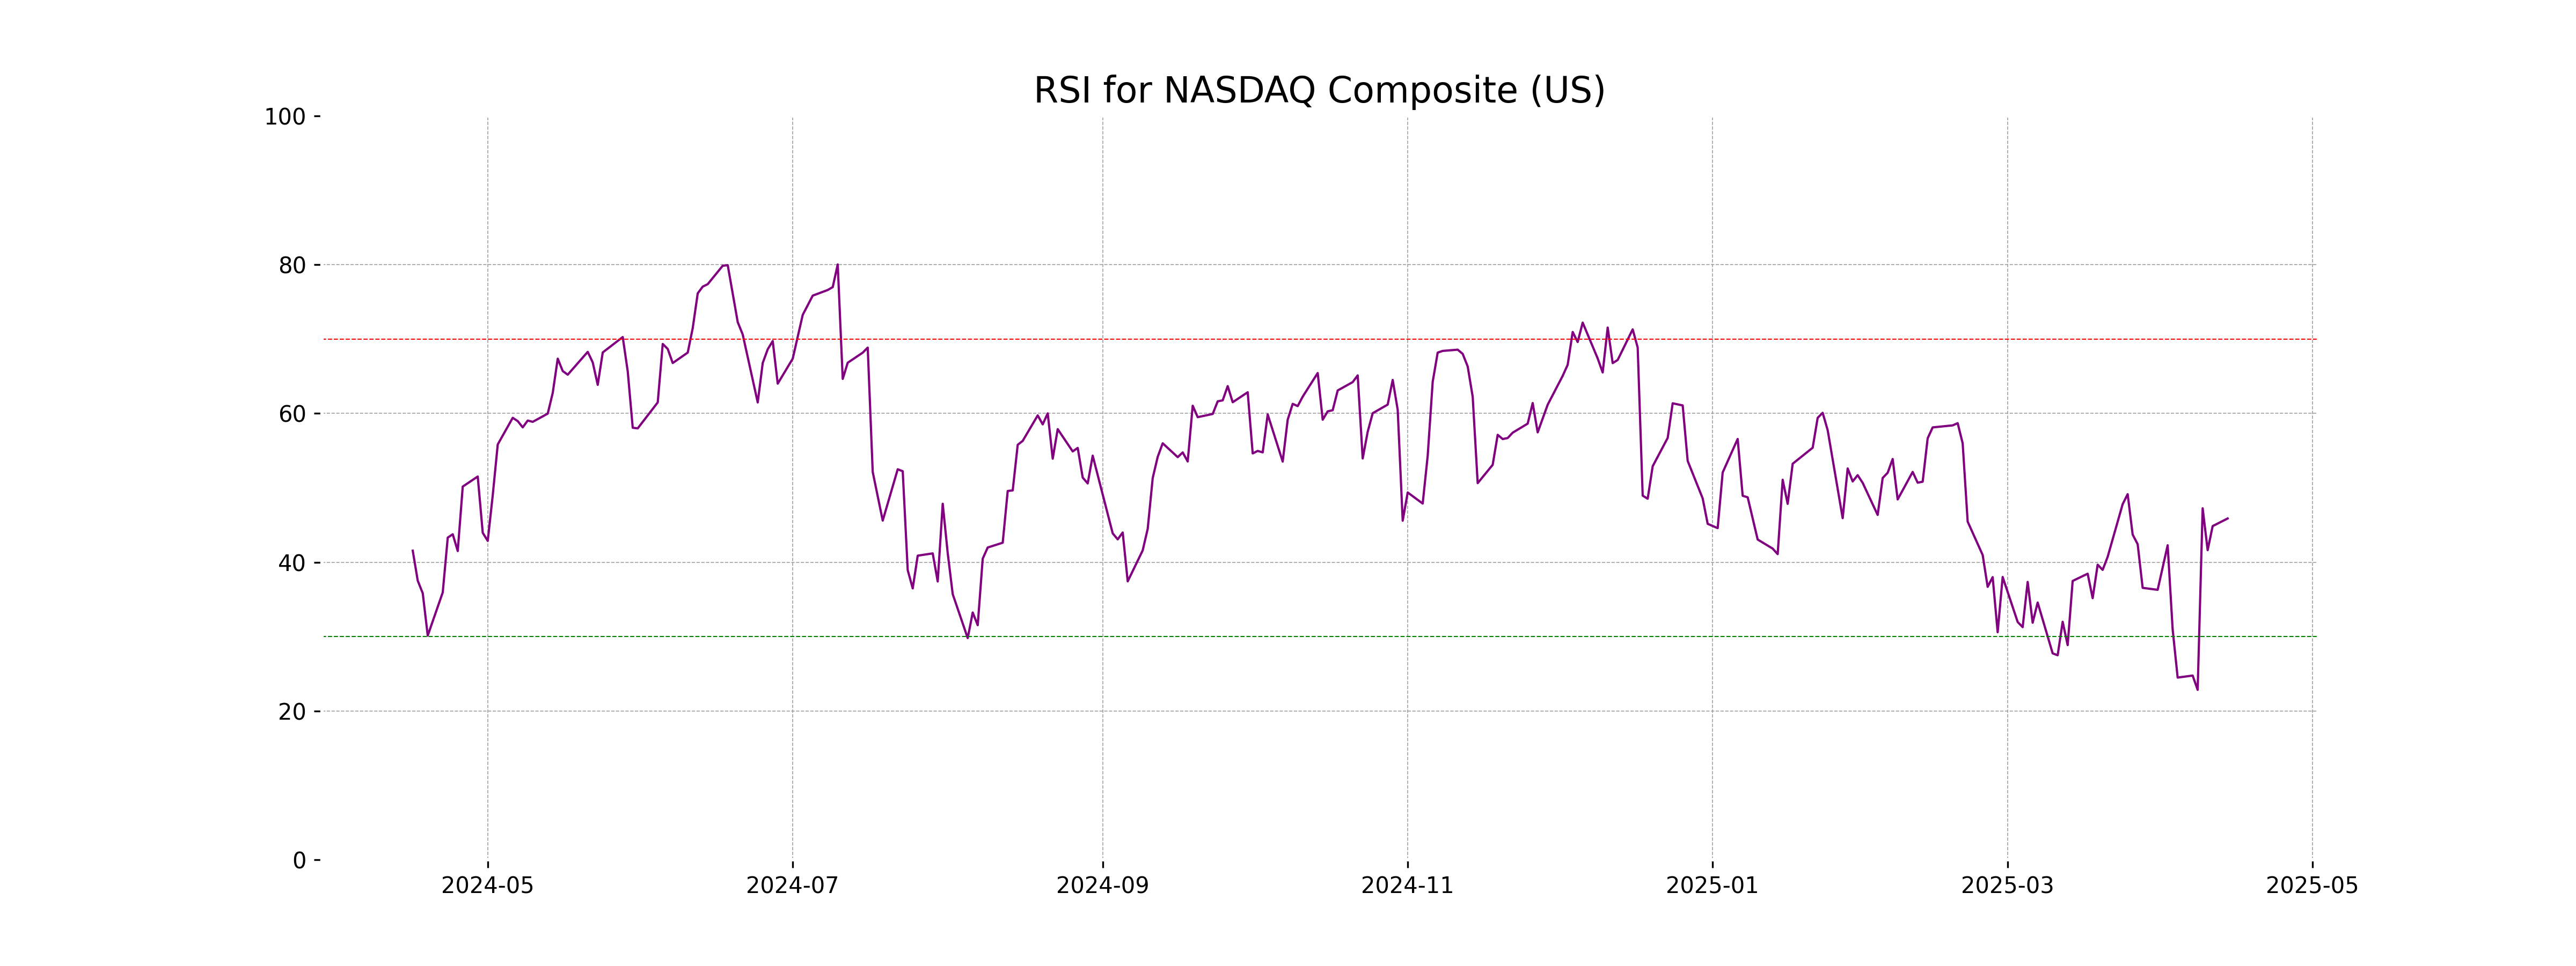
Analysis for NASDAQ Composite (US) - April 15, 2025
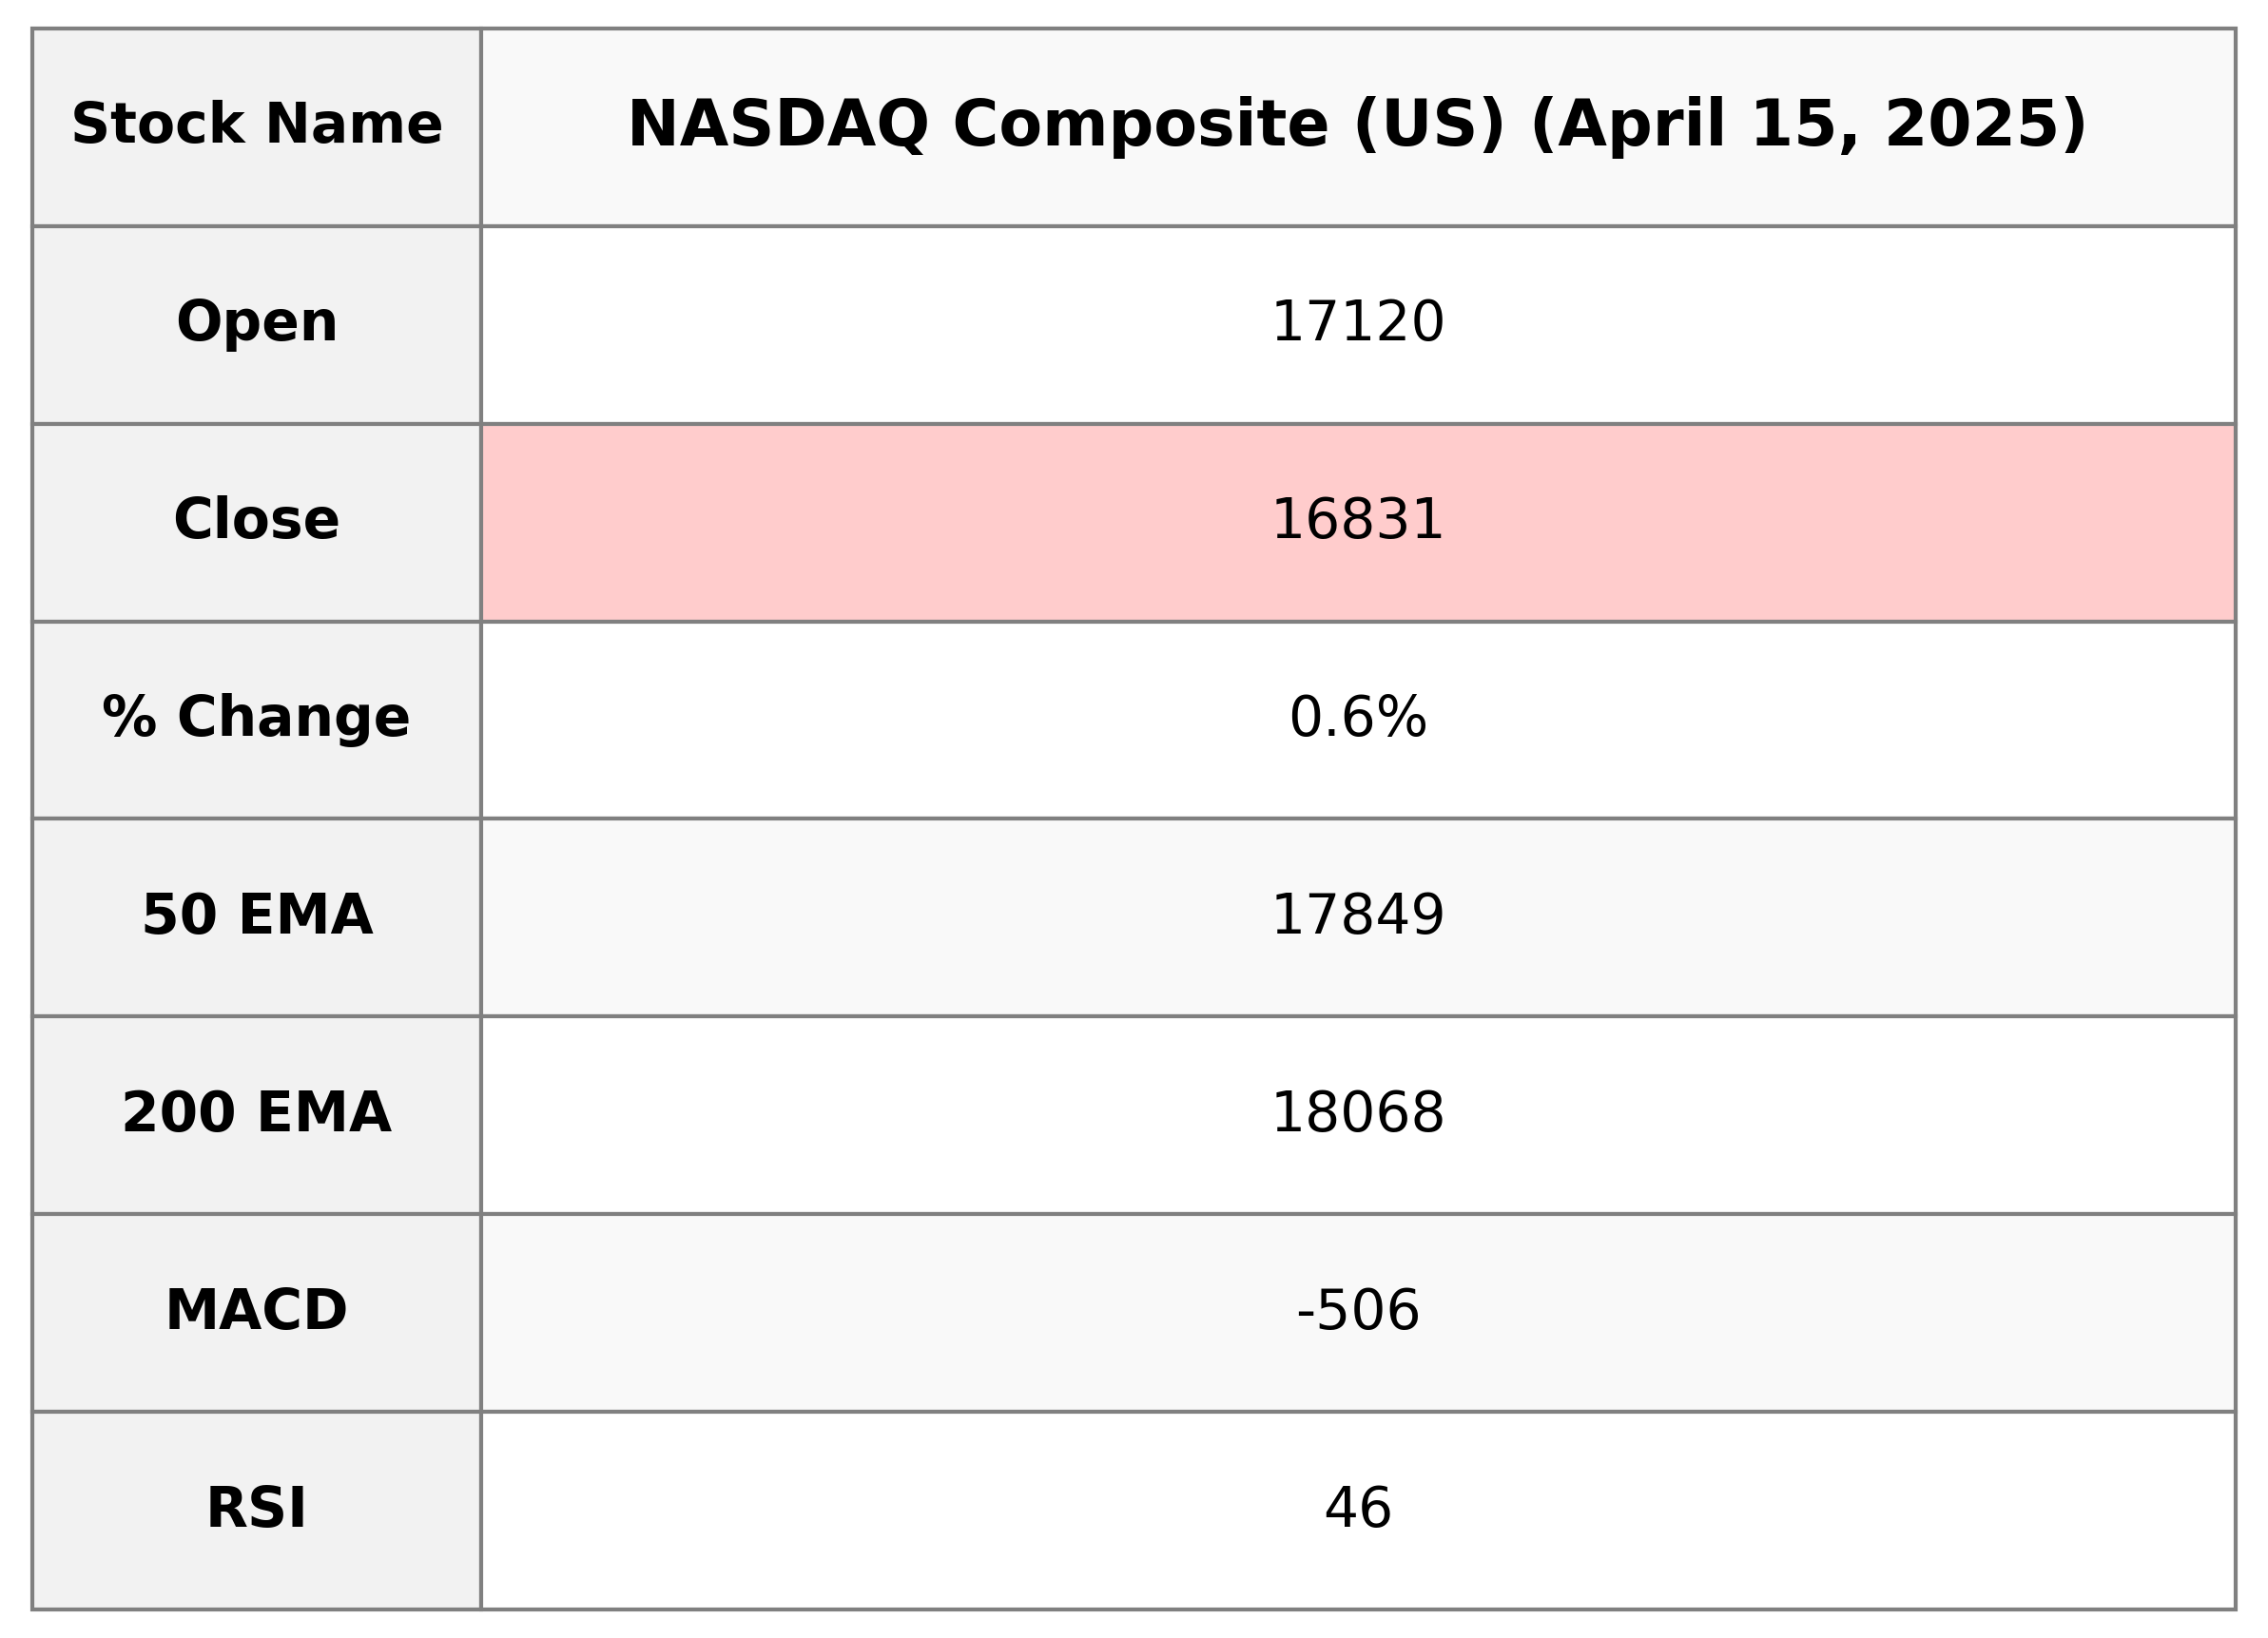
NASDAQ Composite (US) opened at 17120.44 and closed at 16831.48, signifying a gain of 0.64% from the previous close of 16724.46. Despite this positive movement, the index remains below its 50 and 200-day EMAs, suggesting a possible bearish trend, while the RSI of 45.88 indicates the market is neither overbought nor oversold.
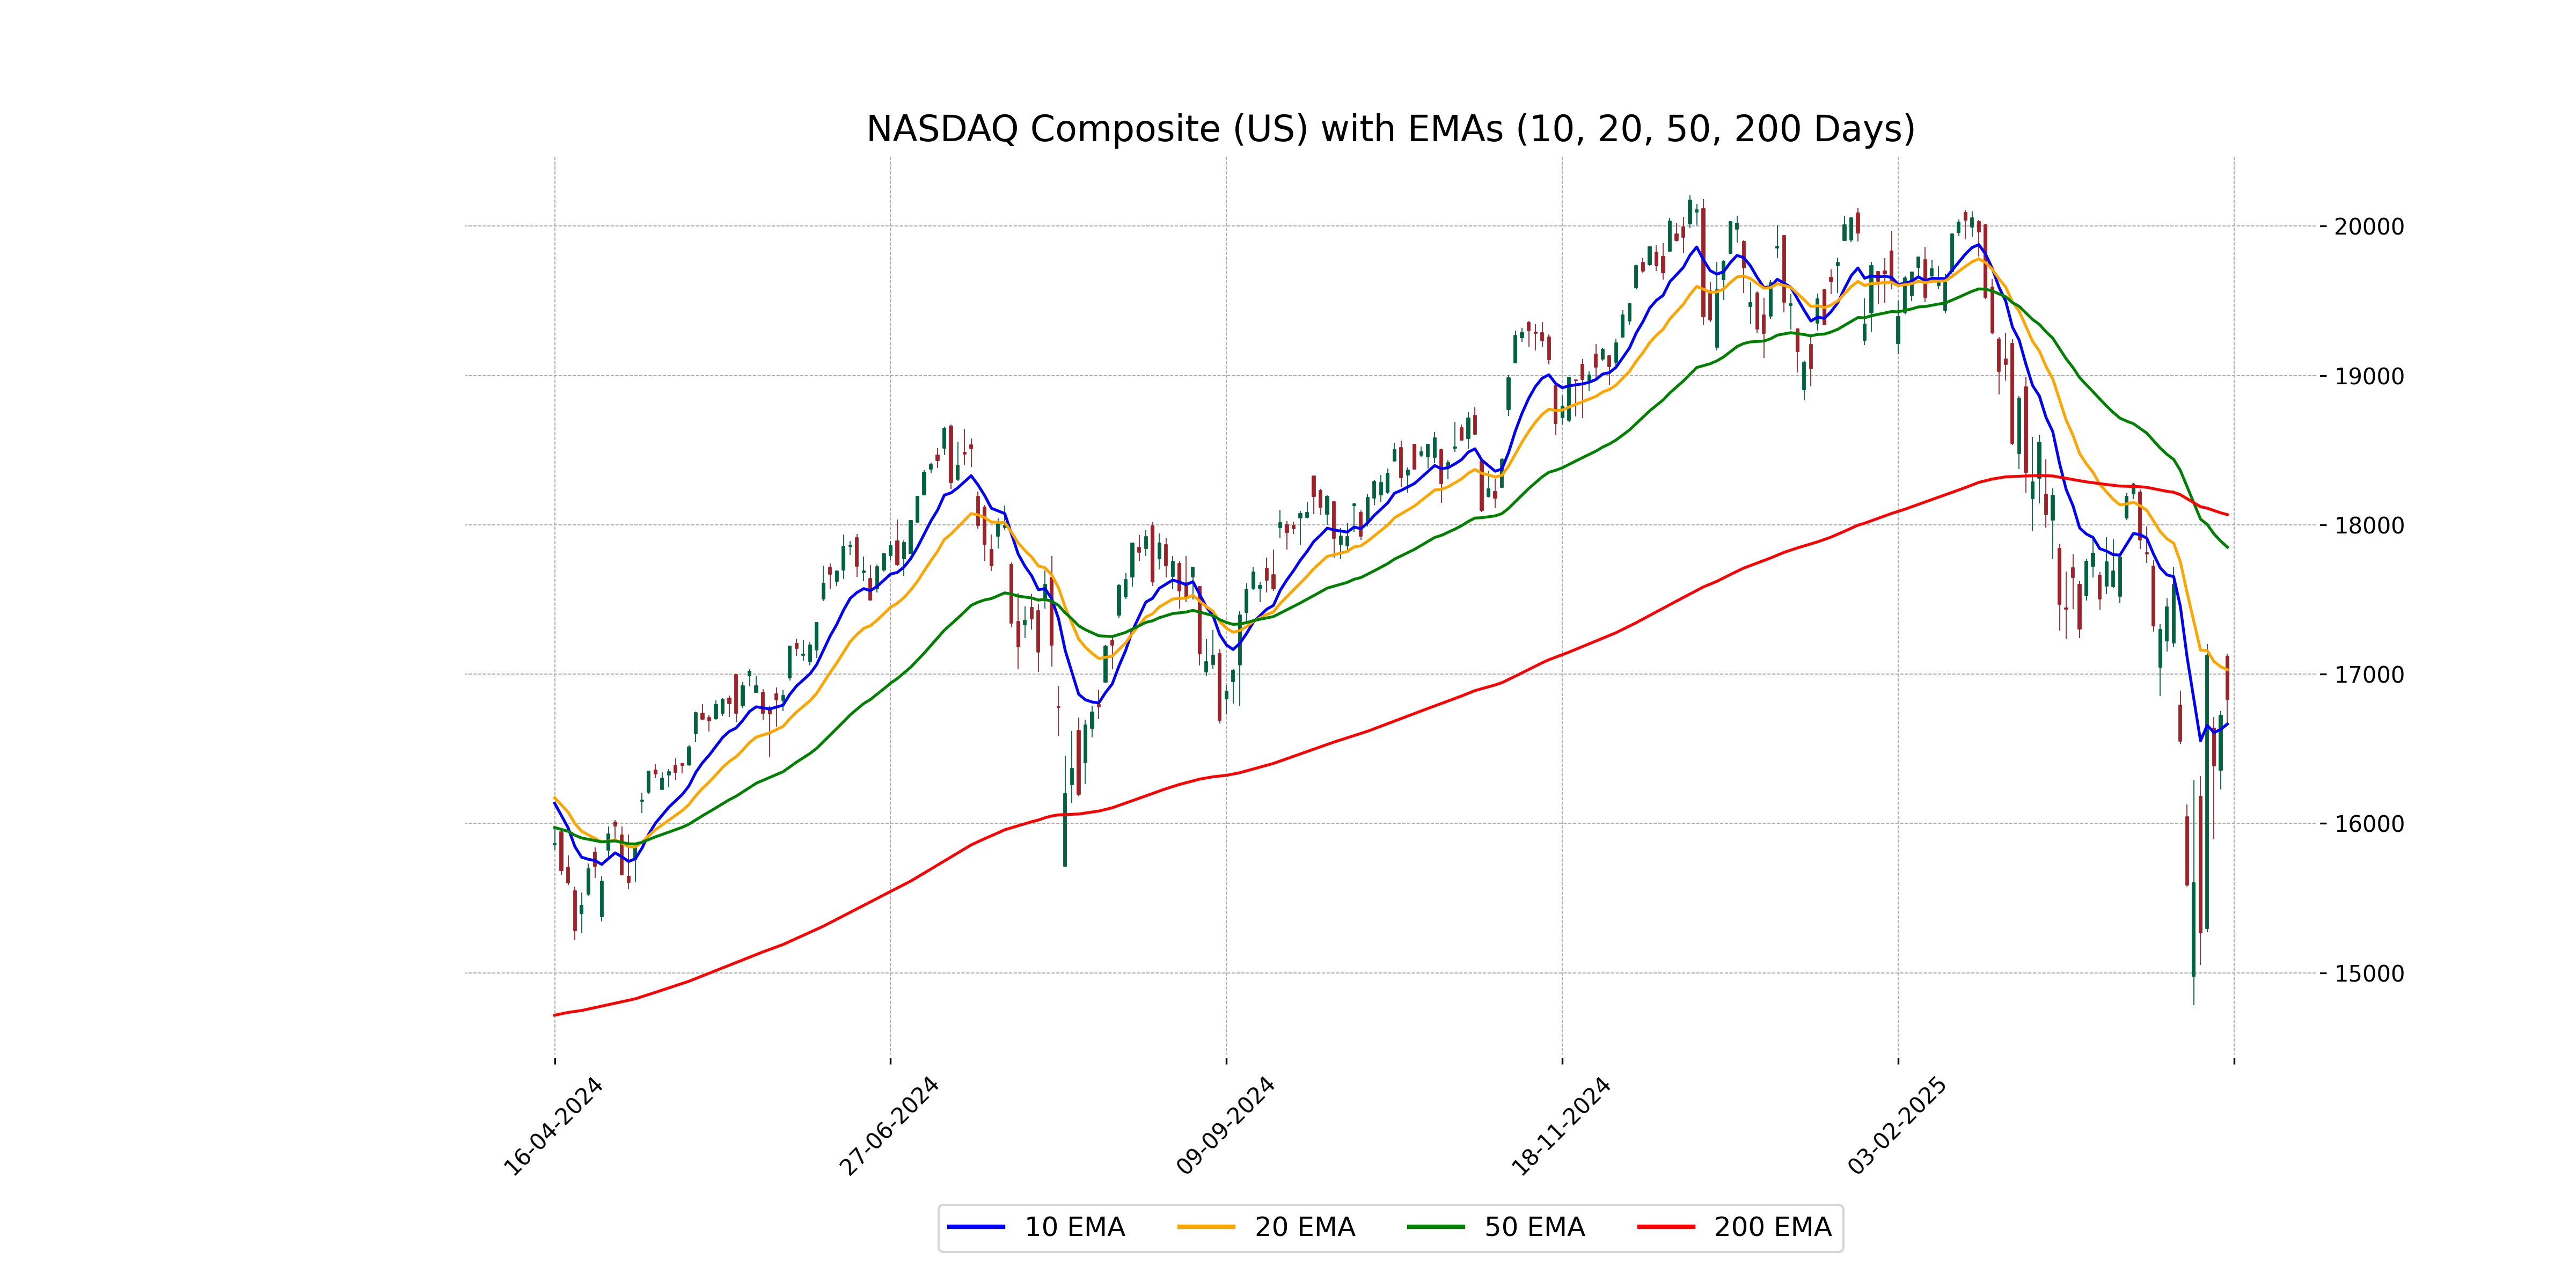
Relationship with Key Moving Averages
The NASDAQ Composite closed at 16831.48, which is below both its 50-day EMA of 17849.42 and 200-day EMA of 18067.59, indicating a potential bearish trend. However, it remains slightly above the 10-day EMA of 16665.99, suggesting a short-term upward movement.
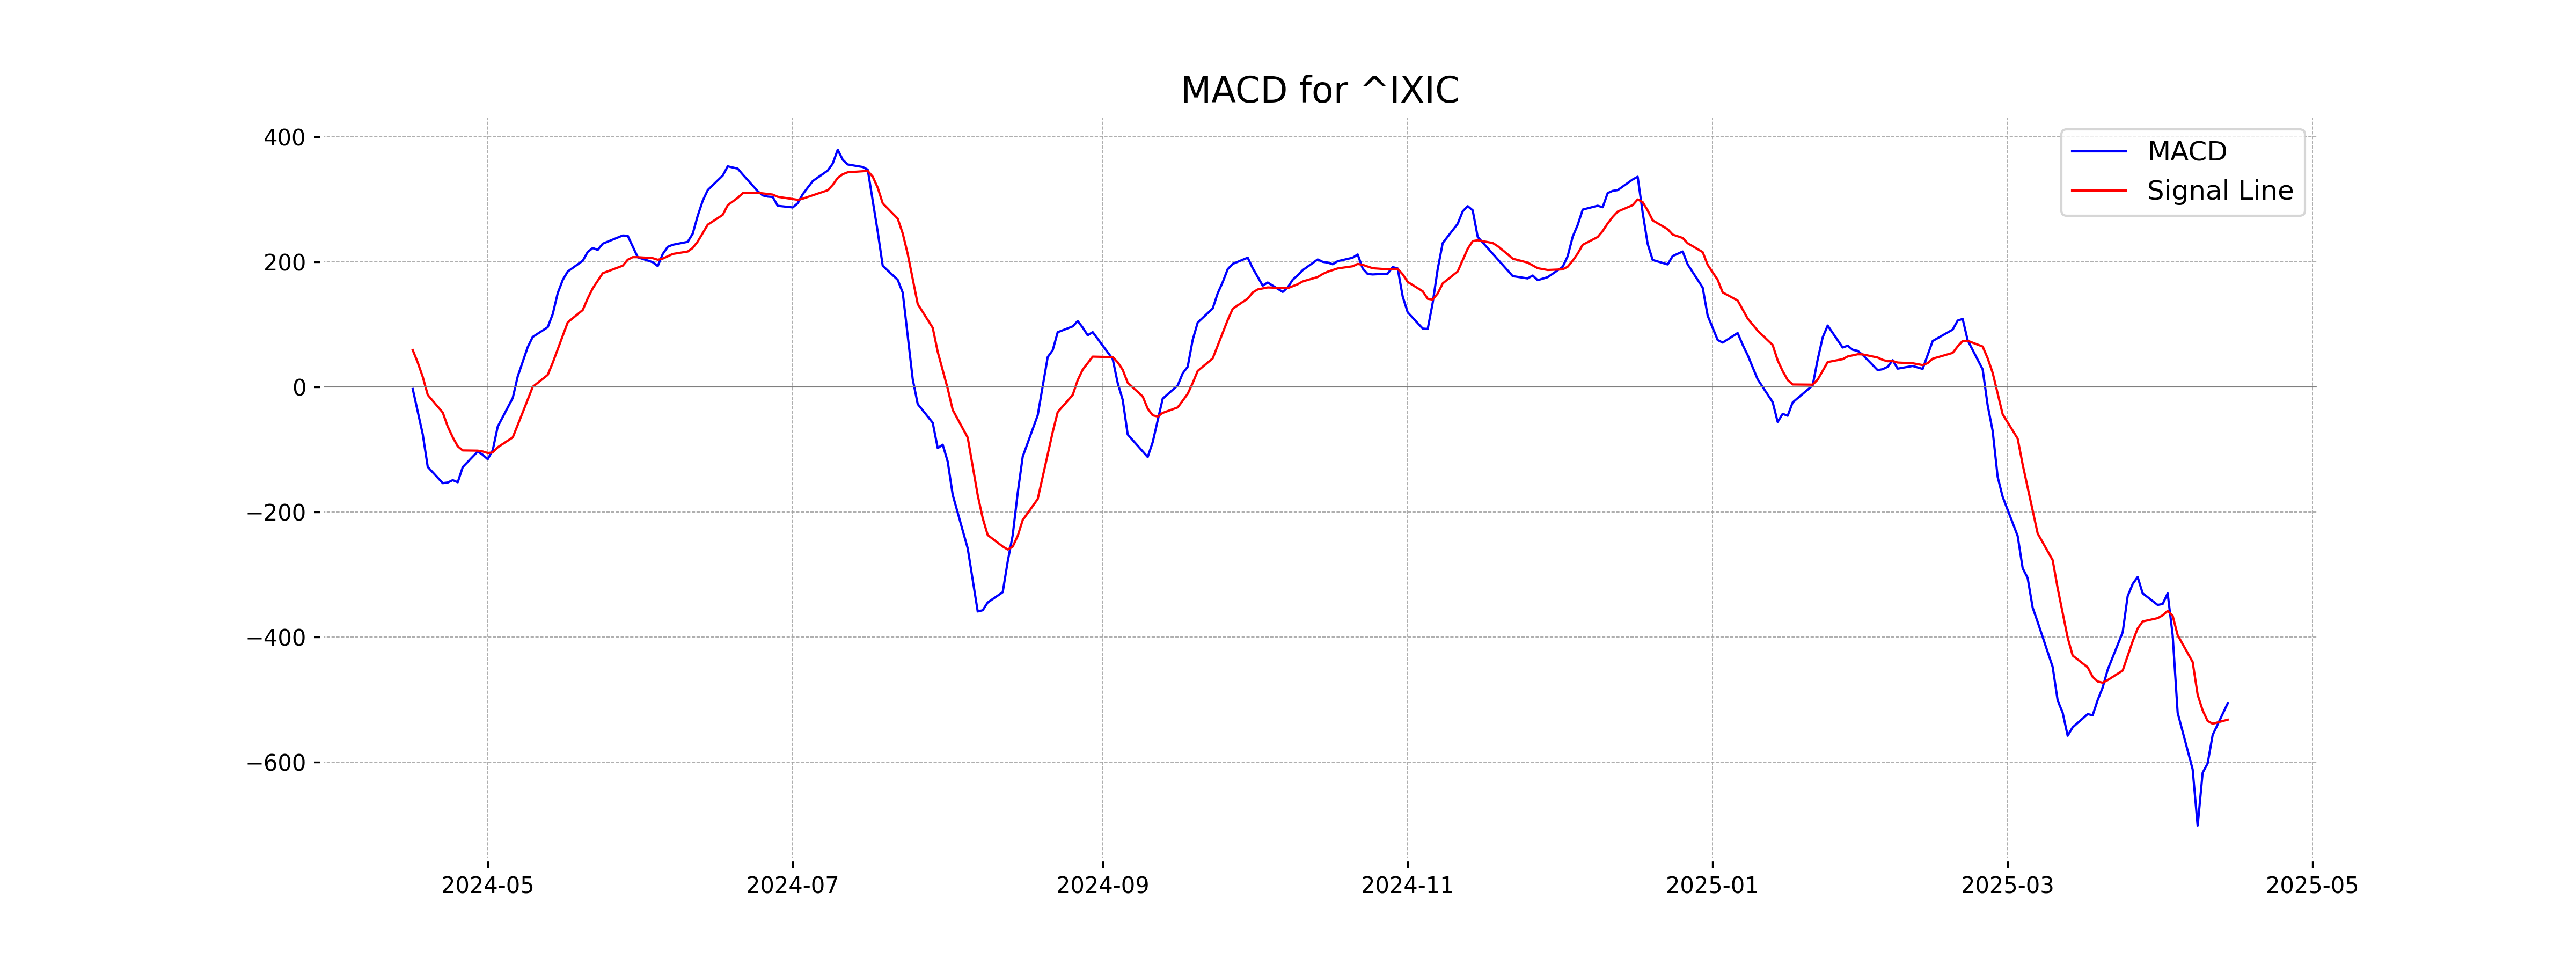
Moving Averages Trend (MACD)
The NASDAQ Composite (US) shows a MACD of -505.80, which is below the MACD Signal of -531.85. This indicates a potentially weak or bearish trend, as the MACD line is approaching the signal line from below.
RSI Analysis
Relative Strength Index (RSI) Analysis for NASDAQ Composite: The RSI value for NASDAQ Composite is 45.88, which suggests that the index is currently in a neutral territory. An RSI below 30 typically indicates oversold conditions, while an RSI above 70 suggests overbought conditions.
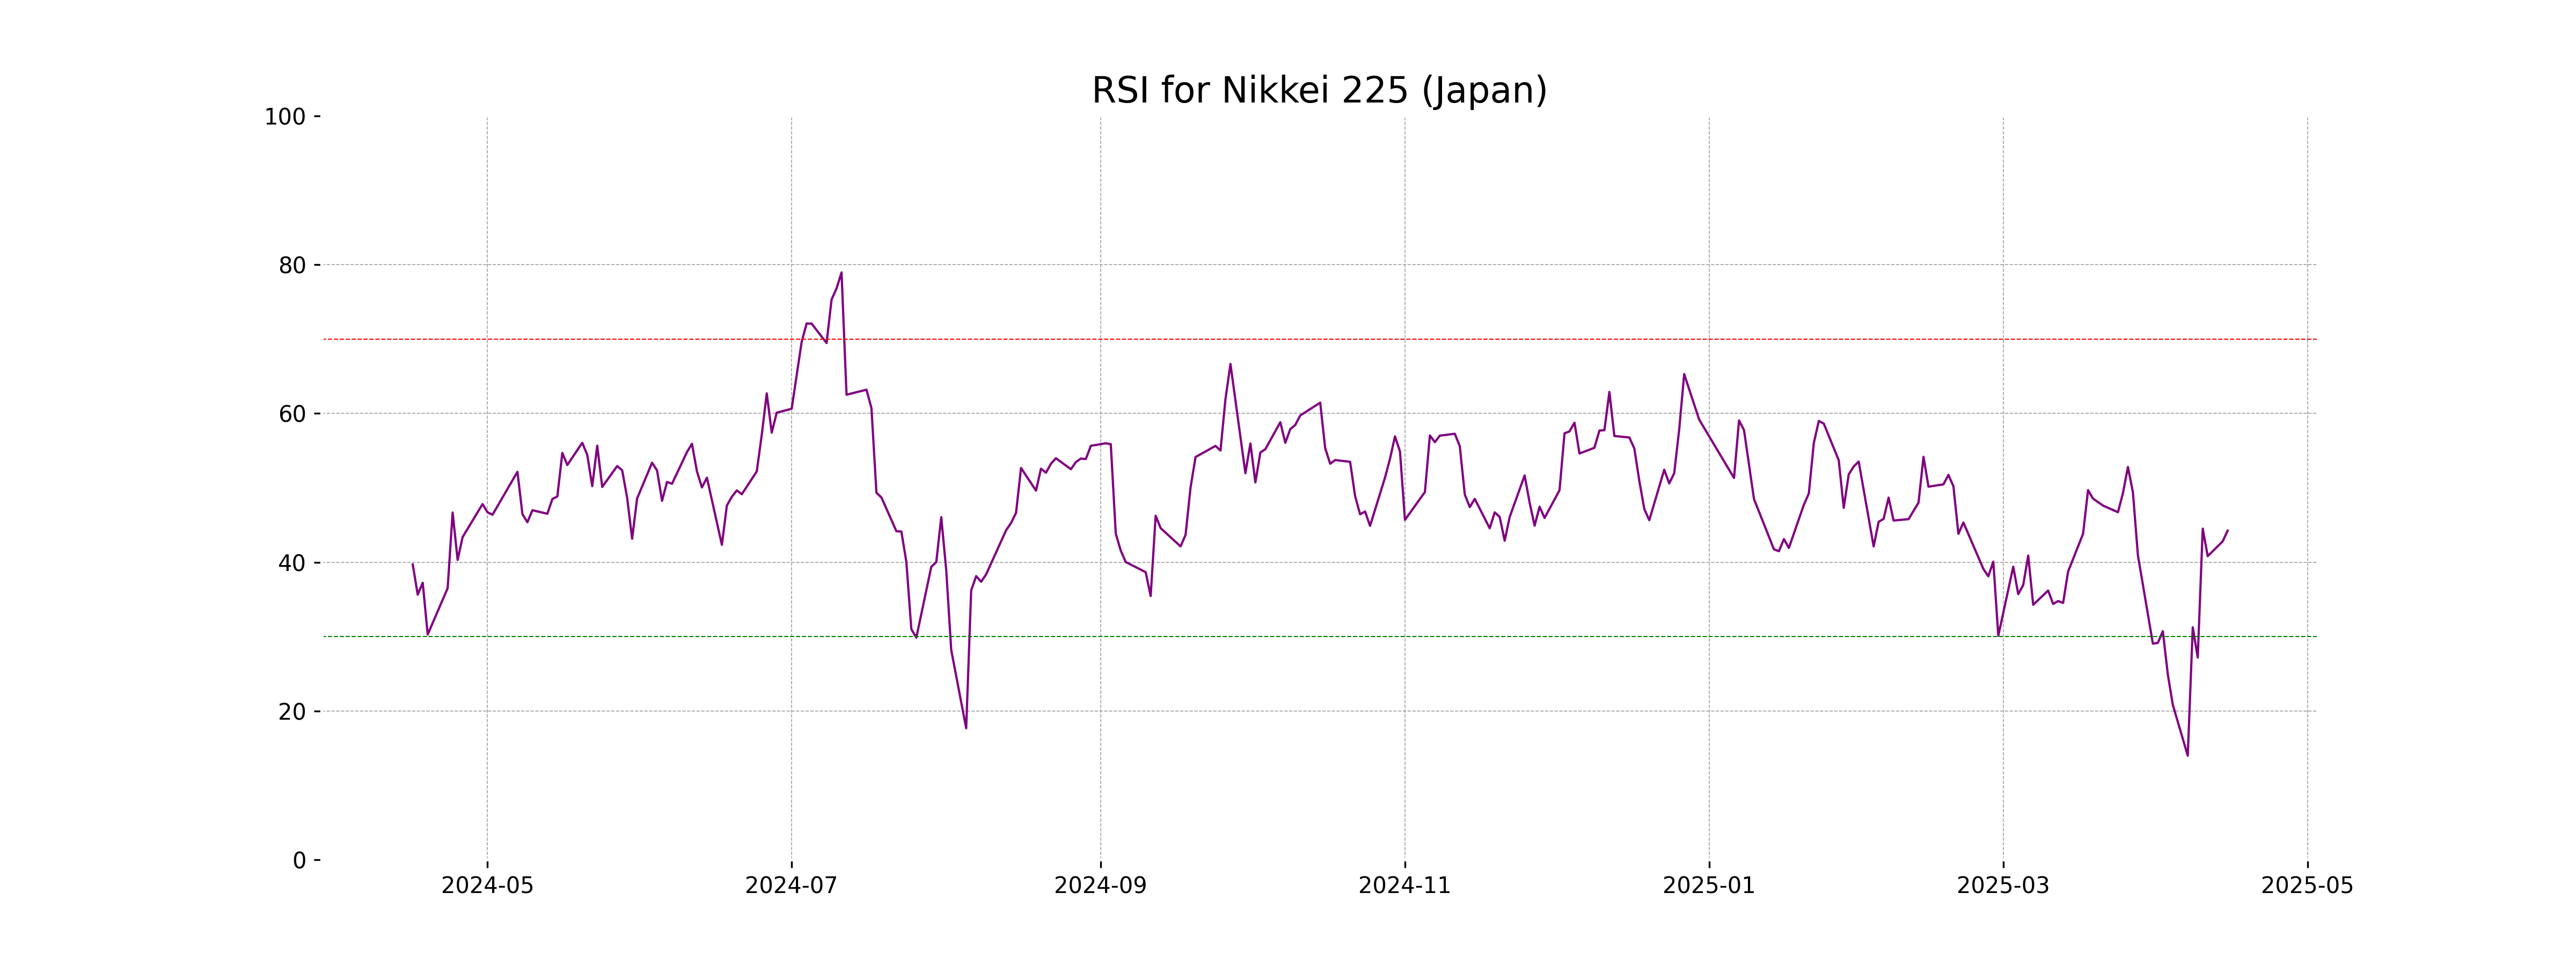
Analysis for Nikkei 225 (Japan) - April 15, 2025
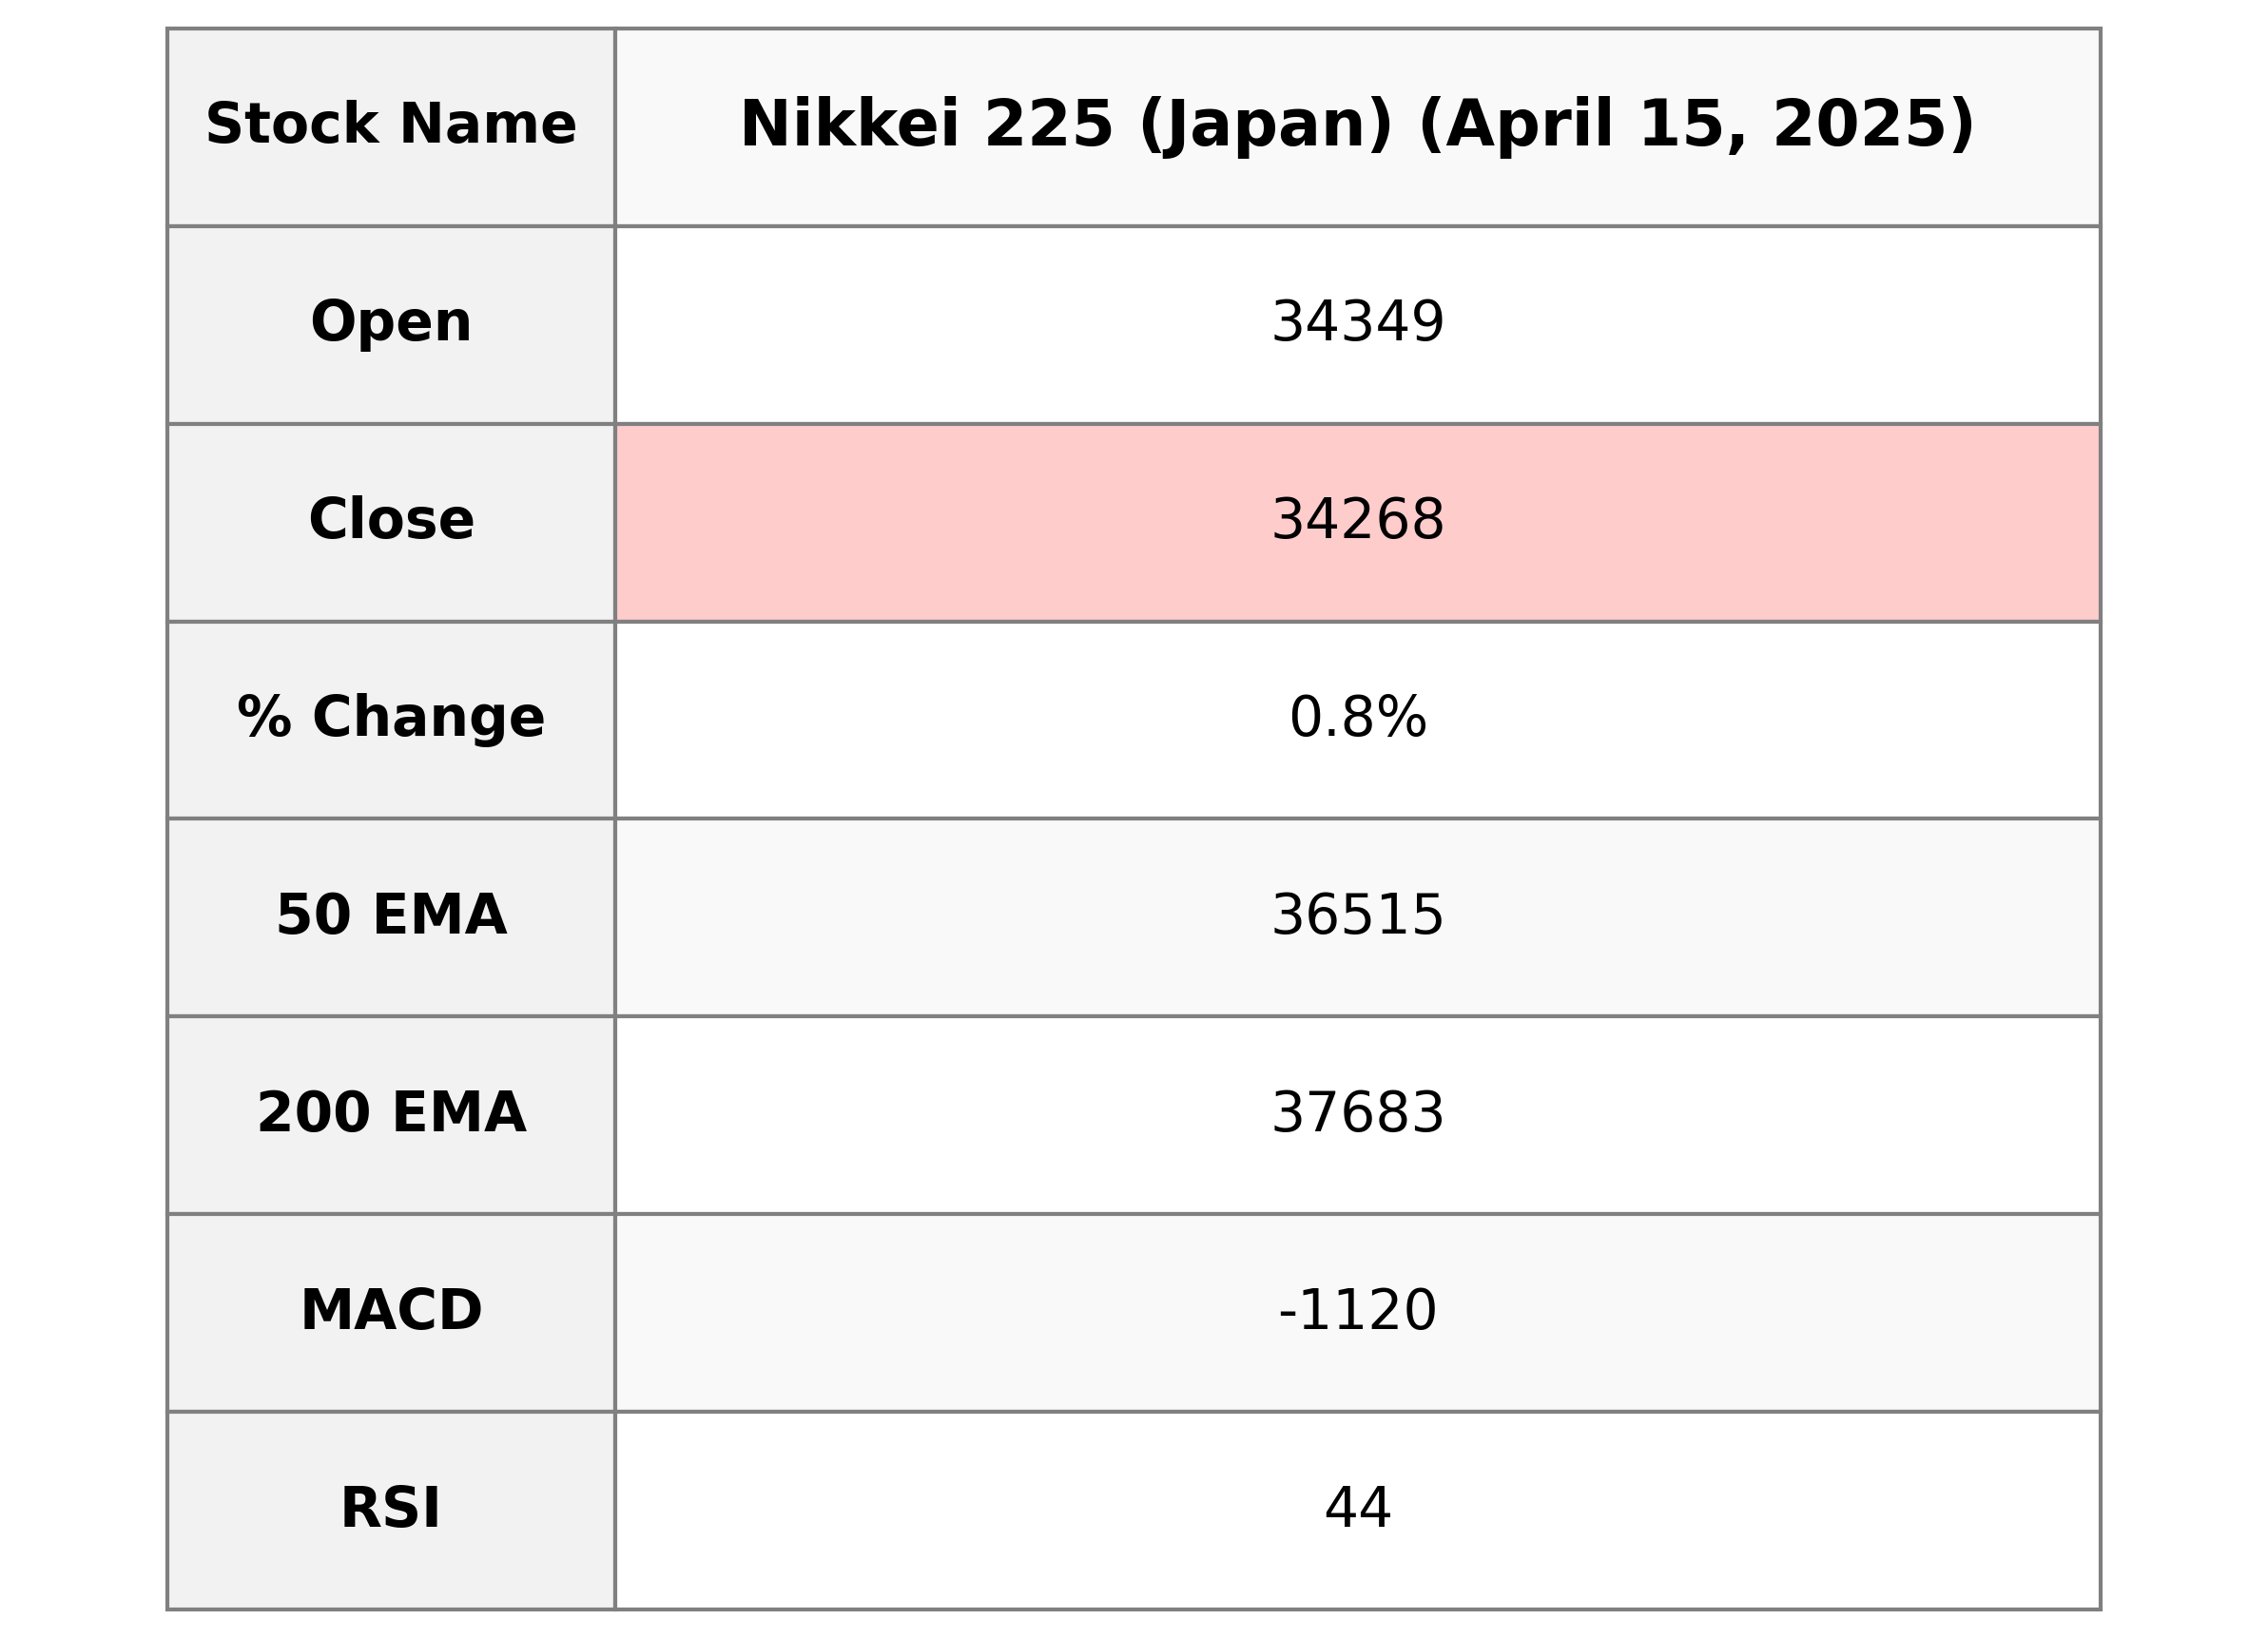
The Nikkei 225 opened at 34,349.01, closed slightly lower at 34,267.54, marking a 0.84% increase from the previous close of 33,982.36, reflecting a positive change of 285.18 points. Despite the upward movement, the 50 and 200-day EMAs suggest a short-term downtrend as they remain above the current closing value. The RSI of 44.25 indicates that the market is neither overbought nor oversold, and the negative MACD highlights a bearish momentum.
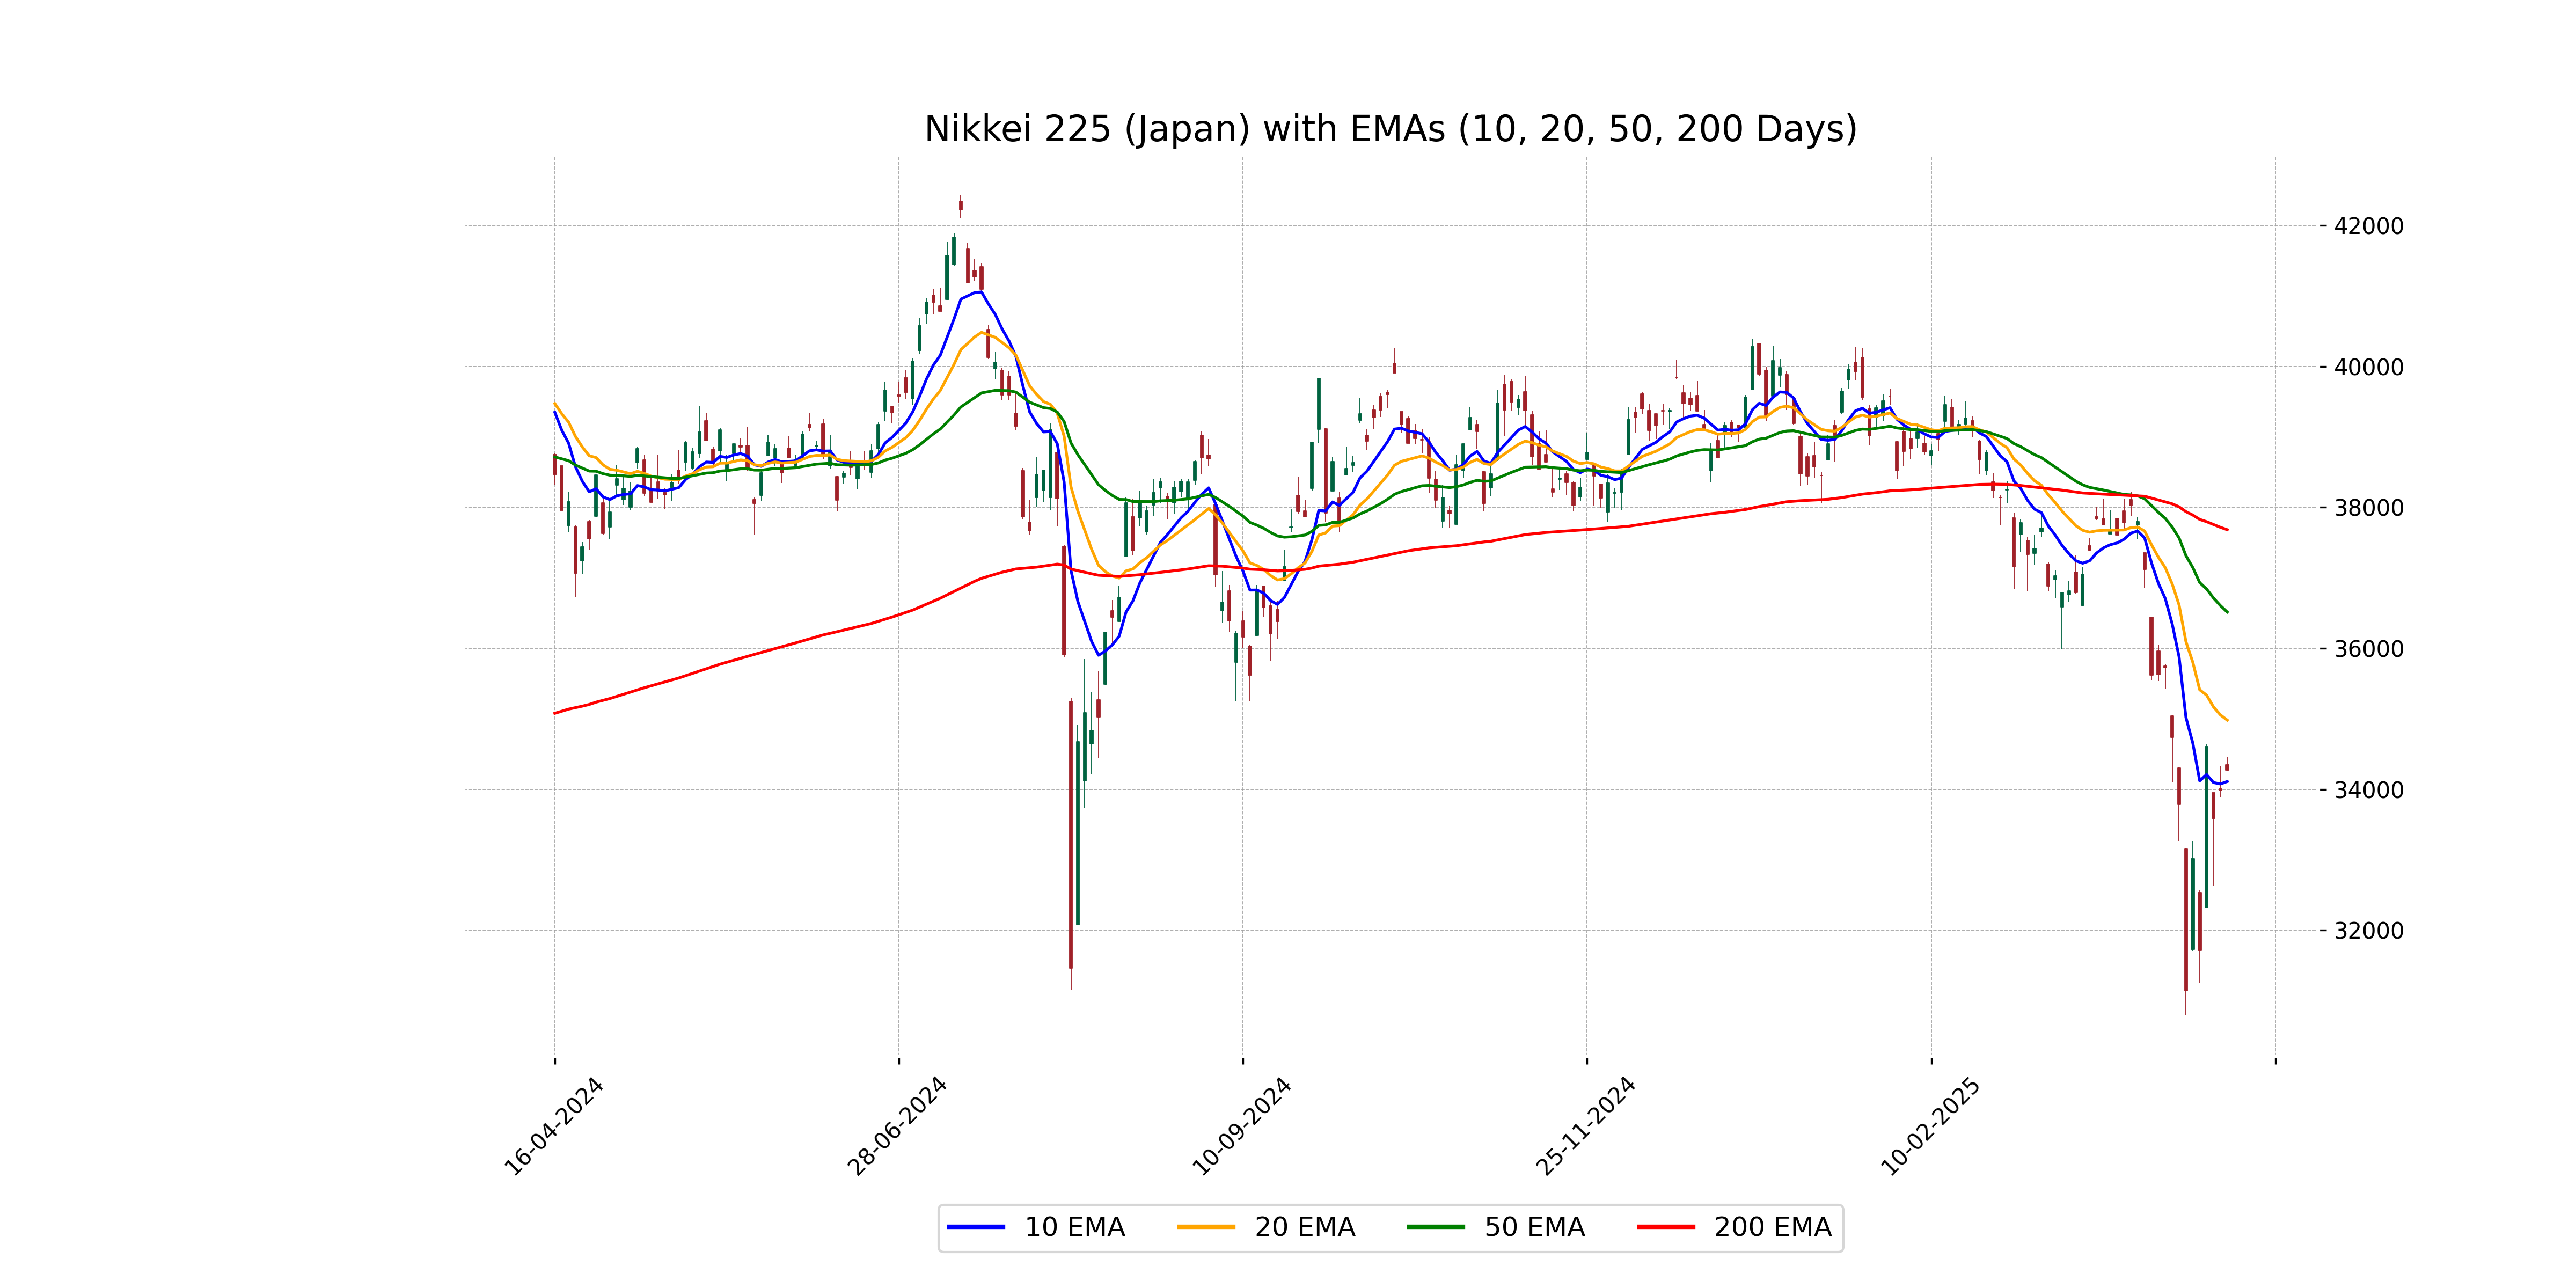
Relationship with Key Moving Averages
Nikkei 225 is currently trading below its key moving averages, with the closing price of 34,267.54 being below the 50-day EMA of 36,515.37 and the 200-day EMA of 37,683.49. It is, however, slightly above the 10-day EMA of 34,109.55, indicating a recent upward movement but still indicating a bearish overall trend.
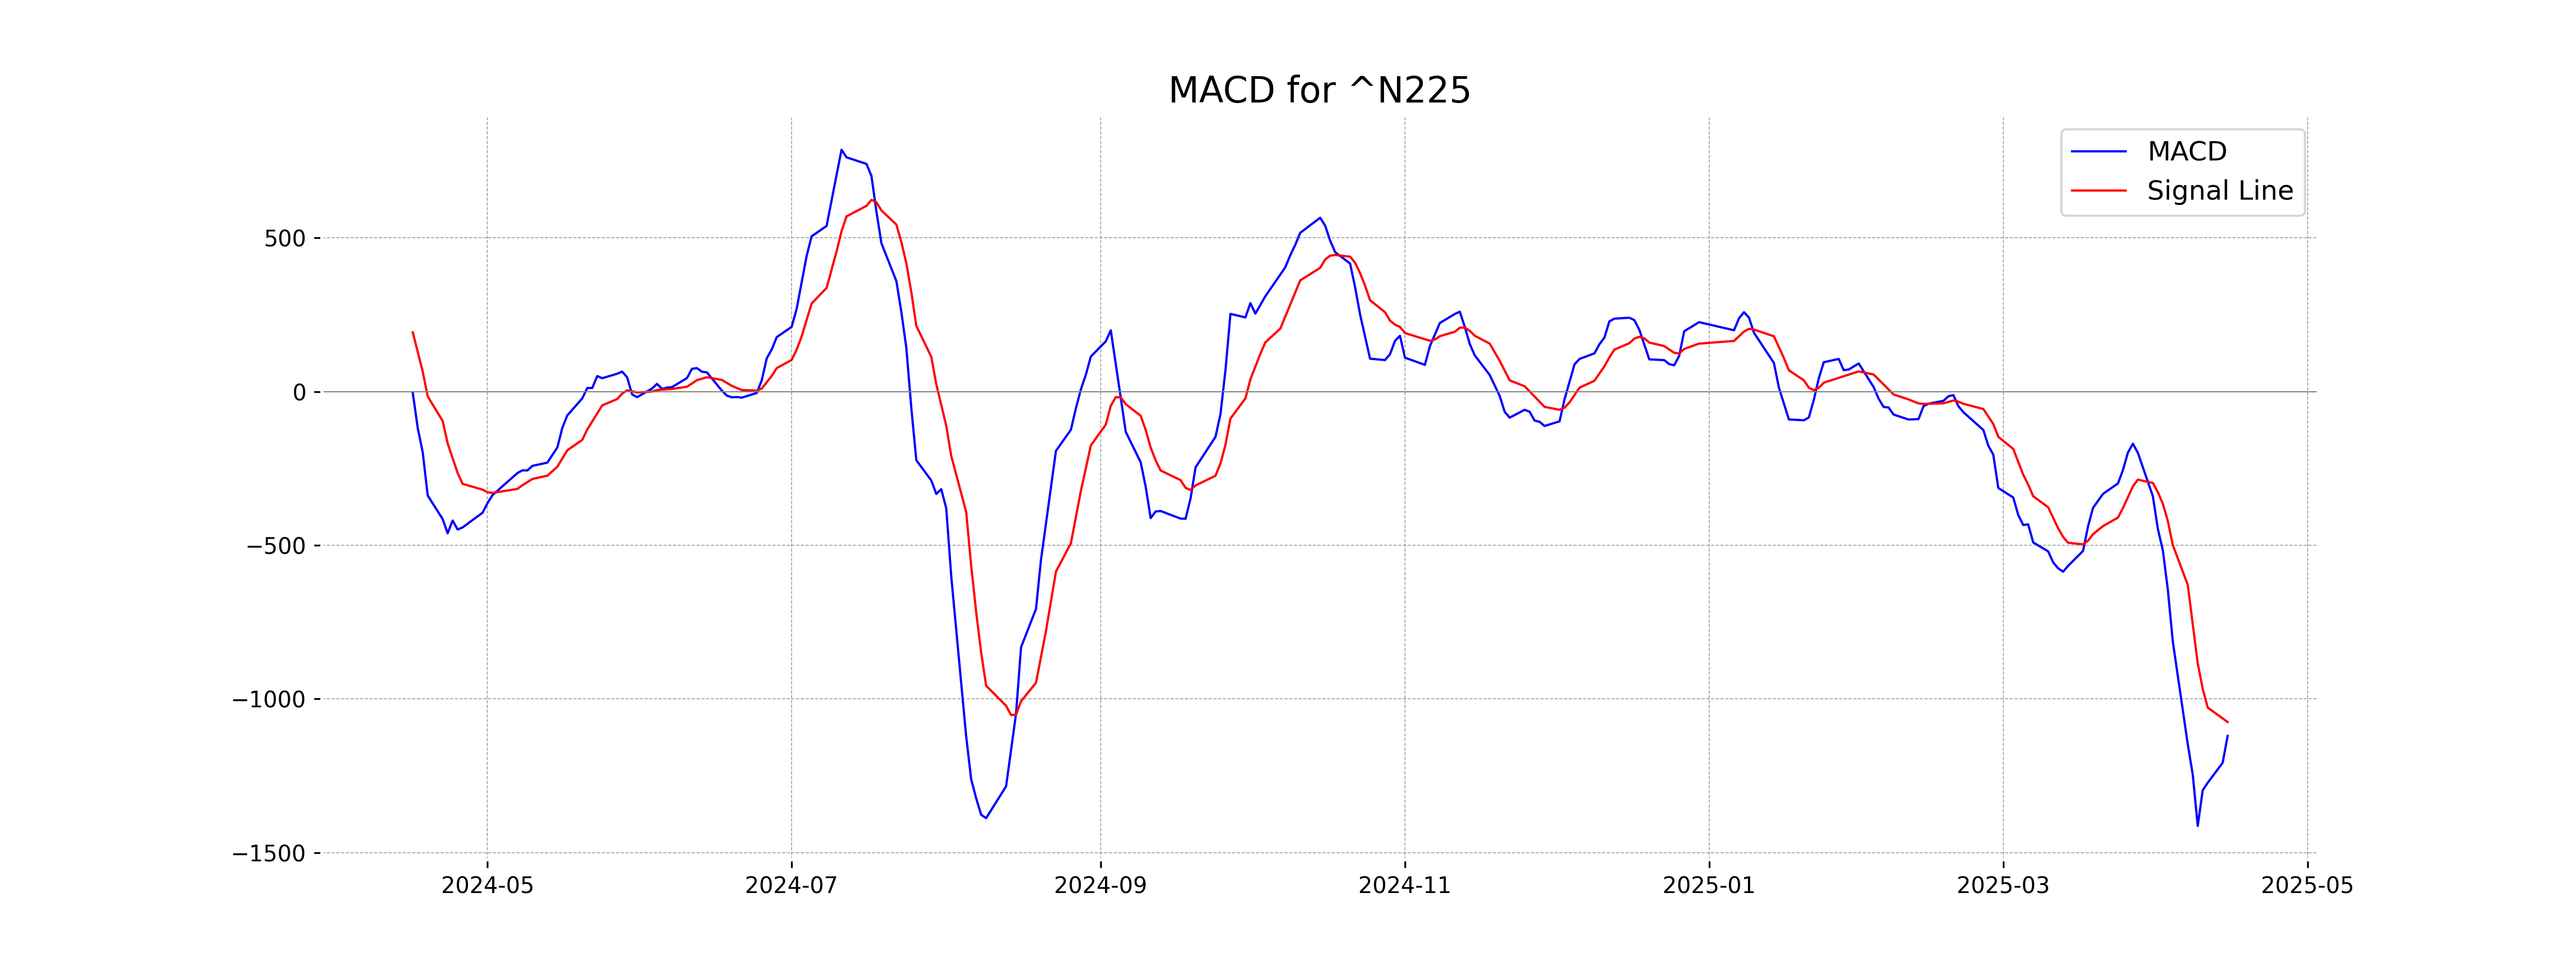
Moving Averages Trend (MACD)
The MACD for Nikkei 225 is -1120.22, with a signal line of -1075.38, indicating a bearish trend as the MACD line is below the signal line. This suggests that the momentum is currently negative, and the index might continue facing selling pressure.
RSI Analysis
RSI Analysis for Nikkei 225: The RSI is currently at 44.25, indicating a neutral position since it is below 50 but above 30. This suggests that the index is neither in an overbought nor oversold condition, and recent market movements may not signal extreme price changes.
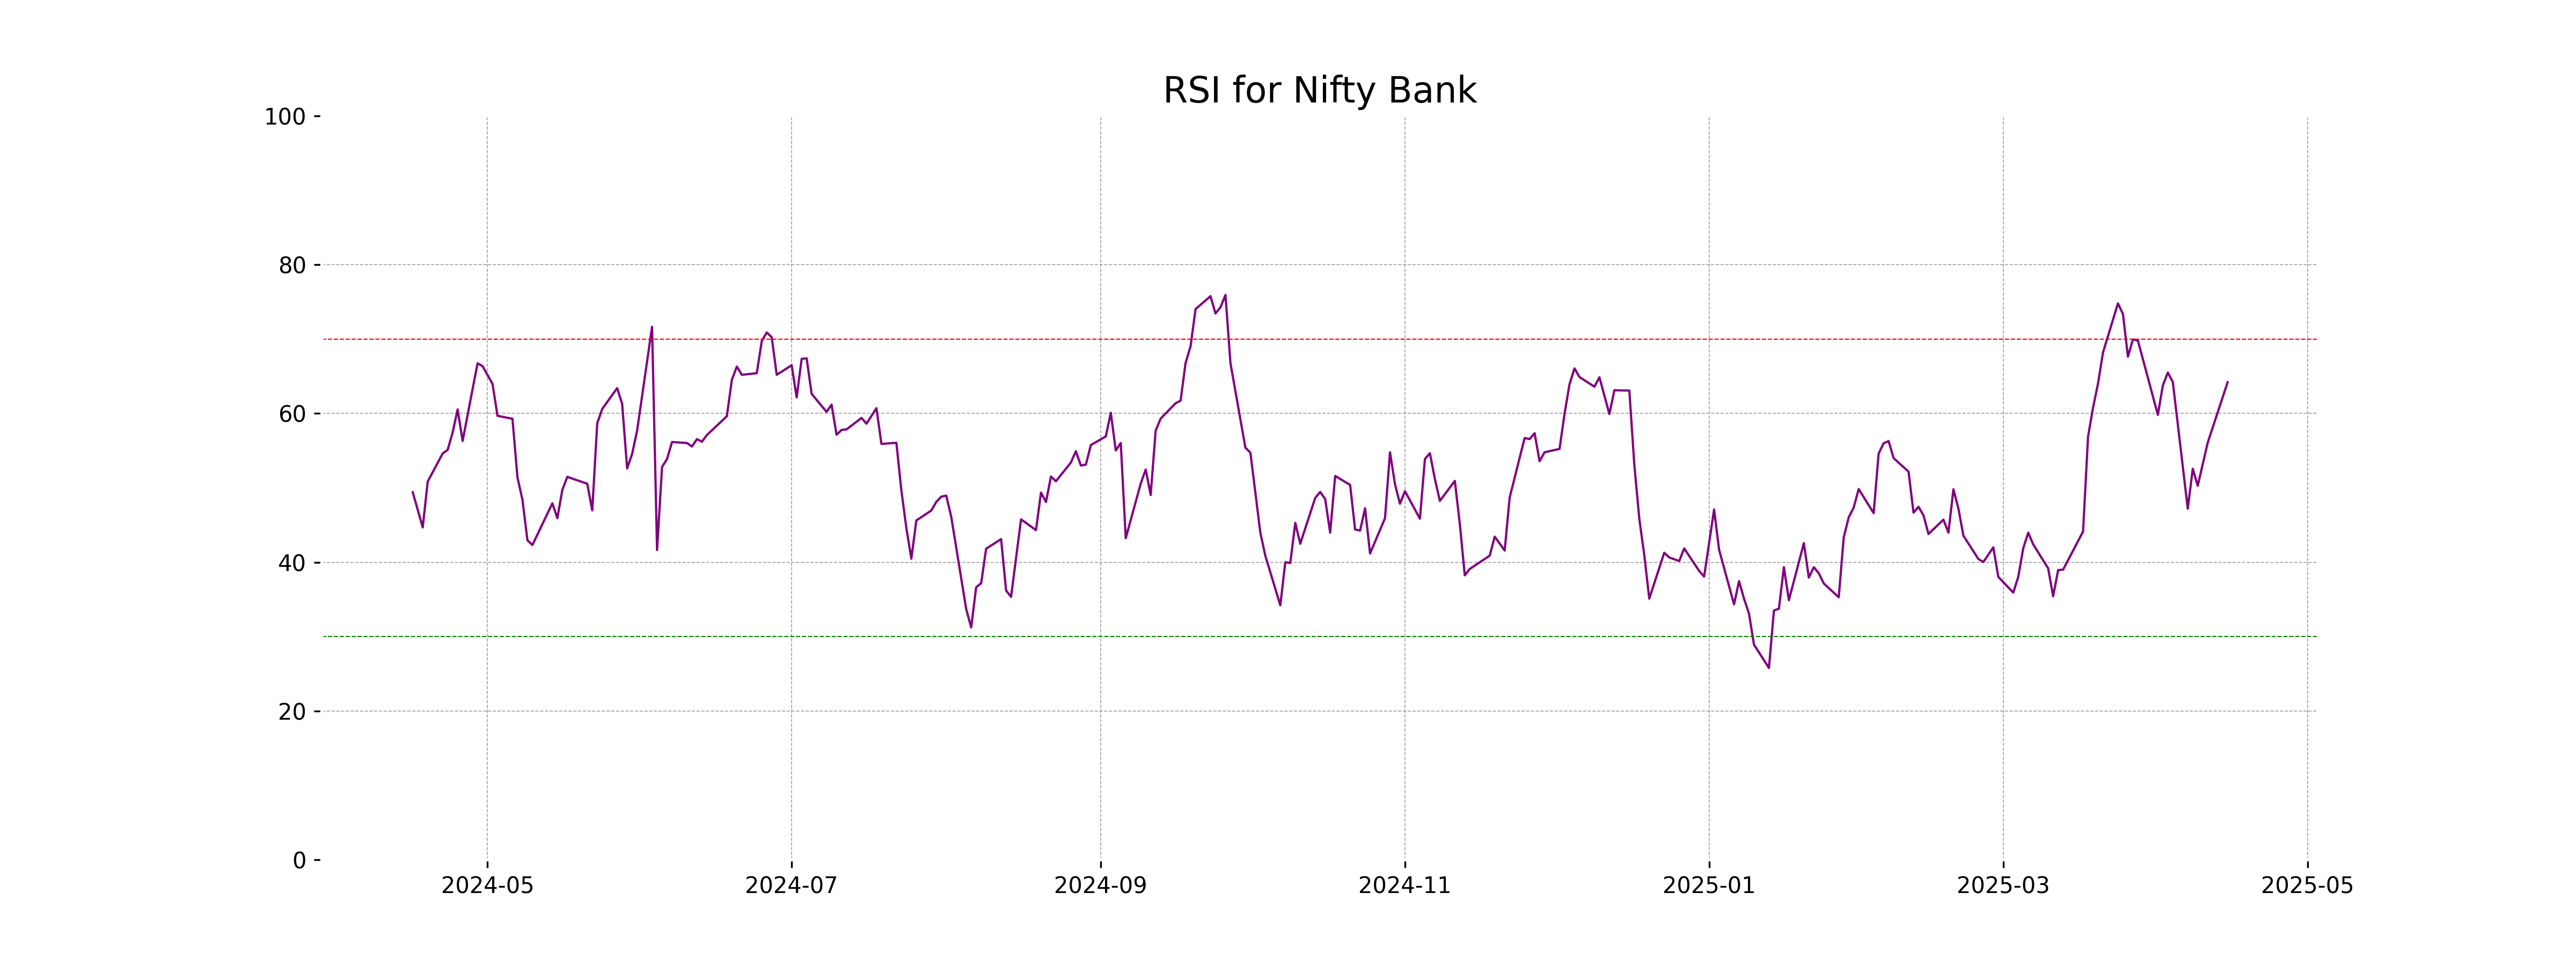
Analysis for Nifty Bank - April 15, 2025
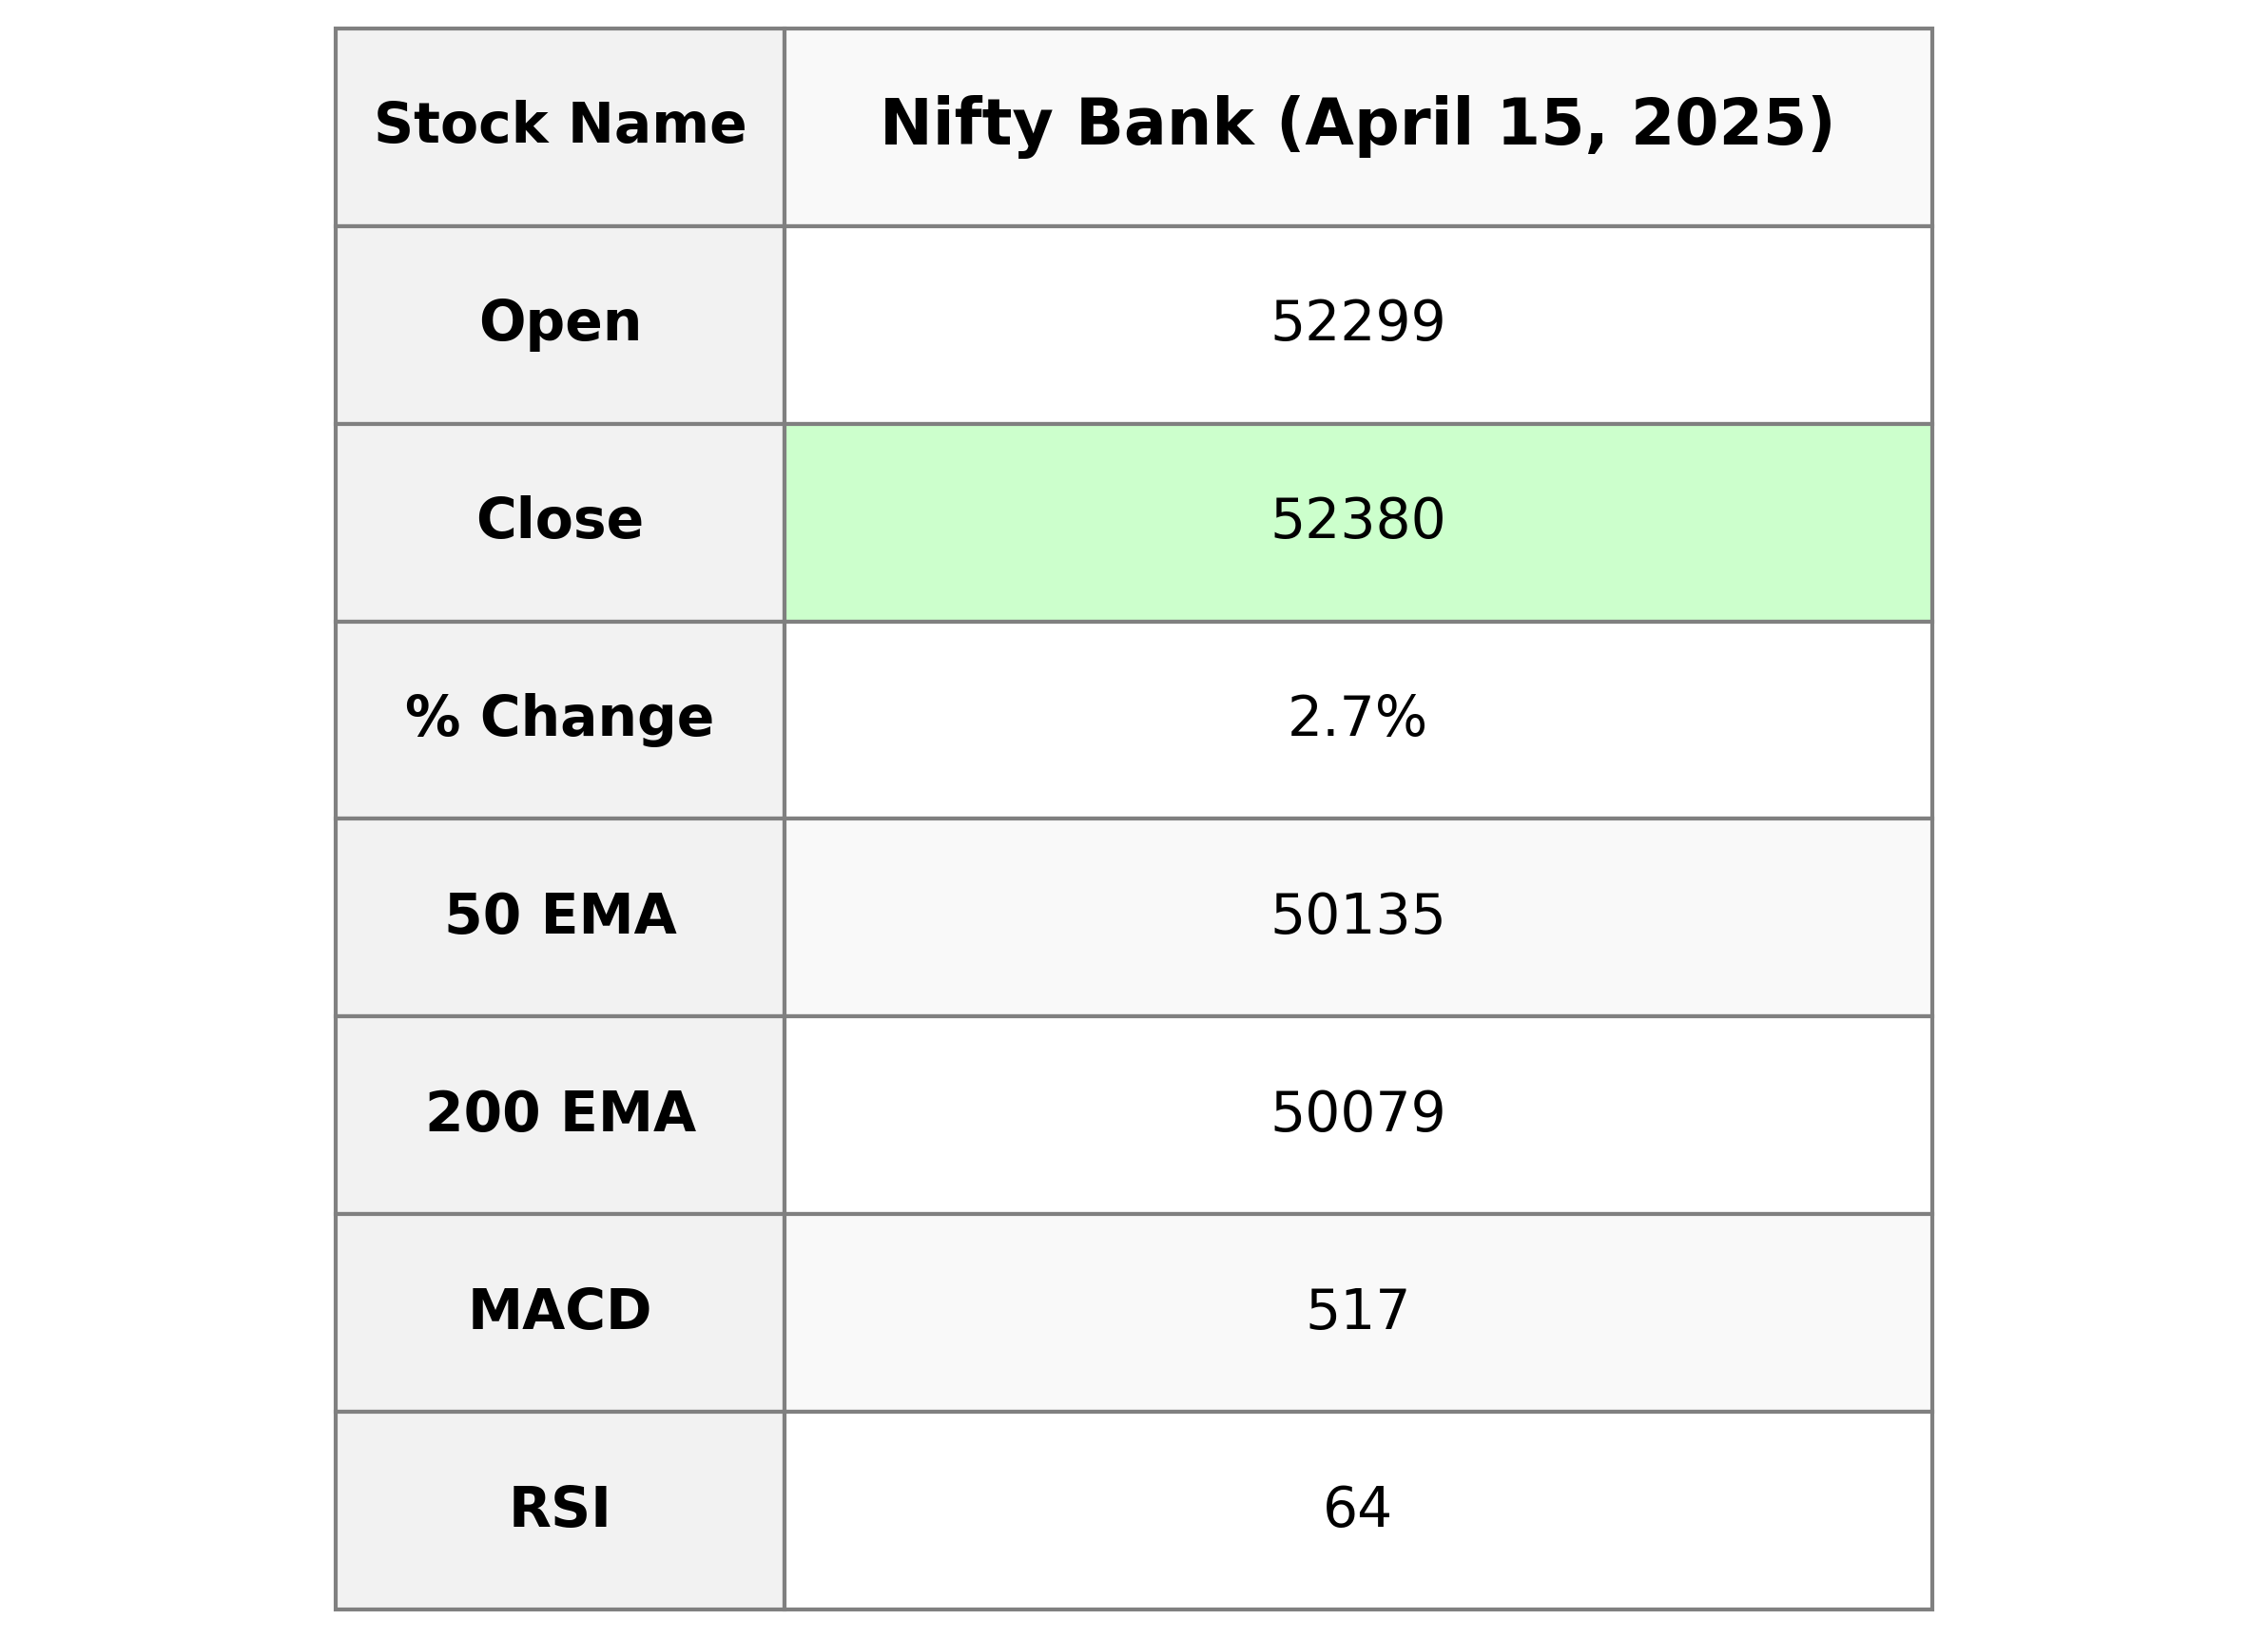
Nifty Bank opened at 52,299 with a high of 52,486.35 and closed at 52,379.5, marking a 2.70% rise from the previous close. The index showed a points change of 1,377.15 with RSI at 64.20, indicating a positive momentum. Key moving averages, such as 50 EMA at 50,134.93 and 200 EMA at 50,078.78, suggest a strong upward trend.
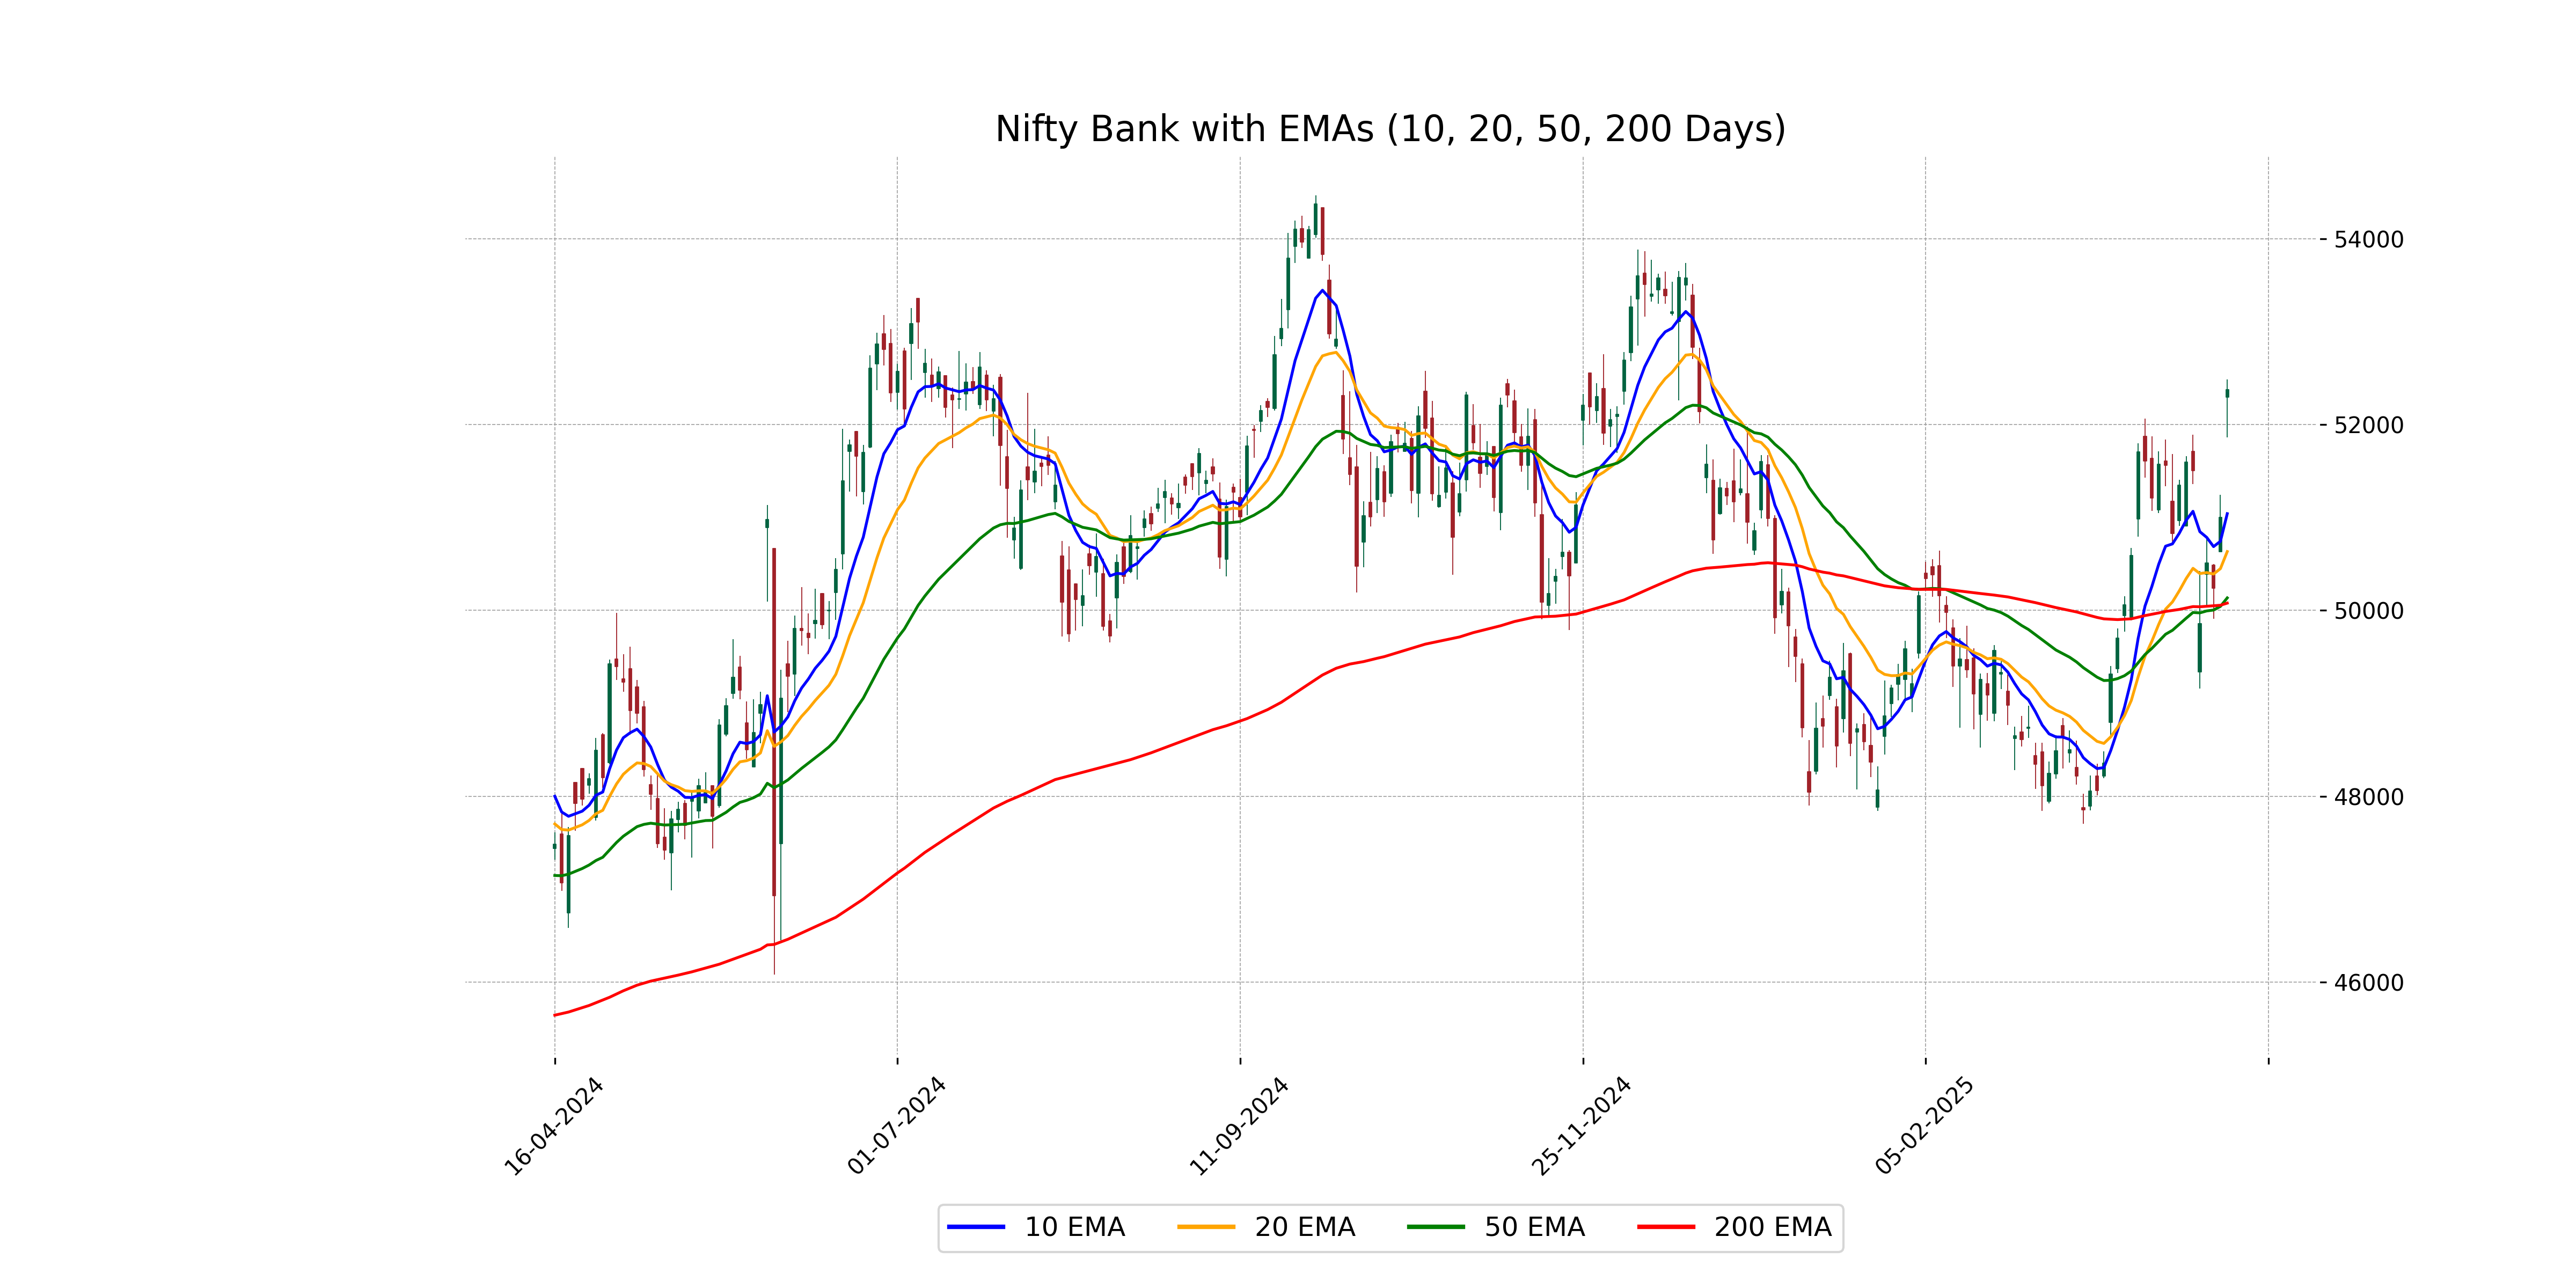
Relationship with Key Moving Averages
The closing price of Nifty Bank is 52,379.5, which is above the 50-day EMA of 50,134.93, the 200-day EMA of 50,078.78, the 10-day EMA of 51,041.79, and the 20-day EMA of 50,633.71. This indicates a strong bullish trend, as the stock is trading significantly above its key moving averages. The RSI of 64.20 also suggests positive momentum.
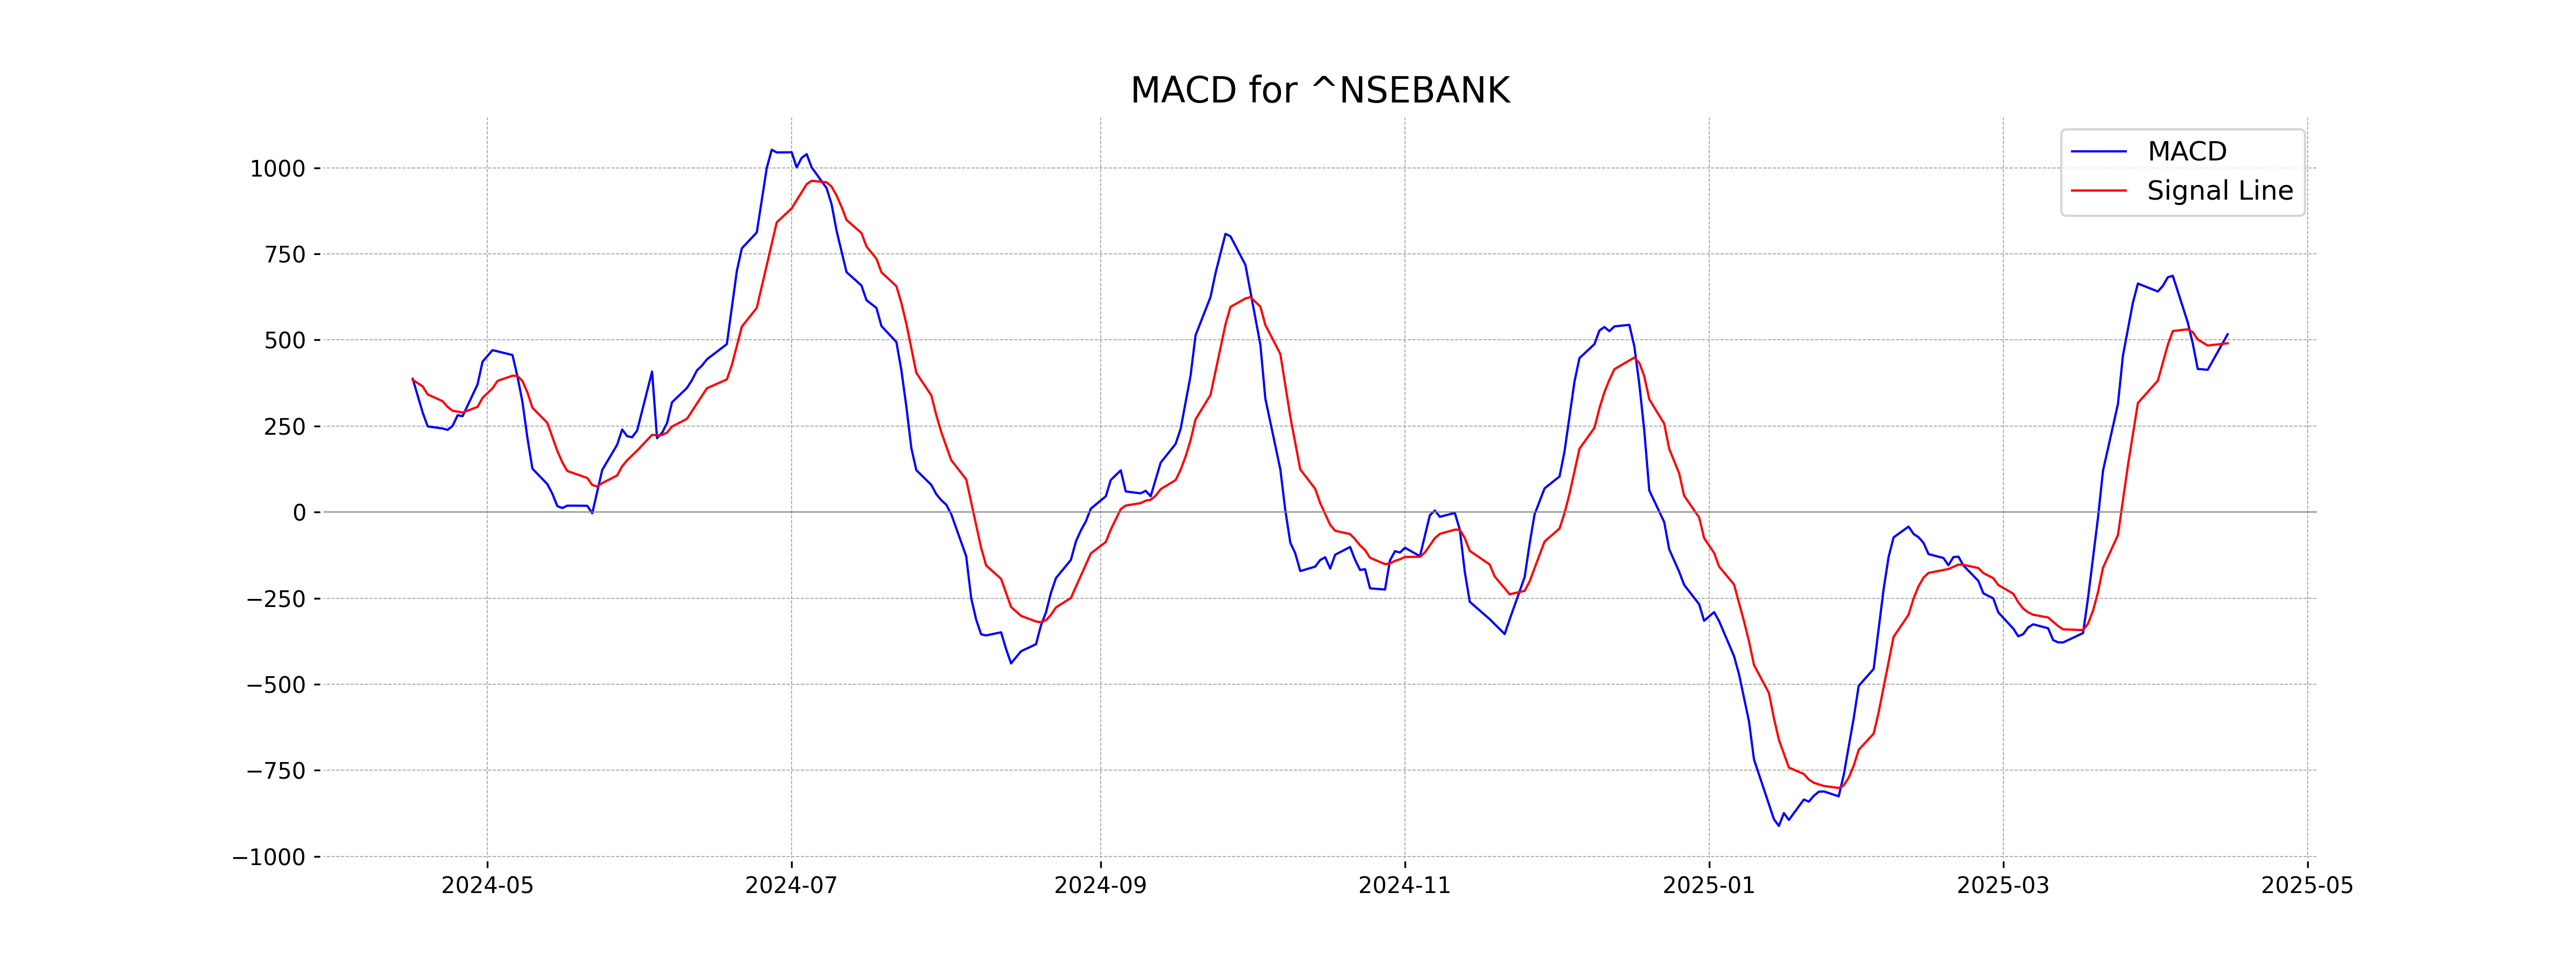
Moving Averages Trend (MACD)
Based on the given data for Nifty Bank, the MACD is 516.56, which is above the MACD Signal of 490.24. This typically indicates a bullish trend, suggesting that the stock might continue its upward movement if the trend persists.
RSI Analysis
The RSI value for Nifty Bank is 64.20, which indicates a moderately strong momentum. It is approaching the overbought level of 70, suggesting that there might be some profit-taking or a potential pullback if this trend continues.
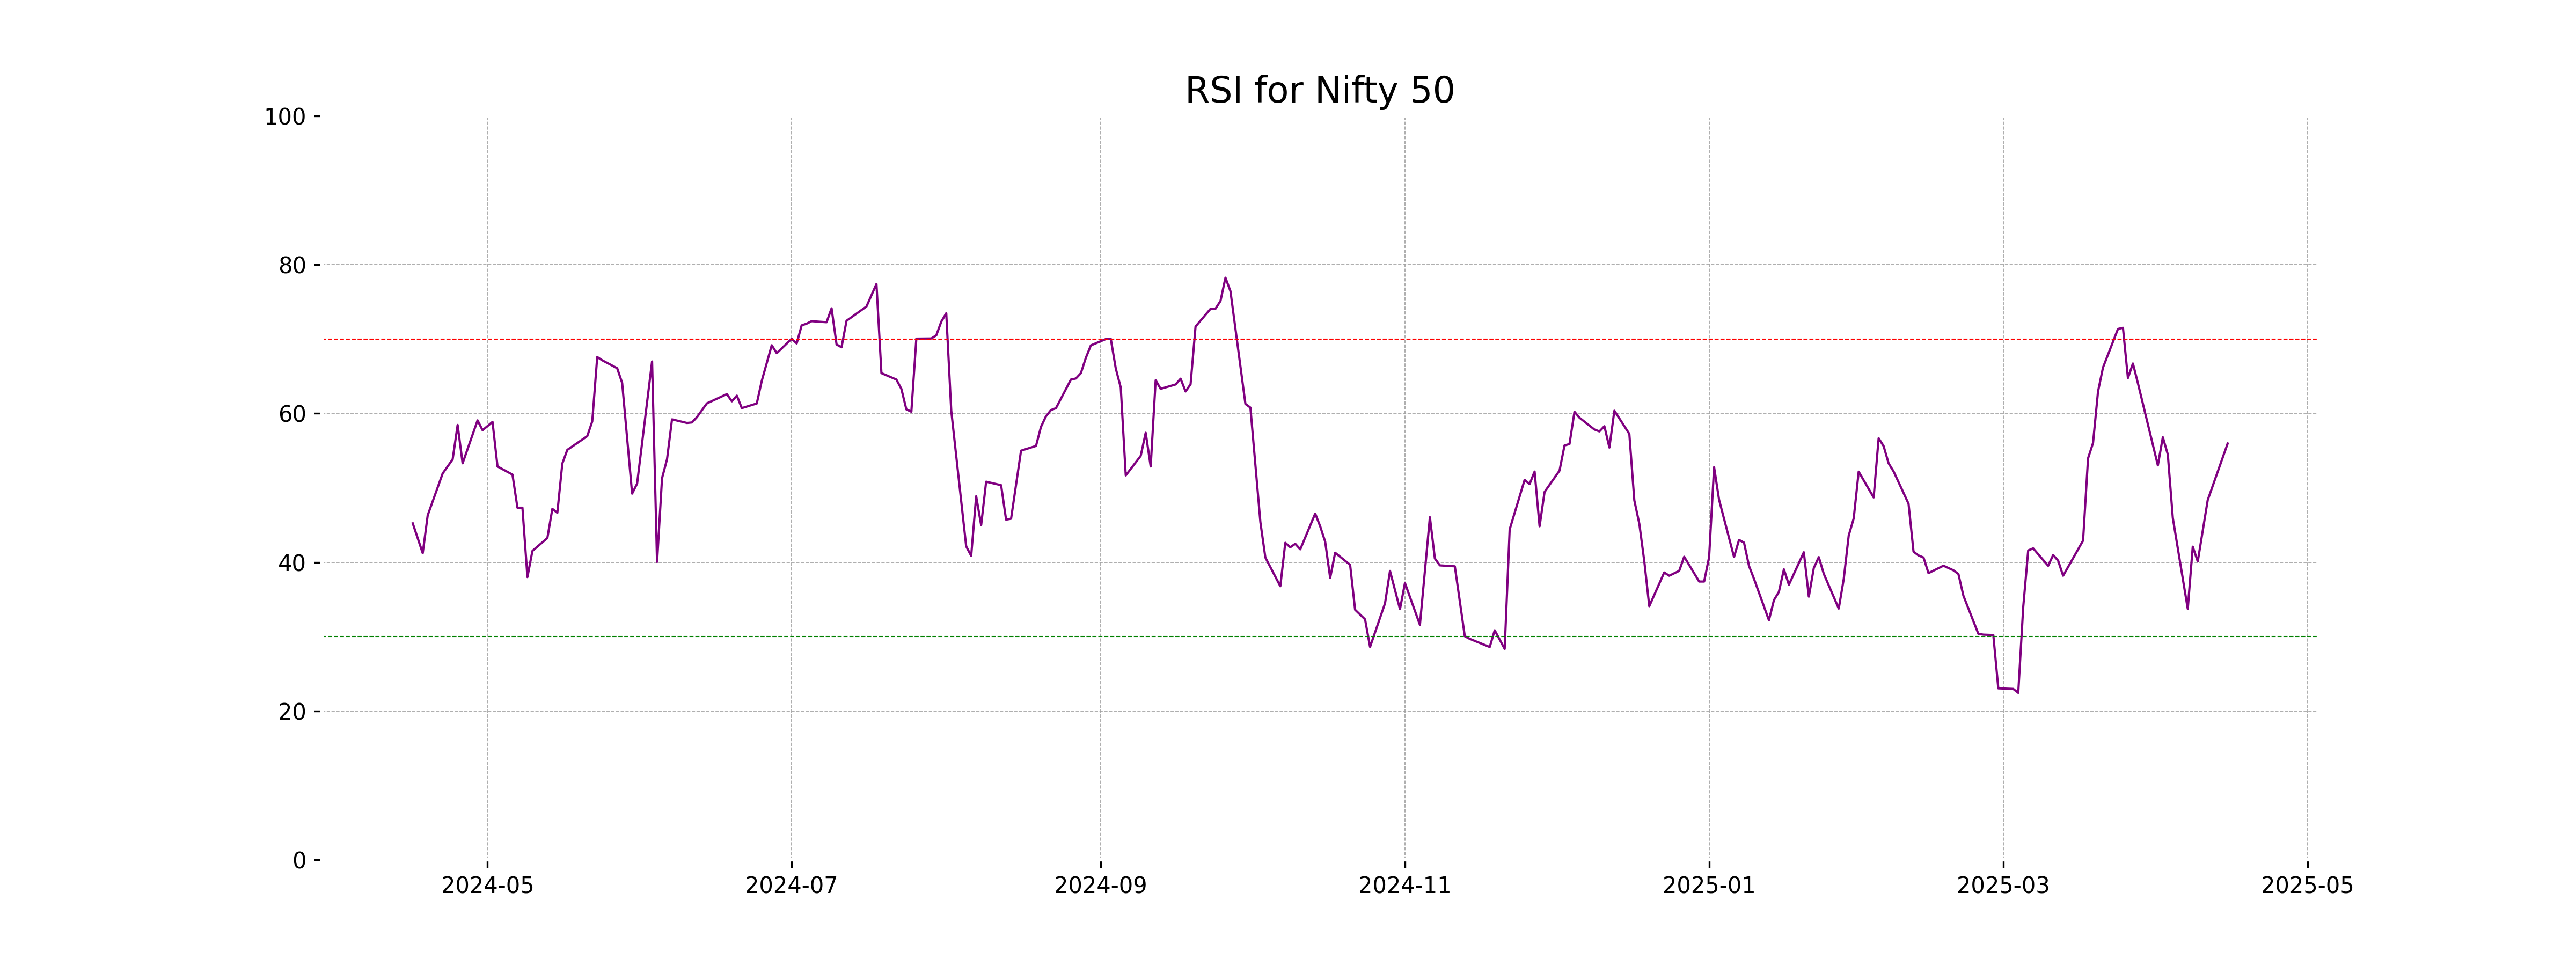
Analysis for Nifty 50 - April 15, 2025
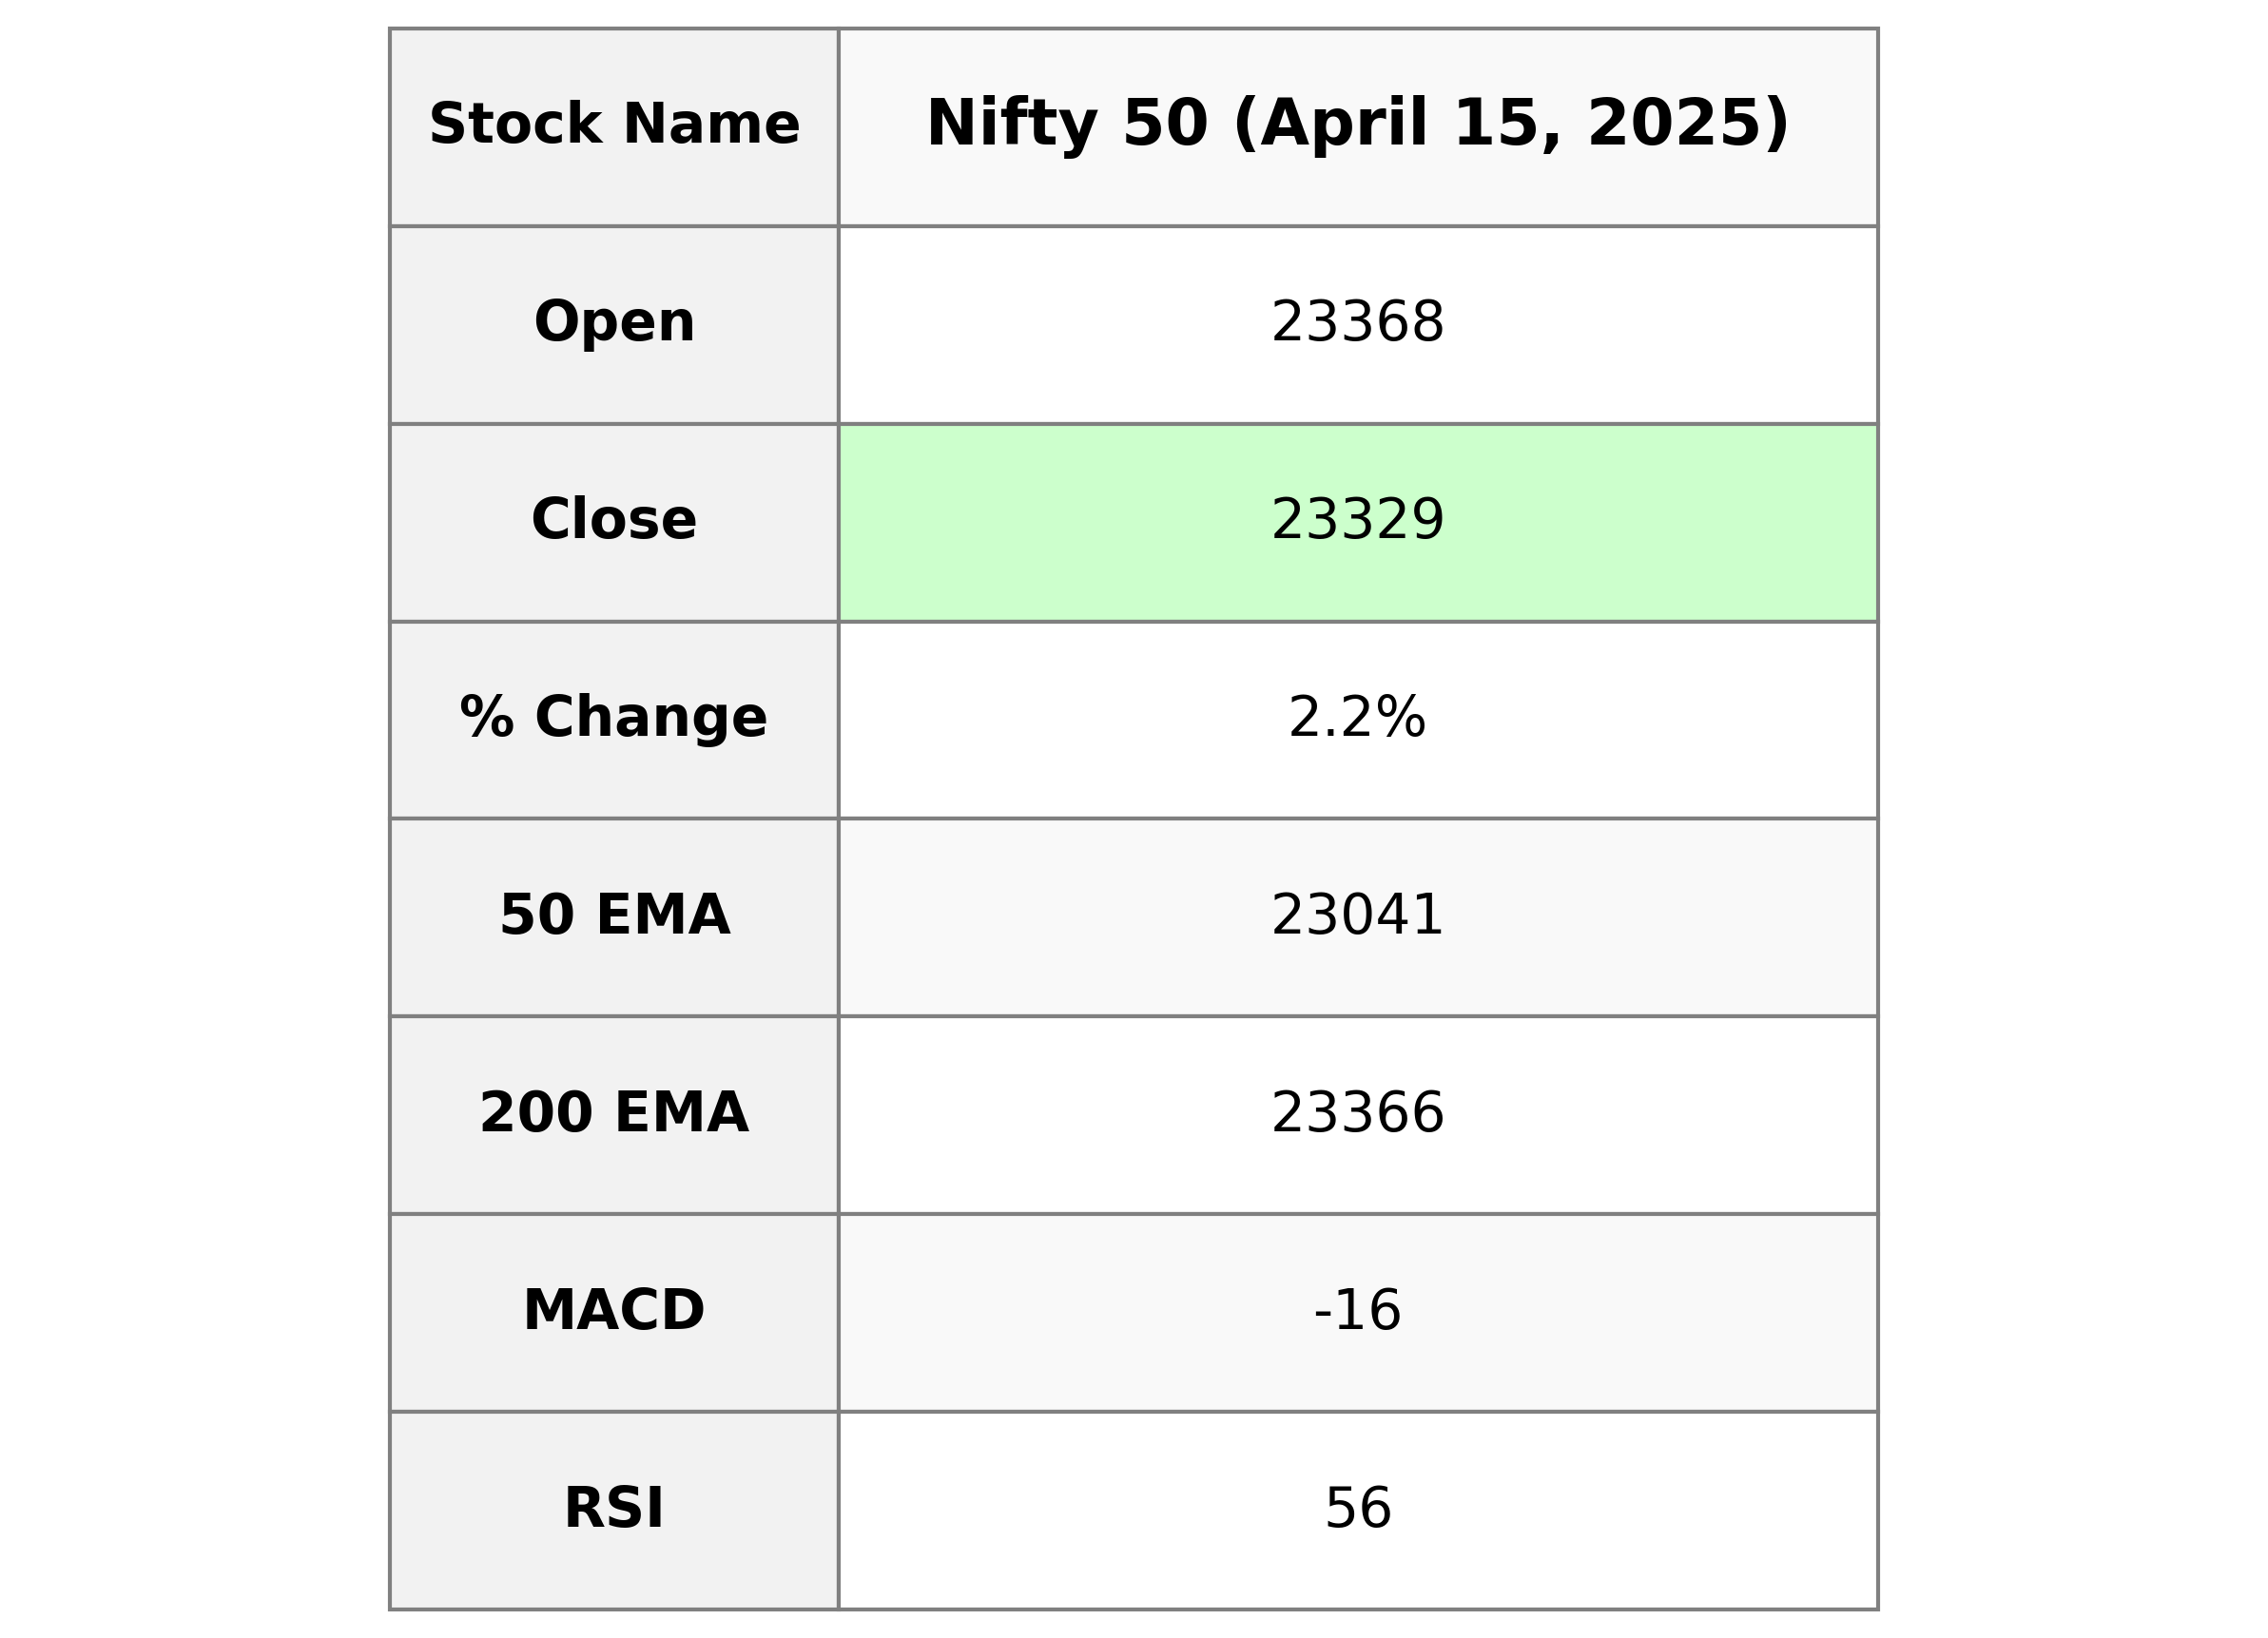
The Nifty 50 opened and reached a high of 23368.35 but closed slightly lower at 23328.55, marking a gain with a 2.19% increase over the previous close. The index experienced a substantial points change of 500.0. With an RSI of 55.96, it suggests a moderately strong momentum, although the MACD indicates potential bearish signals being below the signal line.
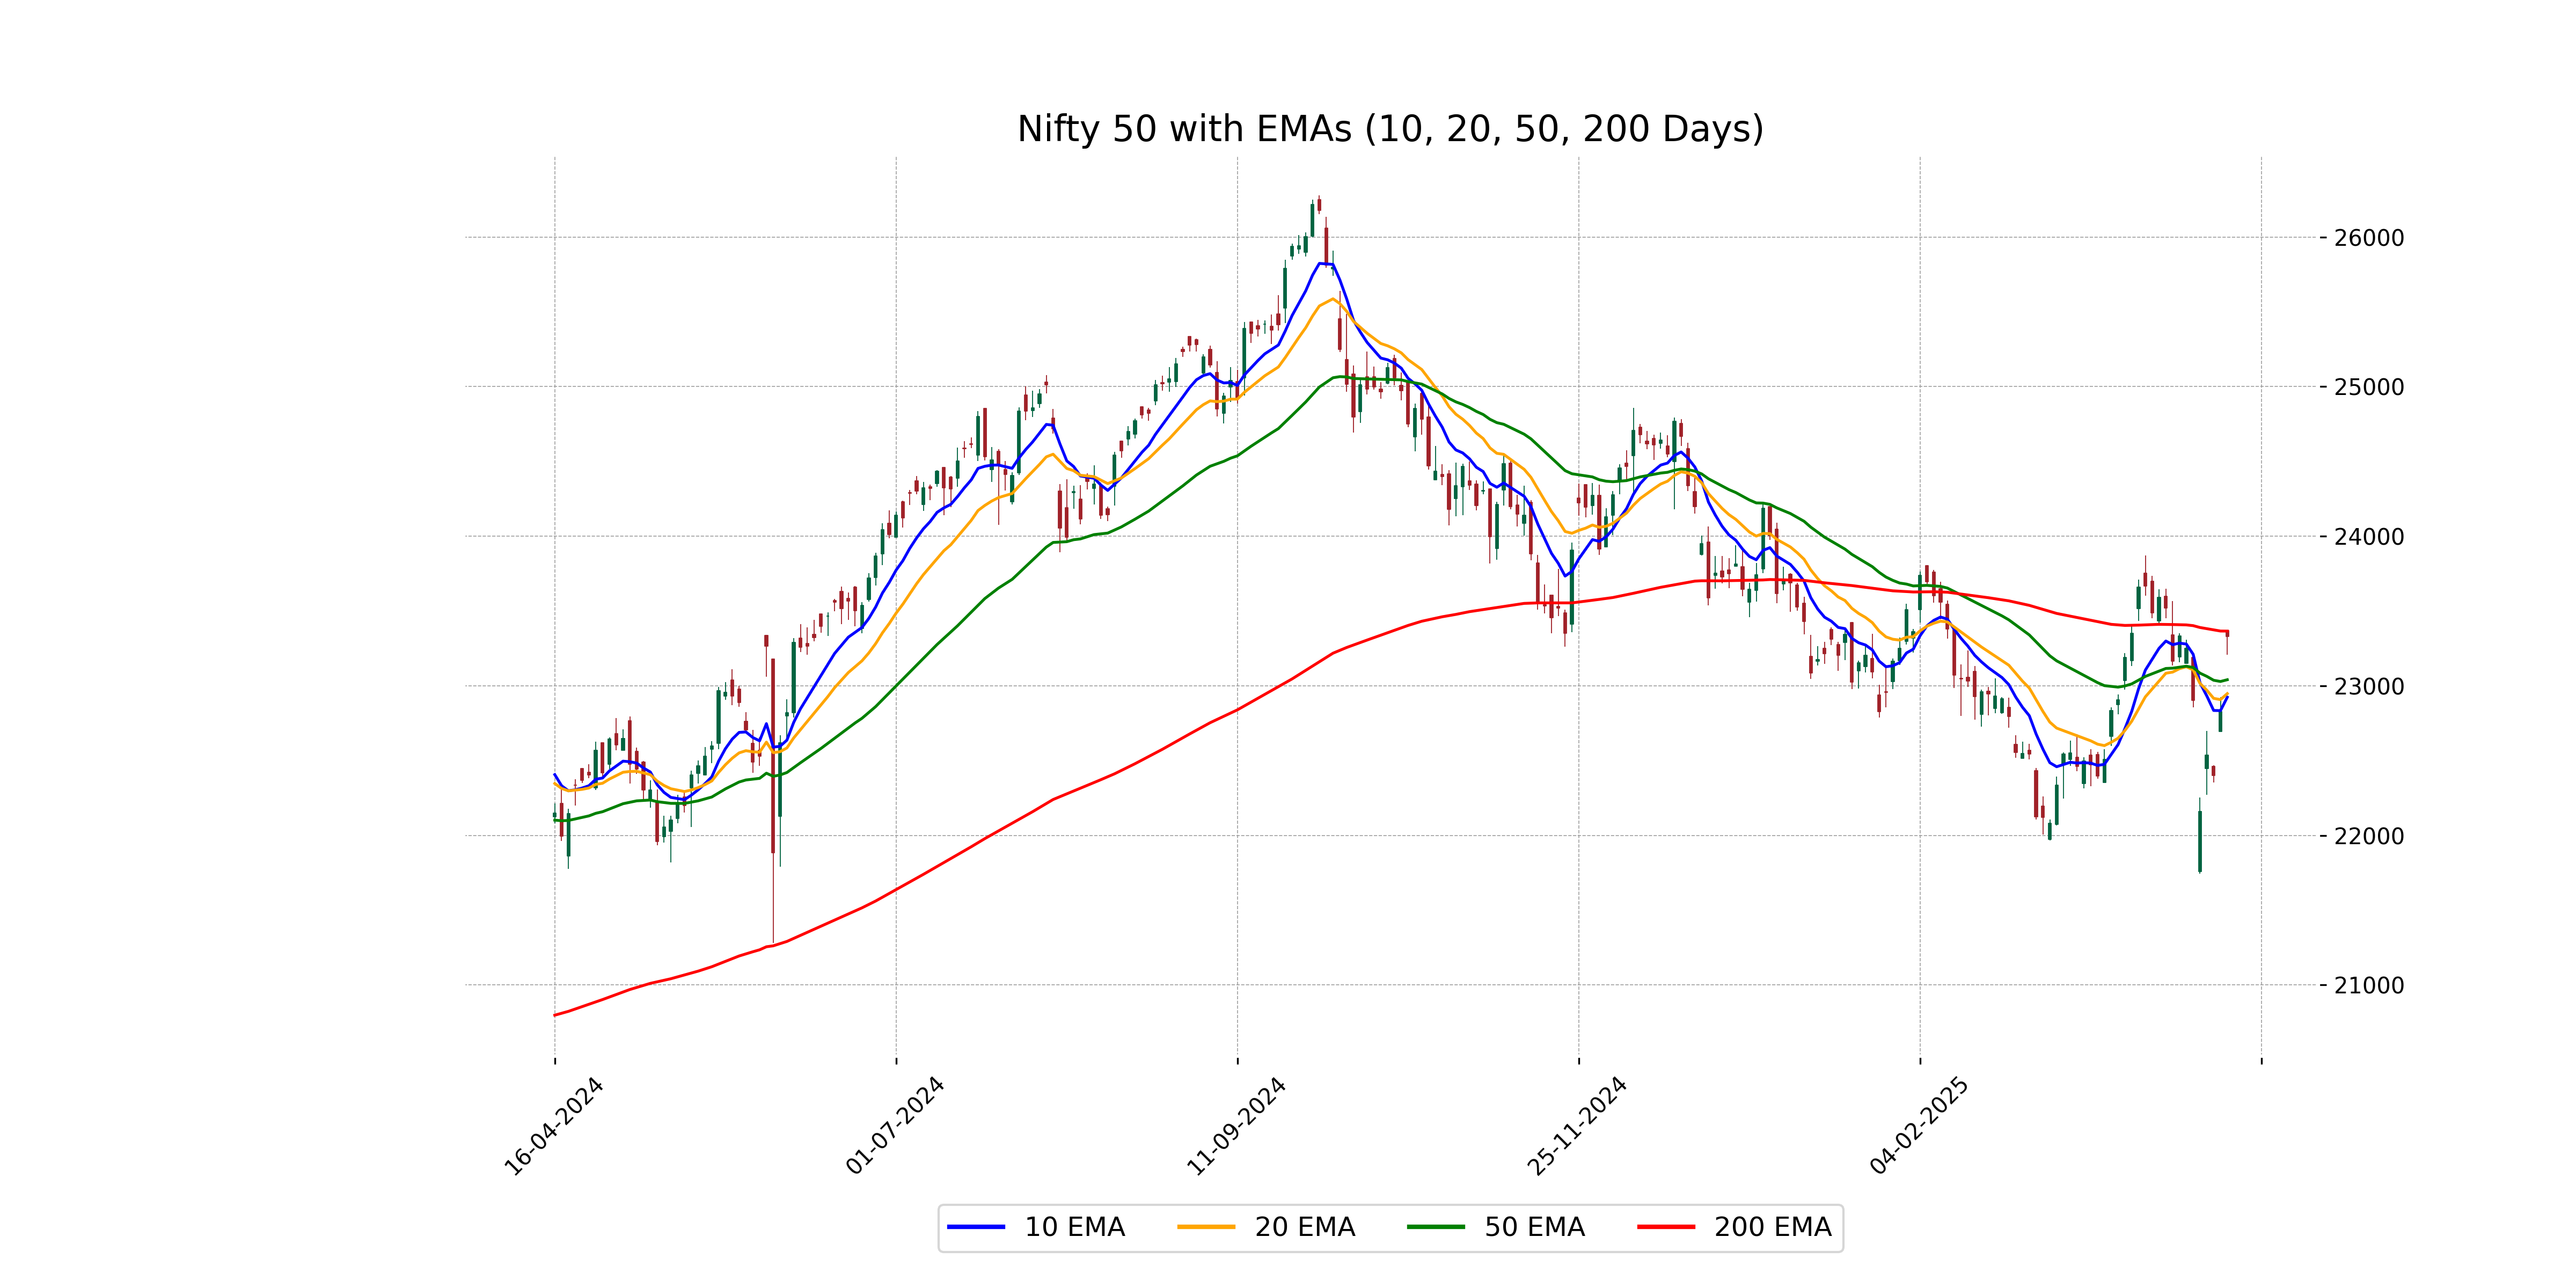
Relationship with Key Moving Averages
Nifty 50 closed at 23328.55, which is above its 50-day EMA of 23040.62, indicating a positive short-term trend. However, it is slightly below its 200-day EMA of 23365.70, suggesting possible resistance or a bearish long-term outlook. The index is also above its 10-day and 20-day EMAs, reflecting recent strength.
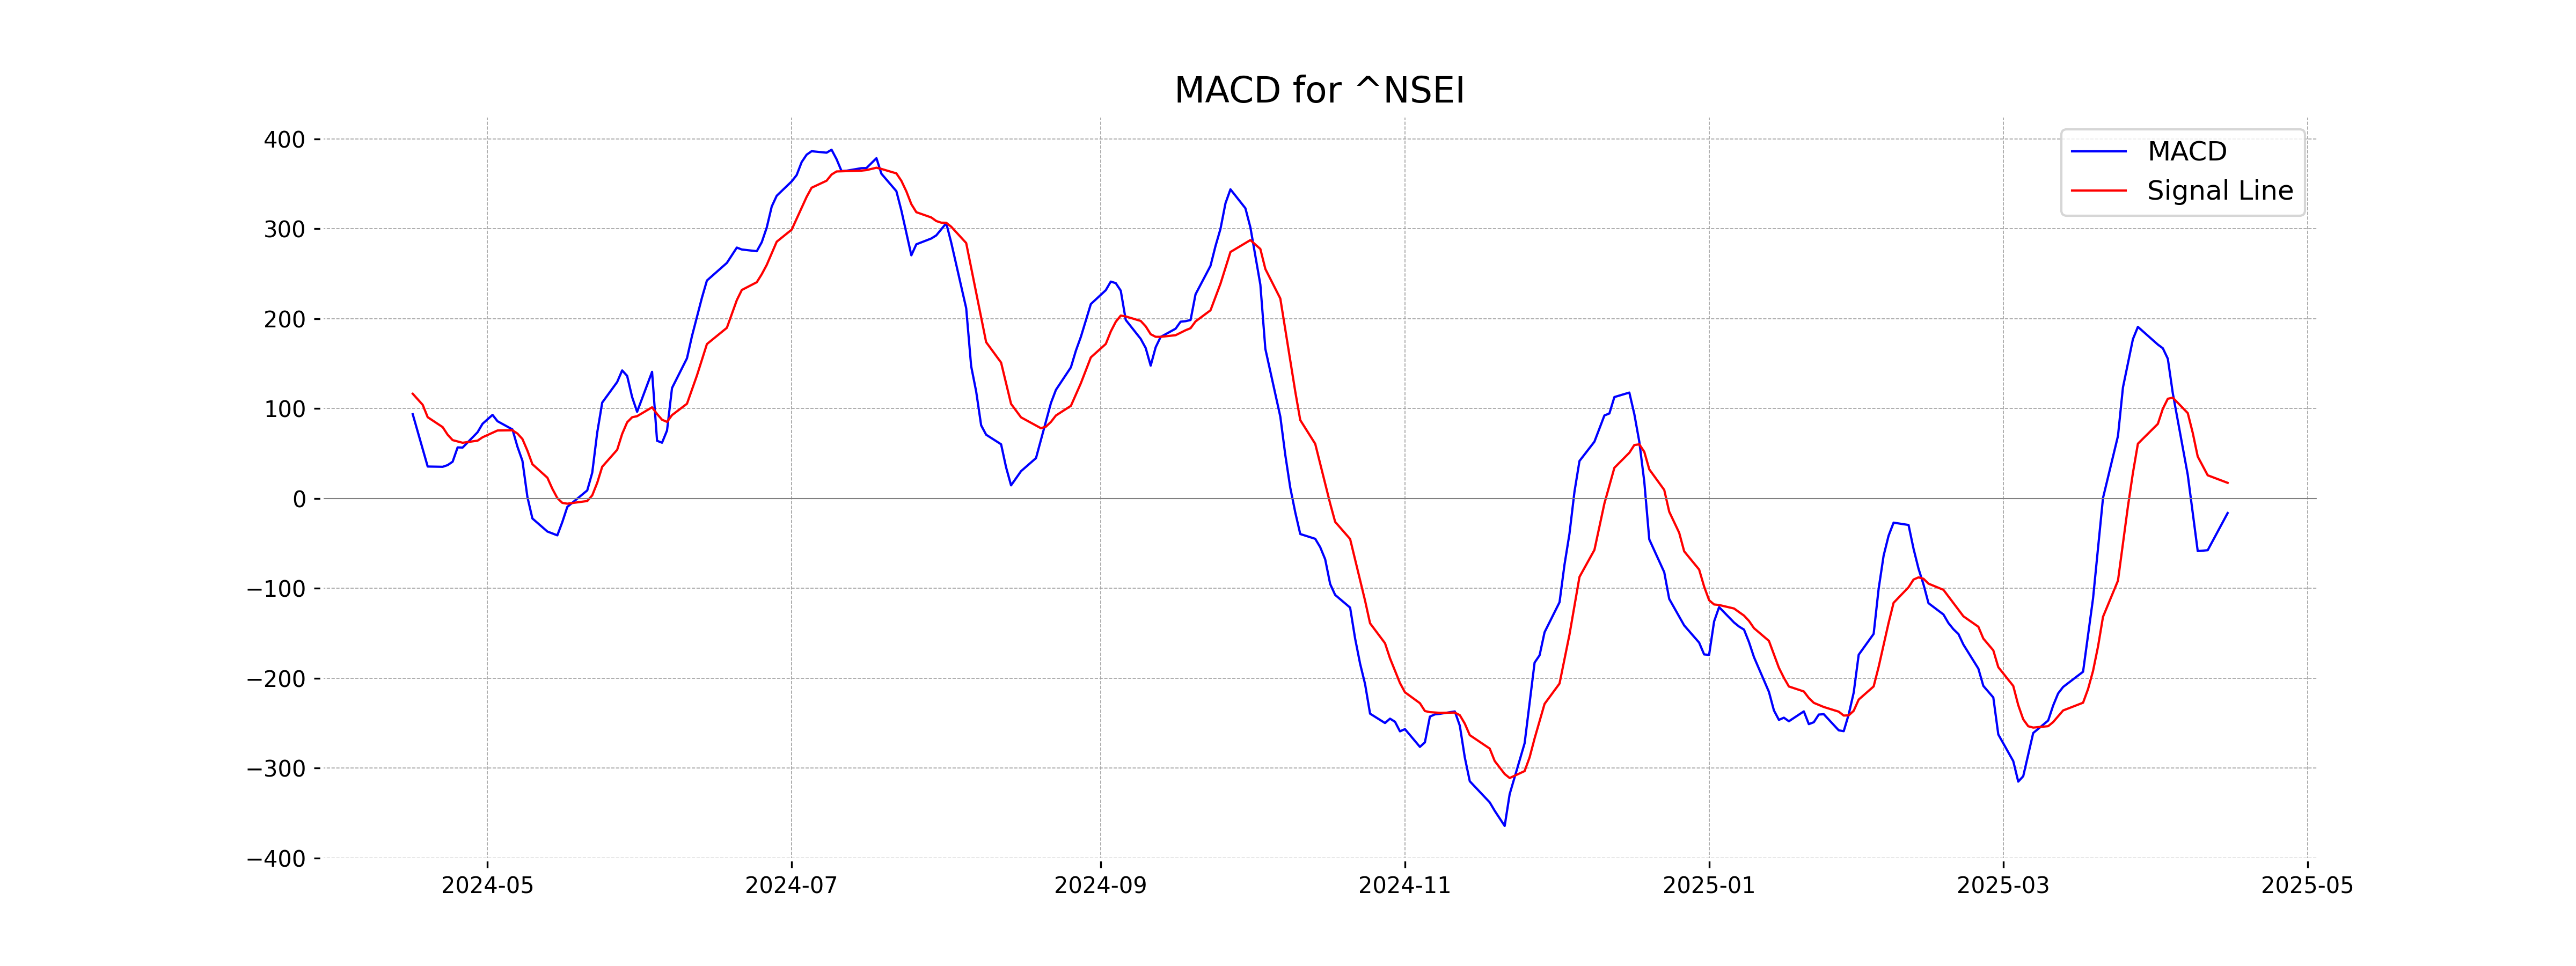
Moving Averages Trend (MACD)
MACD Analysis for Nifty 50: The MACD value is -16.22, indicating a bearish trend as it's below the MACD Signal line value of 17.39. This suggests that the recent momentum may be weakening, and traders should consider this when making decisions.
RSI Analysis
The Relative Strength Index (RSI) for Nifty 50 is currently at 55.96, indicating a neutral position. This suggests that the index is neither in the overbought zone nor in the oversold zone, implying that the market could move in either direction without a strong prevailing trend.
Up Next
?")
Global Stock Market Indices: How the World Markets performed today - (April 15, 2025)?

Microsoft commits USD 17.5 billion investment in India: CEO Satya Nadella

CBI books Anil Ambani's son, Reliance Home Finance Ltd. in Rs 228 crore bank fraud case

RBI raises FY26 GDP growth projection to 7.3 pc

RBI trims policy interest rate by 25bps to 5.25pc, loans to get cheaper

Rupee slumps to all-time low of 90.25 against US dollar in intra-day trade

More videos

Reliance completes merger of Star Television Productions with Jiostar

India to lead emerging market growth with 7pc GDP rise in 2025: Moody’s

Nifty hits record high after 14 months; Sensex nears all-time peak

Reliance stops Russian oil use at its only-for-export refinery to comply with EU sanctions

ED attaches fresh assets worth over Rs 1,400 cr in case against Anil Ambani's Reliance Group

India signs one-year deal to import 2.2 million tonnes of LPG from US

India International Trade Fair begins at Pragati Maidan amid tight security

Stock markets decline in initial trade on foreign fund outflows, weak Asian peers

Amazon to lay off 30,000 office workers amid AI-driven cost cuts

US sanctions on Russian firms to hit Reliance; PSUs likely to keep buying Russian oil via traders