


Highlights
- DJI, IXIC, and N225 supported a generally bullish sentiment
- RSI and MACD suggesting stability or upward momentum across key players
- Caution advised for those exhibiting overbought conditions
Latest news

FC Goa face Mohammedan after securing second place

SUV incident in Mannheim: Multiple injuries as crowd hit by high-speed vehicle

KKR Announces Leadership Changes: Rahane as Captain, Iyer as Vice-Captain for IPL 2025

Chief Minister Yogi Adityanath on managing Maha Kumbh stampede

Mayawati expels nephew Akash Anand amid party discord

Samsung Galaxy A56, A36, A26 Launched – India Pricing Revealed with Introductory Offers!

Salman Khan and Rashmika Mandanna ignite screen in 'Zohra Jabeen' teaser

Execution of Indian woman in UAE sparks legal concerns
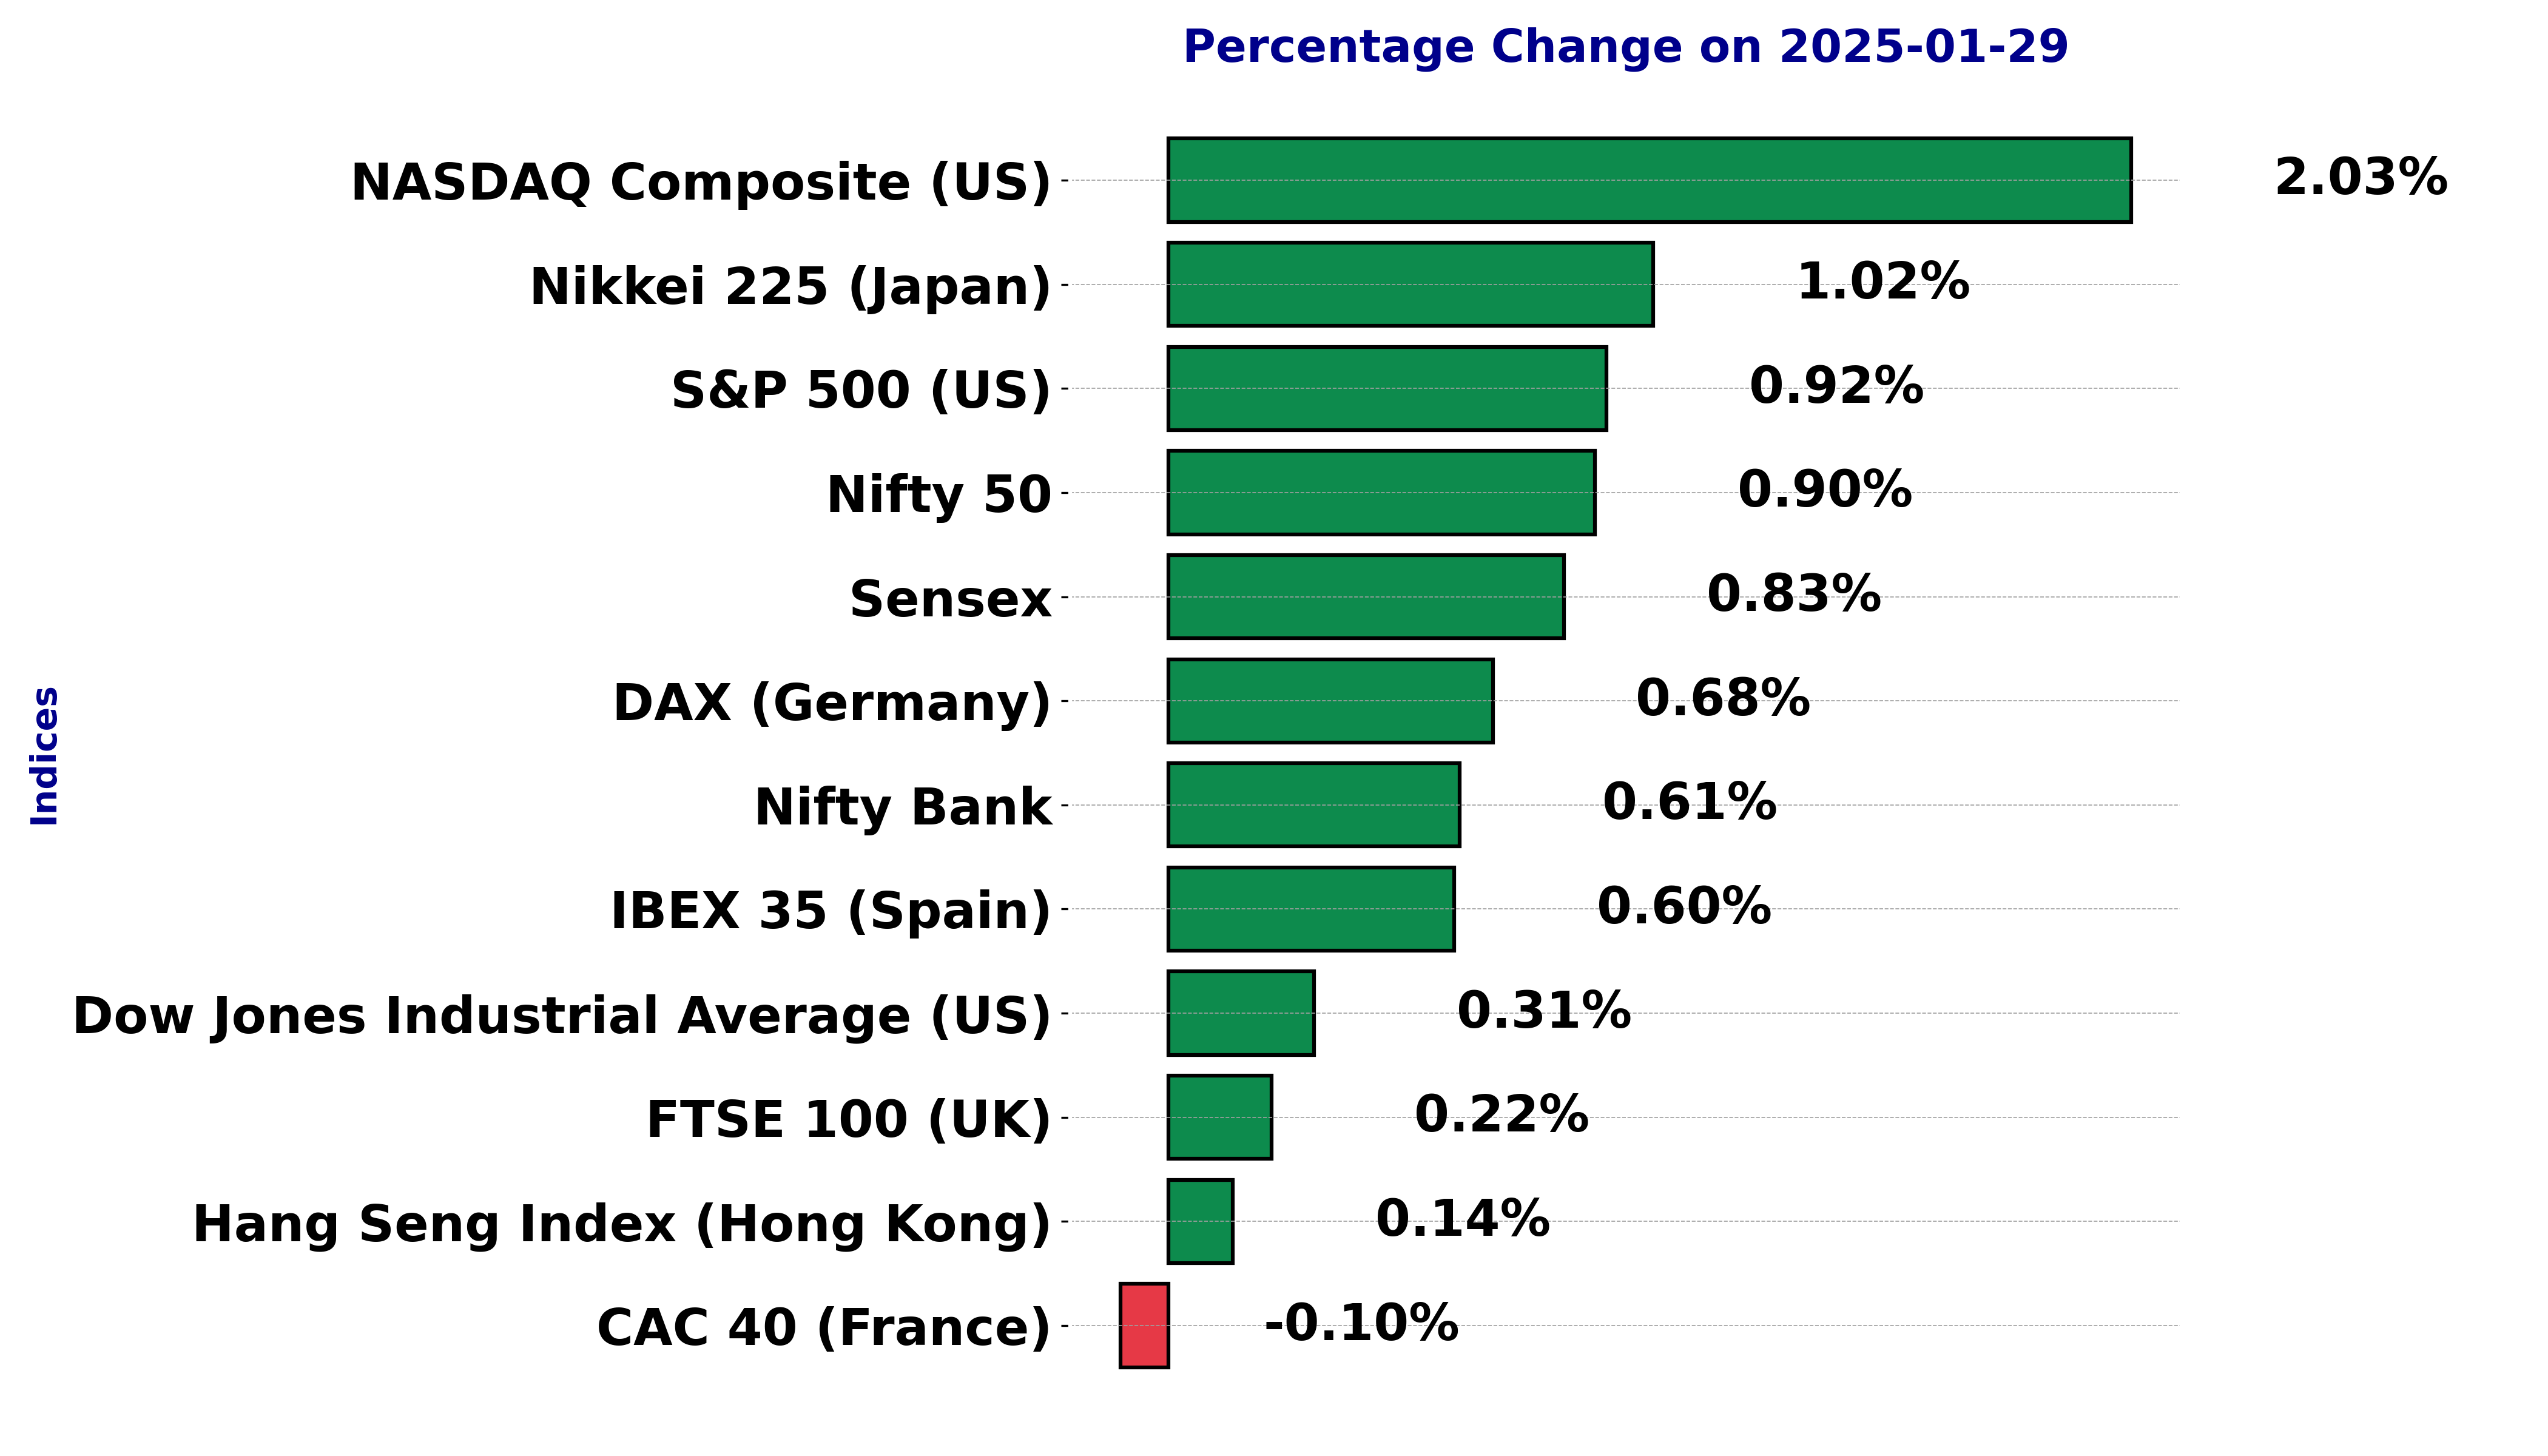
Global stock market indices: How the world markets performed today - 29 January 2025


The international stock market indices showed varied performances on January 29, 2025, reflecting the economic sentiment across different regions.
In this article, we analyze the performance of key global indices including the S&P 500, Dow Jones Industrial Average, NASDAQ Composite, FTSE 100, DAX, CAC 40, IBEX 35, Nikkei 225, Hang Seng, Nifty 50, and BSE Sensex.
Technical Analysis for Stock: BSE SENSEX on January 29, 2025
Sensex opened at 76,138.24, reached a high of 76,599.73, dipped to a low of 75,975.80, and closed at 76,532.96. Compared to the previous close of 75,901.41, this represents a point change of 631.55 and a percentage change of approximately 0.83%.


Relationship with Key Moving Averages:
The 10-EMA is at 76,386.02, and the 20-EMA is at 76,980.61, both below the close price, indicating slight bullish momentum on shorter time frames. The 50-EMA and 200-EMA, at 78,239.25 and 77,845.60 respectively, are above current levels, suggesting a broader bearish sentiment as the stock is trading below these longer-term averages.
RSI Trend:
With an RSI of 43.95, the stock is in a neutral range, slightly leaning toward being oversold, which hints at possible buying opportunities if it moves lower. The RSI suggests consolidation in trend.

MACD Analysis:
The MACD is at -805.82 with a signal line of -817.78. As the MACD is slightly higher than the signal line, it indicates a potential shift towards bullish momentum, though being negative points towards a lingering bearish sentiment.

Stock Performance for DOW JONES INDEX on January 29, 2025:
Dow Jones opened at 44,756.36 and closed at 44,850.35. The high for the day was 44,976.35 and the low was 44,621.96. This is a 0.31% increase from the previous close of 44,713.58, with a points change of 136.77.


Moving Averages and Trend Analysis:
The Dow Jones is currently above its 10-EMA of 44,049.85 and 20-EMA of 43,654.16, as well as its 50-EMA of 43,368.12. These values indicate a bullish trend as the stock's current price is also significantly higher than its long-term average represented by the 200-EMA of 41,437.92. This suggests that the market sentiment is positive, and the trend is likely to continue upward.
Technical Indicators:
The MACD is significantly above the MACD Signal (358.43 vs. 95.11), suggesting a strong bullish momentum in the market, indicating that the current upward trend may continue. The RSI, recorded at 68.13, suggests that the stock is approaching overbought conditions, highlighting strong buying interest. However, it's not yet in the extreme overbought zone, which begins at an RSI of 70.


Index Symbol: CAC 40
Performance for CAC 40 on January 29, 2025:
CAC 40 opened at 7874.72, reached a high of 7889.41, and settled at a close of 7889.41. Compared to its previous close of 7897.37, the stock experienced a slight decrease of 0.10%, translating to a points change of -7.96.


Relationship with Key Moving Averages:
The CAC 40 is currently trading above its 10-EMA (7803.37) which is indicative of immediate bullish momentum. Moreover, the stock is also trading above its 20-EMA (7679.64), 50-EMA (7531.48), and 200-EMA (7522.57), further reinforcing a longer-term bullish trend. This suggests that the stock is in an upward trajectory and is potentially poised for further gains.
Moving Averages Trend (MACD):
The MACD is at 144.07, above its signal line of 114.01, indicating a bullish trend. This positive value suggests increasing upward momentum. 
RSI Analysis:
The RSI value is at 73.01, which is in the overbought territory, suggesting that the stock might be due for a price correction soon. It reflects strong buying pressure.

Stock Performance for FTSE 100 (UK) on January 29, 2025:
On January 29, 2025, the FTSE index had an opening price of 8533.87, reached a high of 8552.51, a low of 8518.27, and closed at 8552.38. The previous closing value was 8533.90, marking a percent change of 0.2165% with a points change of 18.48. The volume recorded was minimal at 0.0, suggesting low trade activity on that day.


Relationship with Key Moving Averages:
FTSE's closing price of 8552.38 is above all key moving averages: the 10-EMA at 8489.44, the 20-EMA at 8415.95, the 50-EMA at 8323.41, and the 200-EMA at 8179.36. This alignment suggests a bullish trend, where shorter-term momentum is supporting a continuation of upward movement. Staying above these averages points towards a healthy market sentiment.
Technical Indicators: MACD and RSI
The MACD value for FTSE is 86.04, higher than its signal line at 69.84, indicating a bullish momentum. This shows that the stock is in a strong upward trend and buyers dominate the market.

The RSI stands at 67.62, which is nearing the overbought threshold of 70. This indicates strong buying interest, but it also warns traders to monitor for any potential slowdown or reversal, as the index approaches an overbought state.

Stock Performance for DAX Index (Germany) on January 29, 2025
On January 29, 2025, DAX opened at 21,511.47, reaching a high of 21,577.68 and a low of 21,475.64, before closing at 21,576.95. The percentage change was 0.68% with a points change of 146.37 points compared to the previous close of 21,430.58. The volume for the day was 0.0.


Relationship with Key Moving Averages
The DAX's current price is above the 10-EMA (21,181.73), the 20-EMA (20,858.94), the 50-EMA (20,312.25), and the 200-EMA (19,058.26). This suggests a bullish trend as the stock's price is above all major moving averages, which typically indicates positive momentum and potential support levels.
RSI Analysis
The RSI for DAX is 77.65, which is above the typical overbought threshold of 70. This indicates that the stock may be overbought and could be due for a pullback or consolidation period. Market participants should watch for signs of potential reversals or continuation of current trends.

MACD Analysis
The MACD value for DAX is 388.01, while the MACD Signal line is at 313.21. The positive difference between the MACD line and the Signal line suggests a bullish trend with upward momentum. If the MACD continues to rise above the Signal line, it could signal a continued bullish trend.

Stock Performance for S&P 500 (US) on January 29, 2025:
The S&P 500 opened at 6,026.97, reaching a high of 6,074.54 and a low of 5,994.63, closing at 6,067.70. This marks an increase from the previous close at 6,012.28, with a point change of 55.42 and a percentage change of approximately 0.92%. The trading volume for the day was 4,473,640,000.


Relationship with Key Moving Averages:
The current price is above the 10-EMA (6,026.04), 20-EMA (5,996.23), 50-EMA (5,954.45), and 200-EMA (5,625.67). This positioning indicates a bullish trend for S&P 500, as it is consistently trading above these significant moving averages, showing strong momentum.
MACD Trend:
The MACD is at 29.23, well above the MACD Signal line at 11.73, suggesting a strong bullish momentum for the stock. This positive divergence indicates continued upward momentum in the stock price.

RSI Analysis:
The RSI value is 57.03, which is in the neutral zone, suggesting that the stock is neither overbought nor oversold. This indicates a stable market sentiment, leaving room for further price movements.

Stock Performance for Hang Seng Index (Hong Kong) on January 29, 2025:
The Hang Seng Index opened at 20,337.46 and closed at 20,225.11. It experienced a high of 20,337.46 and a low of 20,165.73. The previous close was at 20,197.77, resulting in a % change of 0.135%. The volume traded was 945,200,000 shares. The index saw a points change of +27.34.


Relationship with Key Moving Averages:
The current closing price of HSI is above the 10-EMA (19,890.25) and the 20-EMA (19,778.42), as well as the 50-EMA (19,746.30). This indicates a short-term bullish trend as the index stays above these moving averages. The continuation of this trend is supported by its position relative to the 200-EMA (18,979.54), showing a long-term bullish tendency.
Moving Averages Trend [MACD] and RSI:
The MACD value of 86.23, with a positive MACD Signal at -12.97, suggests a bullish momentum in the market, indicating that the stock price may continue to rise if the trend holds. The RSI is at 59.85, which is in the neutral zone, leaning towards overbought, signaling a potential continuation of the upward trend if it surpasses the threshold without entering the overbought condition conclusively.


Stock Performance for IBEX 35 (Spain) on January 29, 2025:
The IBEX 35 opened at 12197.30, reached a high of 12235.10, and closed at 12227.30. The previous close was 12154.20, which indicates a percentage change of 0.601%, translating to a points gain of 73.10.


Relationship with Key Moving Averages:
The IBEX 35 is trading above several key moving averages. The 10-EMA is at 12006.97, the 20-EMA at 11909.02, the 50-EMA at 11794.23, and the 200-EMA at 11351.51. This positioning indicates a bullish trend, as the current price is above all these averages, suggesting strong upward momentum.
Technical Indicators:
RSI (Relative Strength Index):
The RSI for IBEX 35 is at 70.30, which is generally considered to be in the overbought region. This suggests that the stock might experience a pullback as it is currently in an overbought condition.

MACD (Moving Average Convergence Divergence):
The MACD is currently at 107.55 with a signal line at 71.39. The considerable distance above the signal line suggests strong bullish momentum. The MACD indicates that the stock is in an upward trend and may continue its positive trajectory as it remains well above the signal line.

Stock Performance for NASDAQ Composite (US) on January 29, 2025:
On January 29, 2025, the Nasdaq Composite Index opened at 19,418.22. It reached a high of 19,759.43, a low of 19,294.62, and closed at 19,733.59. Compared to the previous close of 19,341.83, the index increased by 391.76 points, marking a percentage change of 2.03%.


Relationship with Key Moving Averages:
The 10-EMA is at 19,666.01, 20-EMA is at 19,614.57, 50-EMA is at 19,399.58, and the 200-EMA is substantially lower at 18,022.91. The current close of 19,733.59 is above all these EMAs, suggesting a strong bullish trend. Such positioning usually indicates solid upward momentum, with the 10-EMA and 20-EMA showing short-term strength in the upward direction.
Moving Averages Trend [MACD]:
The MACD for Nasdaq Composite Index stands at 66.34, which is above the MACD Signal Line of 49.07. This divergence often hints at upward momentum, reinforcing the bullish trend indicated by the moving averages. A rising MACD further supports expectations of continued strength in the index.

RSI Explanation:
The RSI value is 52.61, which is generally considered neutral and not indicating overbought or oversold conditions. This suggests that the recent price movements have been balanced, without strong pressure either upwards or downwards. The RSI level supports the idea of sustained momentum without risk of immediate downturn.

Stock Performance for Nikkei 225 (Japan) on January 29, 2025:

On January 29, 2025, the Nikkei 225 index closed at 39,414.78, marking a percentage change of 1.02% compared to the previous close of 39,016.87. The day's trading range was between a low of 39,129.14 and a high of 39,448.24, illustrating a positive points change of 397.91. The current market climate suggests a bullish trend supported by this increase.

Relationship with Key Moving Averages:
The Nikkei 225 is trading above its 10-EMA (39,350.79) and 20-EMA (39,294.62), and significantly above its 50-EMA (39,120.32) and 200-EMA (38,199.74). This position above the key moving averages indicates a strong bullish trend, suggesting upward momentum and sustained buying interest in the market.
RSI Analysis:
The RSI for Nikkei 225 is currently at 51.80, which indicates a neutral stance between being overbought and oversold. This neutrality reflects a balance in market sentiment, offering neither strong buying nor selling signals.

Moving Averages & MACD Analysis:
The MACD value of 71.82 against the MACD Signal of 53.87 suggests bullish momentum as the MACD line is above the signal line. This is indicative of potential upward pressure in the price. The overall bullish trend could be further confirmed if the MACD continues to rise above its signal line, emphasizing the index's strength.

Stock Performance for NIFTY BANK on January 29, 2025:

NIFTY BANK showed a closing value of 49,165.95, up from the previous close of 48,866.85, marking a 0.61% increase and a rise of 299.10 points. The stock traded within a range of 48,849.80 (low) to 49,199.64 (high) over the day.

Technical Analysis Based on Key Moving Averages:
The stock price of NIFTY BANK is currently below the 50-EMA (50,339.15) and 200-EMA (50,240.26), suggesting a bearish trend. However, it is slightly above the 10-EMA (48,826.98) but below 20-EMA (49,297.58), indicating short-term fluctuation with potential resistance near the 20-EMA level.
RSI Analysis:
The Relative Strength Index (RSI) stands at 46.03, which indicates that the stock is in a neutral zone, leaning slightly towards oversold conditions. This level does not imply any strong momentum in either direction.

MACD Analysis:
The MACD line is at -681.84, while the MACD signal line sits at -771.31. The positive difference between these values suggests that the MACD line is moving upwards relative to the signal line, which may indicate the initial stages of a bullish reversal, albeit from a negative position.

Stock Performance on January 29, 2025, for ^NSEI:
On January 29, 2025, the stock index NIFTY 50 opened at 23,026.75, reached a high of 23,183.35, and closed at 23,163.10. This closing price represents an increase of 0.90% from the previous close of 22,957.25, with a points change of 205.85.


Relationship with Key Moving Averages:
The closing price of NIFTY 50 is just above the 10-EMA (23,133.91) but below the 20-EMA (23,311.31), 50-EMA (23,704.92), and 200-EMA (23,628.76). This indicates a short-term bullish trend as the price is above the 10-EMA, but the overall sentiment remains bearish due to its position below the longer moving averages.
Technical Indicators:
RSI: The Relative Strength Index (RSI) is at 43.59, suggesting that the market is neither overbought nor oversold. This mid-level RSI points to a neutral momentum in the stock, leaving room for potential movement in either direction.

MACD: The Moving Average Convergence Divergence (MACD) is currently -240.25, slightly higher than its signal line at -241.30. This slight crossover indicates a possible short-term bullish momentum, yet the negativism remains prominent, reflecting a prevailing downward trend.

Up Next

Global stock market indices: How the world markets performed today - 29 January 2025

Indian stock market sector-wise performance today - March 03, 2025

Top 5 Nifty 50 gainers today – March 03, 2025: Biggest stock moves

NSE Nifty 50: Top 5 stock losers of March 03, 2025

Bloodbath on D-Street: Sensex, Nifty tank nearly 2 pc on global rout after Trump's tariff threats

NSE Nifty 50: Top 5 stock losers of February 28, 2025

More videos

Top 5 Nifty 50 gainers today – February 28, 2025: Biggest stock moves

Indian stock market sector-wise performance today - February 28, 2025

Global stock market indices: How the world markets performed today - 28 February 2025

Global stock market indices: How the world markets performed today - 27 February 2025

Indian stock market sector-wise performance today - February 27, 2025

Sensex bounces back after 5-day slump; Nifty ends marginally lower

LIC faces Rs 57.2 Crore tax demand over excess ITC

Maruti Suzuki aims to double production and boost exports by 2030

Global stock market indices: How the world markets performed today - 18 February 2025

Indian stock market sector-wise performance today - February 18, 2025