


Highlights
- signs of both uptrend and downtrend across different indices
- RSI and MACD provide a comprehensive understanding
- Caution due to overbought signals and negative MACD in select areas
Latest news

FC Goa face Mohammedan after securing second place

SUV incident in Mannheim: Multiple injuries as crowd hit by high-speed vehicle

KKR Announces Leadership Changes: Rahane as Captain, Iyer as Vice-Captain for IPL 2025

Chief Minister Yogi Adityanath on managing Maha Kumbh stampede

Mayawati expels nephew Akash Anand amid party discord

Samsung Galaxy A56, A36, A26 Launched – India Pricing Revealed with Introductory Offers!

Salman Khan and Rashmika Mandanna ignite screen in 'Zohra Jabeen' teaser

Execution of Indian woman in UAE sparks legal concerns
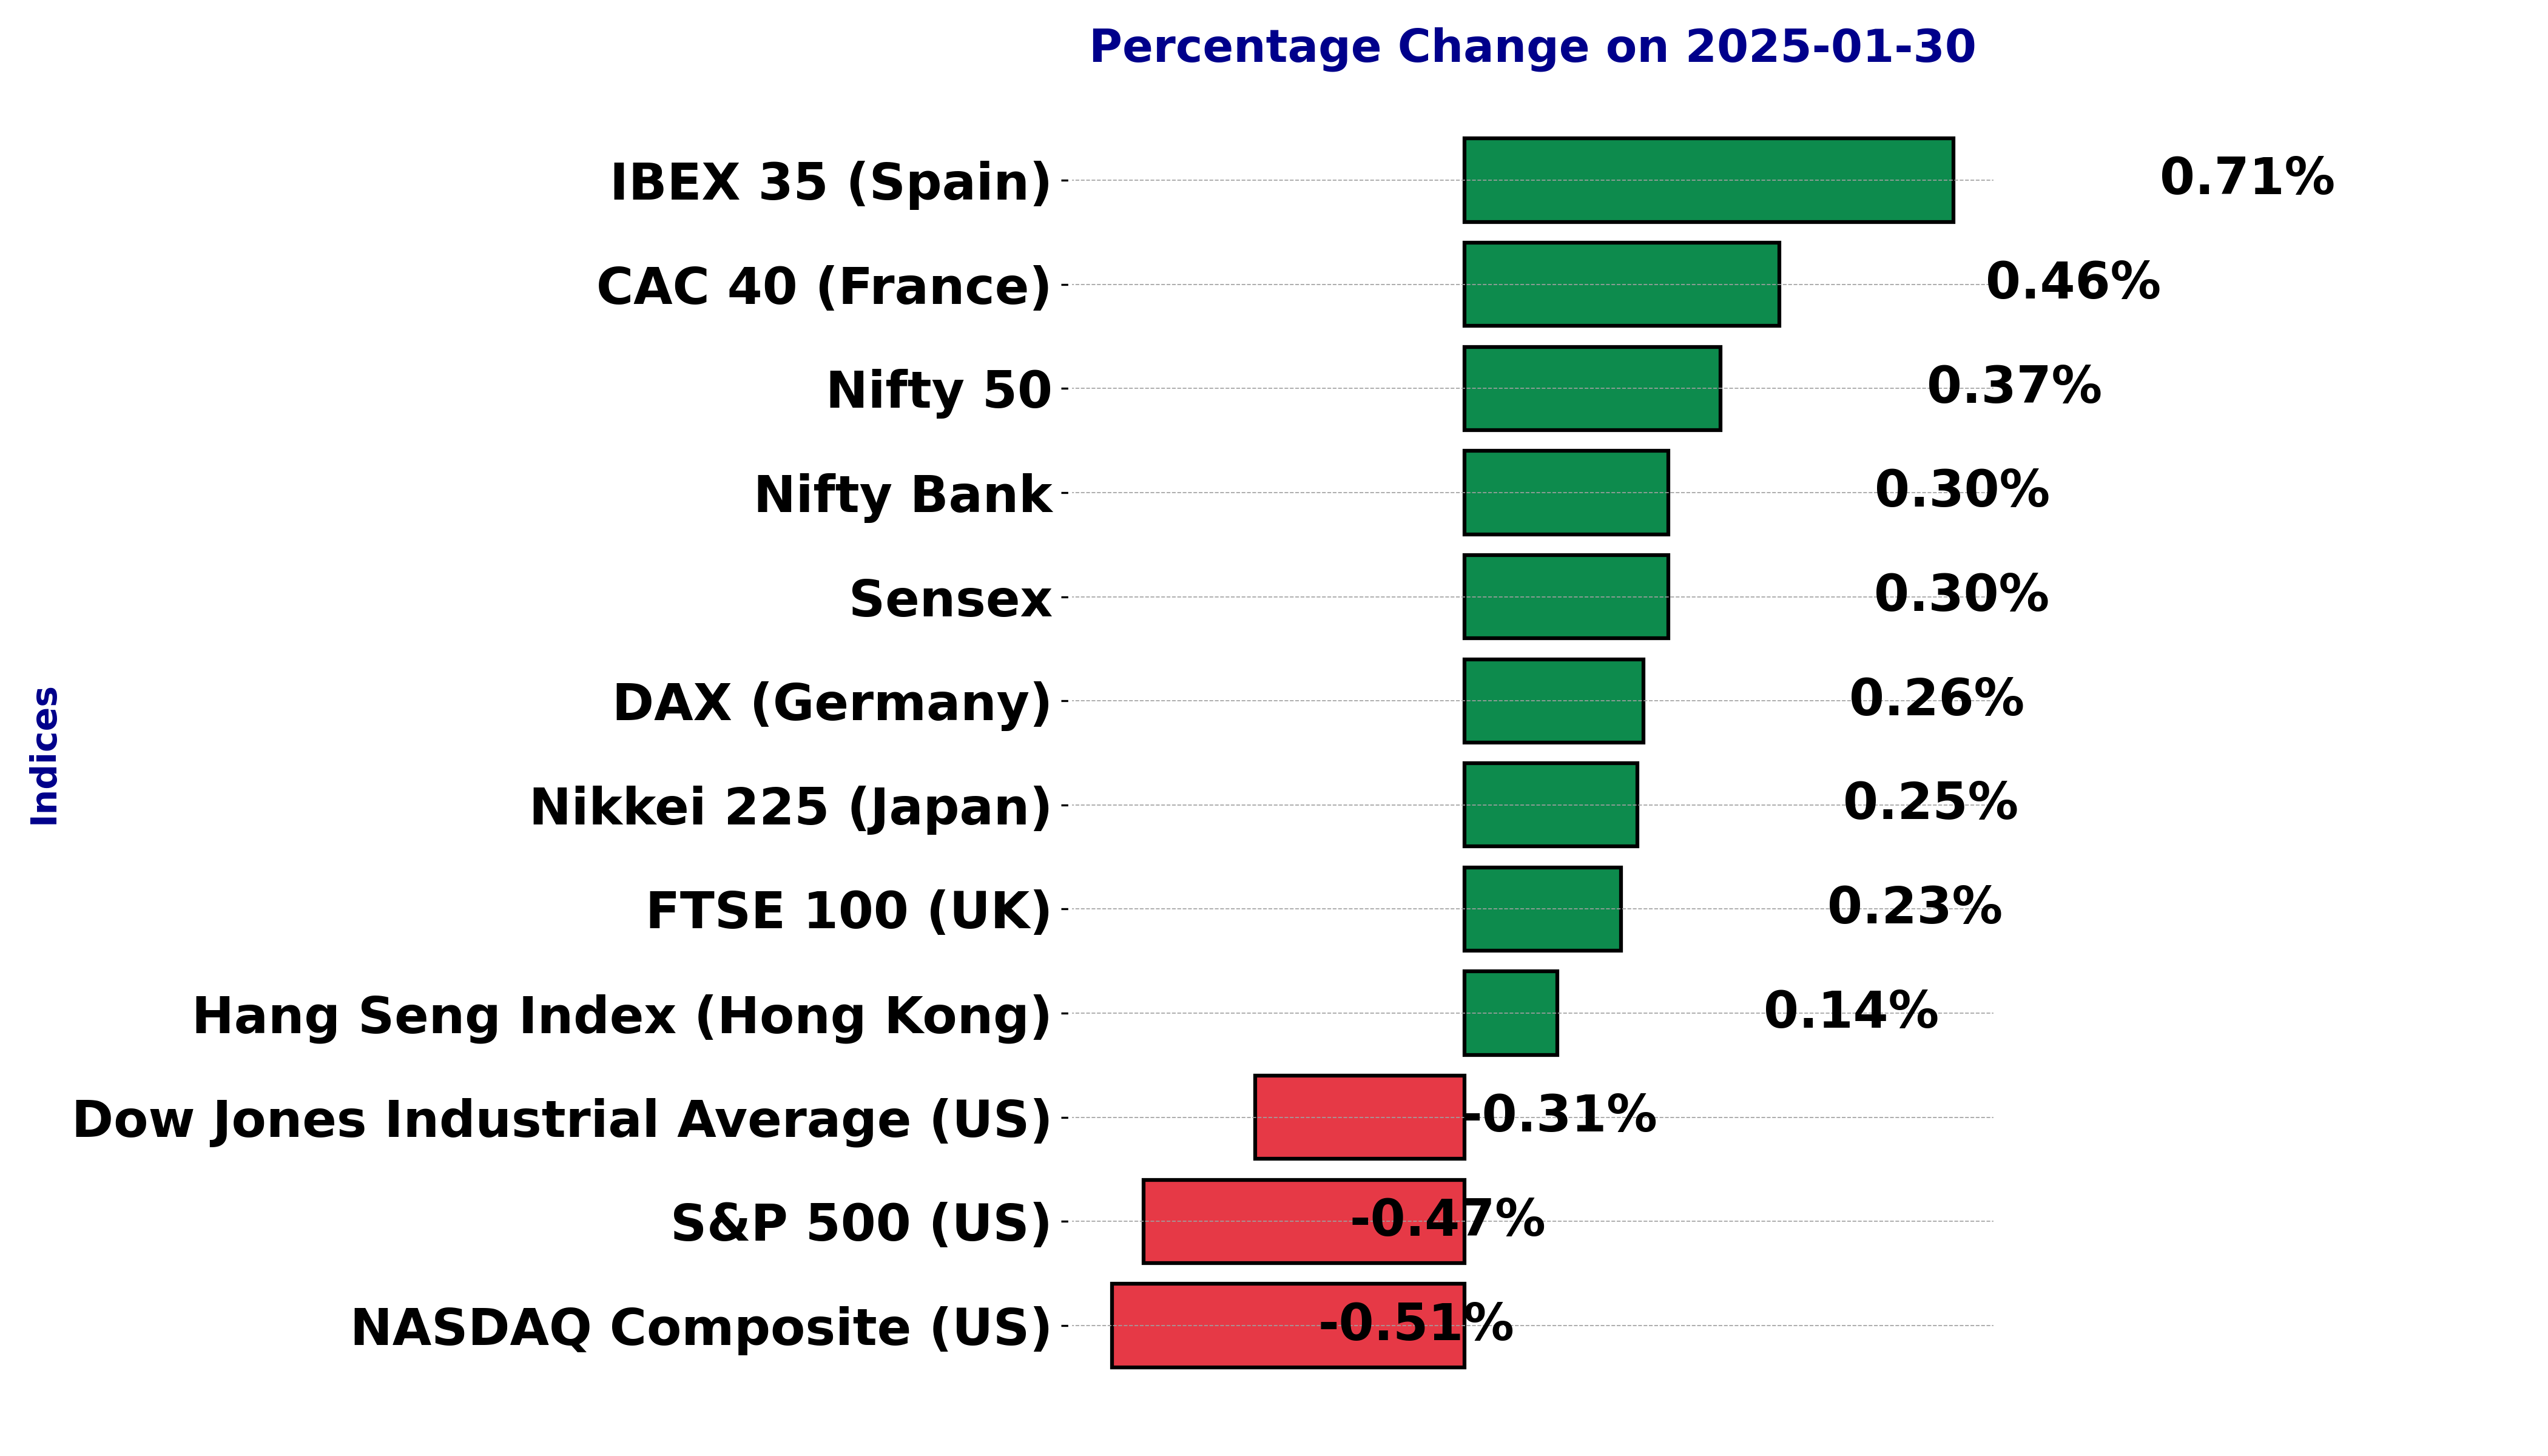
Global stock market indices: How the world markets performed today - 30 January 2025


The international stock market indices showed varied performances on January 30, 2025, reflecting the economic sentiment across different regions.
In this article, we analyze the performance of key global indices including the S&P 500, Dow Jones Industrial Average, NASDAQ Composite, FTSE 100, DAX, CAC 40, IBEX 35, Nikkei 225, Hang Seng, Nifty 50, and BSE Sensex.
Stock's Performance for BSE SENSEX on January 30, 2025:
The stock symbol BSE Sensex opened at 76,598.84, reached a high of 76,962.88, and a low of 76,401.13, closing at 76,759.81. This resulted in a percentage change of 0.30%, with a point change of 226.85 from the previous close of 76,532.96. The trading volume for the day is reported as 0.0.


Relationship with Key Moving Averages:
The current close of BSE Sensex at 76,759.81 is below the 50-EMA (78,181.23) and 200-EMA (77,835.03), aligning more closely with the 10-EMA (76,453.98) and hovering near the 20-EMA (76,959.58). This positioning indicates a bearish trend, especially since the stock has not surpassed the longer-term moving averages.
Moving Averages Trend (MACD):
The MACD value of -725.43 compared to the MACD Signal of -799.31 highlights that the stock may be in a bearish phase. The negative MACD suggests the likelihood of continued downward momentum in the short term.

Relative Strength Index (RSI):
The RSI stands at 45.76, which is below the neutral 50 level, indicating that the stock is neither overbought nor oversold but leans slightly towards being on the weaker side of the spectrum. This could suggest consolidating or potential bearish movement unless supported by other bullish signals.

Stock Performance for DOW JONES INDUSTRIAL (US) on January 30, 2025:
The Dow Jones Industrial Average experienced a slight decline with a closing price of 44,713.52. This represents a percentage change of -0.31%, equivalent to a points change of -136.83 points from the previous close of 44,850.35. The day's trading saw a high of 44,962.58 and a low of 44,579.10, with a volume of 695,190,000 shares.


Relationship with Key Moving Averages:
The Dow Jones Industrial Average is currently trading above its 10-EMA (44,170.52), 20-EMA (43,755.05), 50-EMA (43,420.88), and 200-EMA (41,470.64), which suggests it is in a bullish trend. The relative positioning of the moving averages, with shorter-term EMAs being above the longer-term EMAs, reinforces the current bullish sentiment for the index.
Technical Indicators - MACD and RSI:
The MACD value of 394.66, along with its signal line of 155.02, indicates strong bullish momentum. A positive MACD with a larger difference from its signal line shows increasing upward pressure.

The RSI is at 65.62, suggesting that the stock is approaching overbought levels but isn't there yet. This level typically indicates strong buying interest but warrants caution as it nears the overbought threshold.

Stock Performance for CAC 40 (France) on January 30, 2025:
CAC 40 opened at 7904.47, reached a high of 7914.03, and closed at 7908.60. It had a previous close of 7872.48, showing a percentage change of 0.46% and a points change of 36.12 points. The volume was recorded as 0, which might indicate no significant trading activity.


Relationship with Key Moving Averages:
The 10-EMA is at 7819.99, the 20-EMA is at 7699.99, the 50-EMA is at 7545.63, and the 200-EMA is at 7526.26. The current stock price is above all these moving averages, which suggests a bullish trend. This indicates strong upward momentum as the stock trades above its short, medium, and long-term moving averages.
RSI Analysis:
The RSI stands at 72.73, suggesting that the stock is currently overbought. An RSI above 70 is generally considered to be in the overbought territory, which might hint at a potential correction or pullback in the near future.

MACD Trend:
The MACD value is 143.09, which is above the MACD Signal line at 119.61. This positive crossover indicates that there is still bullish momentum in the stock. The MACD is above the signal line, which typically supports a continuation of the current trend.

Technical Analysis for Stock Symbol: FTSE 100 (UK) on January 30, 2025
Performance: On January 30, 2025, the stock FTSE 100 opened at 8557.81, reached a high of 8579.01, a low of 8547.86, and closed at 8577.32. The previous close was 8557.80, resulting in a percentage change of 0.23% and a points change of 19.52.


Moving Averages and Trend: The FTSE 100 is currently above its 10-EMA (8506.22), 20-EMA (8431.79), 50-EMA (8333.57), and 200-EMA (8183.38). This alignment supports a bullish trend as the stock’s current price is trending above all these key EMAs, indicating strong upward momentum.
MACD Analysis: The MACD is at 88.38, compared to the signal line at 73.61, which suggests a bullish momentum as the MACD is above the signal line, indicating potential continued upward movement.

RSI: The RSI is at 69.19, which is close to the overbought threshold of 70. This suggests that the stock could be approaching overbought conditions, which may lead to a potential retracement or consolidation period.

DAX (Germany) Stock Performance on January 30, 2025:
On January 30, 2025, the DAX opened at 21,676.22, reached a high of 21,715.13, and closed at 21,693.82. The stock experienced a price change of 0.260% compared to its previous close of 21,637.53, reflecting a positive points change of 56.29.


Moving Averages and Current Trend:
The current price of DAX is above its 10-EMA (21,283.85), 20-EMA (20,943.67), 50-EMA (20,368.71), and significantly above the 200-EMA (19,085.15). This alignment above all the moving averages, especially the 200-EMA, indicates a strong bullish trend for the stock.
Moving Averages Trend (MACD):
The MACD value of 409.96 compared to the MACD Signal of 333.33 suggests a sustained bullish momentum, as the MACD line is firmly above the signal line. This indicates strong buying activity in the market.

RSI Analysis:
With an RSI value of 79.12, the stock is currently in the overbought territory, typically indicating that the asset might be overpriced and could be due for a correction or maneuver sideways movement. However, in a strong uptrend, high RSI levels may persist over time.

Stock Performance for S&P 500 (US) on January 30, 2025
On January 30, 2025, the stock market for S&P 500 opened at 6,057.70, reached a high of 6,062.83, and fell to a low of 6,012.96, closing the day at 6,039.31. Compared to the previous close of 6,067.70, this represents a modest decrease of 0.47% or a points change of -28.39, with a trading volume of 4,115,310,000 shares.


Relationship with Key Moving Averages
The current close of 6,039.31 is above the 10-EMA (6,028.45) and the 20-EMA (6,000.33), but slightly below the 50-EMA (5,957.78), indicating a short-term bullish trend. The stock is comfortably above the 200-EMA (5,629.81), suggesting long-term strength despite the day's decline.
Trend Analysis (MACD and RSI)
The MACD of 28.84 exceeds the signal line of 15.15, which typically signifies a bullish trend, as it indicates that momentum is directed upwards. The RSI stands at 54.36, which is neutral but slightly leaning towards bullish, as values between 50 and 70 imply an upward momentum.


Stock Performance for HANG SANG INDEX (Germany) on January 30, 2025:
Opening at 20,337.46, Hang Seng Index reached a high of 20,337.46 and a low of 20,165.73, closing at 20,225.11. The previous close was 20,197.77, resulting in a percentage change of 0.14% and a points change of 27.34. The total volume for the day was 945,200,000 shares.


Relationship with Key Moving Averages:
The stock is currently above its 10-EMA (19,890.25), 20-EMA (19,778.42), and 50-EMA (19,746.30), indicating a bullish trend as the closing price is higher than these moving averages. Additionally, it is well above the 200-EMA (18,979.52), further supporting the bullish sentiment.
RSI Analysis:
The RSI at 59.85 suggests that the stock is neither overbought nor oversold, thereby maintaining a neutral stance. This indicates a balanced market condition where the stock has room for upward movement without immediate threat of a reversal.

MACD Analysis:
The MACD is at 86.23, with a signal line at -12.97, suggesting a strong bullish trend. The MACD being significantly positive indicates that the average closing price is rising, and with the MACD line above the signal line, it's a strong bullish confirmation.

Technical Analysis for IBEX 35 (Spain) on January 30, 2025
IBEX 35 opened at 12,326.20 and closed at 12,374.00, with a high of 12,403.50 and a low of 12,326.20. The previous close was at 12,286.50, marking a points change of 87.5 and a percentage change of 0.71%. The trading volume for the day was 40,567,803.


Relationship with Key Moving Averages:
The current price of IBEX 35 is above all significant moving averages: the 10-EMA (12,082.51), 20-EMA (11,958.40), 50-EMA (11,819.20), and 200-EMA (11,362.30). This alignment suggests a bullish trend, indicating upward momentum in the stock's performance.
Moving Averages Trend (MACD):
The MACD value is 134.53 with a signal of 84.77, showing a positive divergence. This positive MACD indicates that the bullish momentum is strong. 
RSI Analysis:
The RSI stands at 74.43, which is above the threshold of 70. This suggests that the stock is in the overbought territory, indicating potential for a price correction or consolidation in the near term. 
Stock Performance for NASDAQ Composite (US) on January 30, 2025:
The NASDAQ Composite Index opened at 19695.68, reached a high of 19699.82, and dropped to a low of 19479.51, before closing at 19632.32. The previous close was 19733.59, indicating a decrease of 0.51%, equivalent to a points change of -101.27. The volume for the day was 6,497,710,000.


Relationship with Key Moving Averages:
The 10-EMA (19659.89) is above the 20-EMA (19616.26), indicating a short-term bullish trend. However, both are above the 50-EMA (19408.70) and significantly above the 200-EMA (18038.99), signaling a prevailing long-term upward movement in the index. This configuration supports a bullish trend, as the higher short-term EMAs display strength and momentum, suggesting continued upward movement unless a reversal occurs.
Moving Averages (MACD) Trend:
The MACD value of 59.85, positioned above the MACD Signal of 51.23, suggests positive momentum, with potential for continued upward movement if this trend persists. When the MACD is above the signal line, it typically indicates a bullish trend, suggesting potential opportunities for gains.

Relative Strength Index (RSI):
The RSI is at 50.86, which is near the neutral level of 50. This indicates that the stock is neither overbought nor oversold, suggesting stability. A value around 50 often implies that the stock may continue to follow the prevailing trend or enter a period of consolidation before the next significant move.

Stock Performance for NIKKEI 225 (Japan) on January 30, 2025:
Nikkei 225 opened at 39,302.85, reached a high of 39,600.93, and a low of 39,221.36. It closed at 39,513.97, up by 0.25% from the previous close of 39,414.78, gaining 99.18 points. The volume recorded was minimal, indicating limited trading activity for the day. Here is the detailed stock table for the day's movement:


Relationship with Key Moving Averages:
Nikkei 225's bullish trend is supported by its trading levels relative to moving averages. The current price of 39,513.97 is above the 10-EMA (39,380.46), 20-EMA (39,315.51), and 50-EMA (39,135.76), indicating positive short-term momentum. However, it is significantly above the 200-EMA (38,212.83), showing strong long-term bullish sentiments.
Moving Averages Trend (MACD):
The MACD value stands at 80.69 with a signal line at 59.23, signifying a bullish cross as the MACD is above the signal line, suggesting continued positive momentum. This is supportive of the uptrend witnessed in the current trading session.

RSI Analysis:
With an RSI value of 52.87, the stock is in the neutral zone, indicating that it is neither overbought nor oversold. This neutral RSI suggests a balanced market sentiment without extreme pricing action in either direction, allowing room for further upward movement if supported by other indicators.

Stock Performance for NIFTY BANK on January 30, 2025
The Nifty Bank opened at 49,206.20, reached a high of 49,426.20, and a low of 49,031.80, before closing at 49,311.95. This marks a percentage change of 0.30% with a positive points change of 146 from the previous close of 49,165.95. The volume was recorded at 0, indicating no trading volume data available for the day. The overall momentum shows slight positive gains for the day.


Relationship with Key Moving Averages
The current close of Nifty Bank at 49,311.95 is below its 50-EMA of 50,298.87 and the 200-EMA of 50,231.19, indicating a potential bearish trend. However, it is above the 10-EMA of 48,915.16 and close to the 20-EMA of 49,298.95, suggesting some short-term bullish momentum. This mixed scenario reflects uncertain market sentiment towards the stock.
RSI (Relative Strength Index) Analysis
The RSI stands at 47.35, which is below the neutral level of 50. This indicates a slight leaning towards bearish sentiment as it is closer to the oversold threshold of 30 than to the overbought level of 70. The RSI suggests that there is potential room for an upward correction in price.

MACD (Moving Average Convergence Divergence) Trend
The MACD is currently at -598.71 while the MACD Signal is at -736.79. The less negative MACD compared to the signal line suggests a potential bullish crossover. However, the overall negative values indicate bearish momentum, highlighting a possible market reversal if positive momentum persists.

Stock Performance for NIFTY 50 on January 30, 2025:
The stock symbol NIFTY 50 opened at 23169.5, reached a high of 23322.05, and a low of 23139.2 before closing at 23249.5. The previous close was at 23163.1, marking a 0.37% increase and a points gain of 86.40. The volume for the day is not available.


Relationship with Key Moving Averages:
The NIFTY 50 has a current close below its 50-EMA of 23687.06 and 200-EMA of 23625.06, suggesting a bearish outlook as the stock remains under these trend indicators. However, it is above its 10-EMA of 23154.92 and below the 20-EMA of 23305.42, indicating short-term strength but medium-term resistance. This setup suggests that while there could be minor bullish sentiment, overall the trend is currently bearish.
RSI Analysis:
The Relative Strength Index (RSI) for NIFTY 50 stands at 45.88, which implies that it is neither overbought nor oversold. This neutral RSI indicates potential indecision in the market, with no immediate hints of extreme bullish or bearish pressure.

MACD Analysis:
The MACD for NIFTY 50 is -216.00, with a signal line of -236.24. This suggests that the MACD is currently above the signal line, indicating a possible weak bullish crossover. However, since both are negative, it signals a generally bearish momentum prevailing, reaffirming the weak trend strength.

Up Next
Global stock market indices: How the world markets performed today - 30 January 2025

Indian stock market sector-wise performance today - March 03, 2025

Top 5 Nifty 50 gainers today – March 03, 2025: Biggest stock moves

NSE Nifty 50: Top 5 stock losers of March 03, 2025

Bloodbath on D-Street: Sensex, Nifty tank nearly 2 pc on global rout after Trump's tariff threats

NSE Nifty 50: Top 5 stock losers of February 28, 2025

More videos

Top 5 Nifty 50 gainers today – February 28, 2025: Biggest stock moves

Indian stock market sector-wise performance today - February 28, 2025

Global stock market indices: How the world markets performed today - 28 February 2025

Global stock market indices: How the world markets performed today - 27 February 2025

Indian stock market sector-wise performance today - February 27, 2025

Sensex bounces back after 5-day slump; Nifty ends marginally lower

LIC faces Rs 57.2 Crore tax demand over excess ITC

Maruti Suzuki aims to double production and boost exports by 2030

Global stock market indices: How the world markets performed today - 18 February 2025

Indian stock market sector-wise performance today - February 18, 2025