


Highlights
- Most major global indices showed a positive bias
- Overall market trend signals were primarily bullish
- Robust start to the trading year
Latest news

FC Goa face Mohammedan after securing second place

SUV incident in Mannheim: Multiple injuries as crowd hit by high-speed vehicle

KKR Announces Leadership Changes: Rahane as Captain, Iyer as Vice-Captain for IPL 2025

Chief Minister Yogi Adityanath on managing Maha Kumbh stampede

Mayawati expels nephew Akash Anand amid party discord

Samsung Galaxy A56, A36, A26 Launched – India Pricing Revealed with Introductory Offers!

Salman Khan and Rashmika Mandanna ignite screen in 'Zohra Jabeen' teaser

Execution of Indian woman in UAE sparks legal concerns
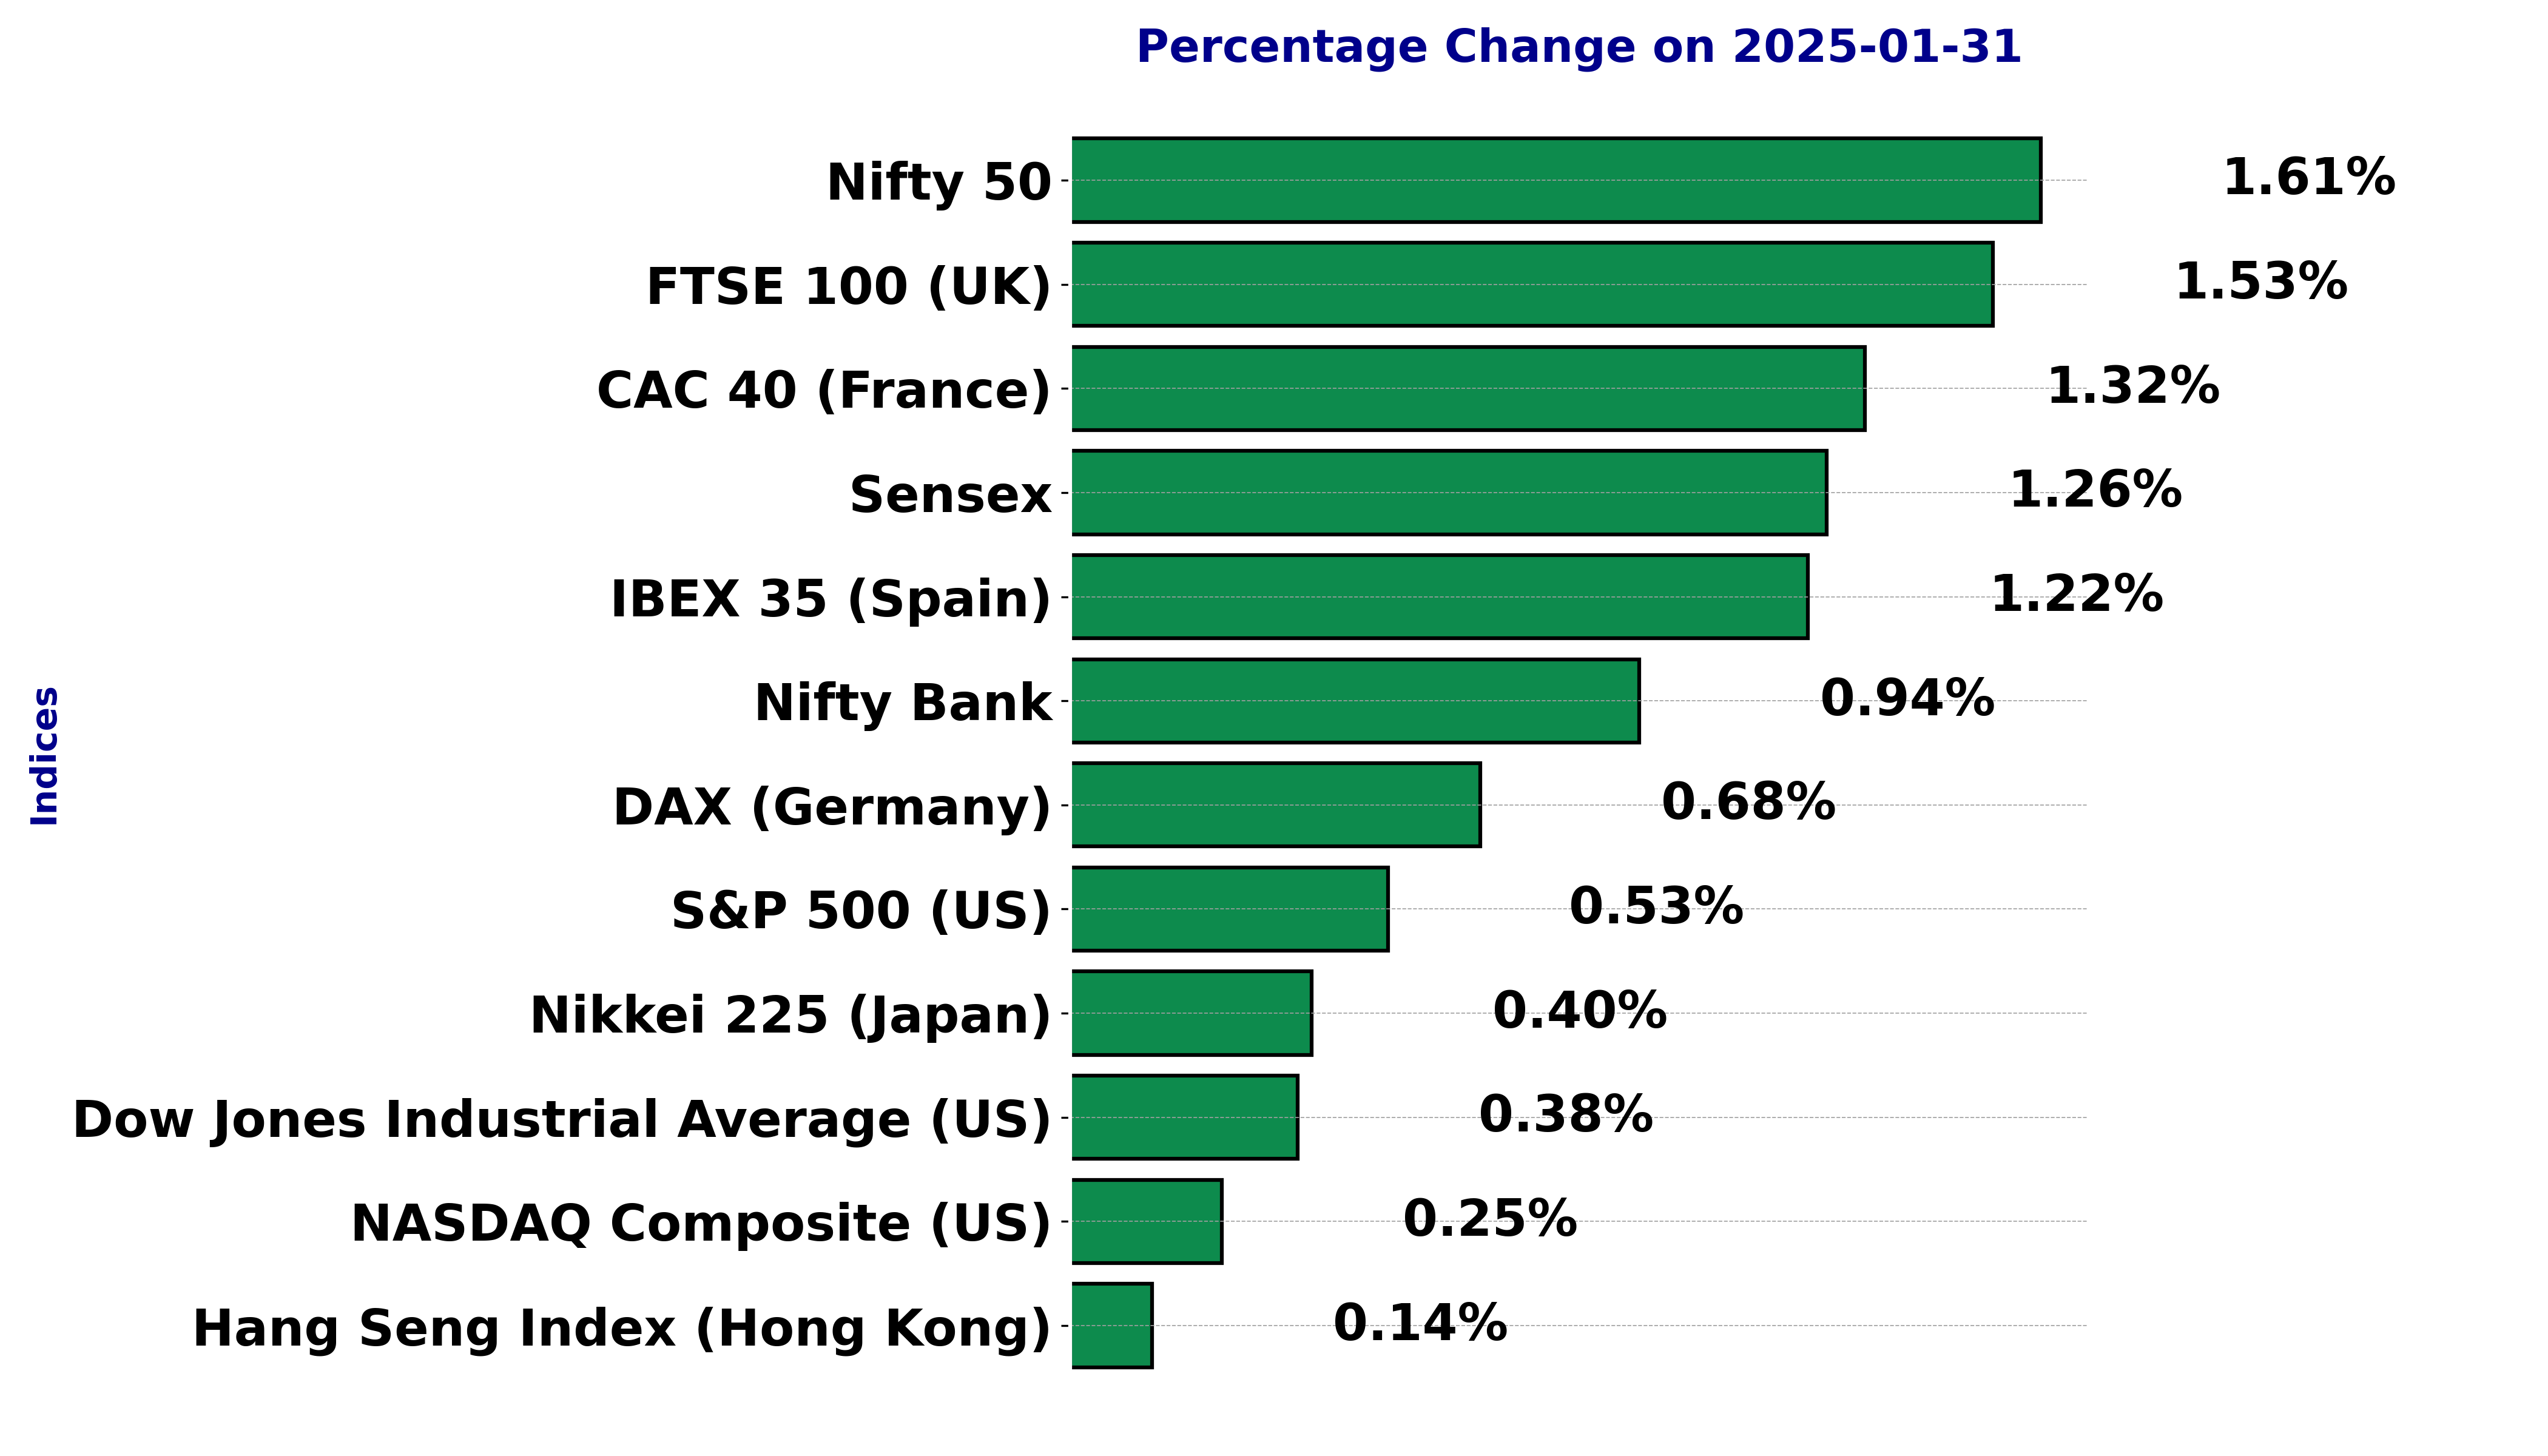
Global stock market indices: How the world markets performed today - 31 January 2025


The international stock market indices showed varied performances on January 31, 2025, reflecting the economic sentiment across different regions.
In this article, we analyze the performance of key global indices including the S&P 500, Dow Jones Industrial Average, NASDAQ Composite, FTSE 100, DAX, CAC 40, IBEX 35, Nikkei 225, Hang Seng, Nifty 50, and BSE Sensex.
Indices Performance for Sensex on January 31, 2025
The Sensex closed at 77,493.49, up from its previous close of 76,532.96, indicating a positive change of 1.26%, with a points change of 960.53. Despite no volume on the record, this performance reflects a strong upward momentum for the day.


Relationship with Key Moving Averages
The Sensex is currently below the 50-EMA (78,210.01) and the 200-EMA (77,842.61), which often indicates a bearish trend. However, moving above the 10-EMA (76,587.38) and the 20-EMA (77,029.46) could suggest some short-term bullish momentum gaining strength.
Moving Averages Trend (MACD)
The MACD is at -666.90 with a Signal Line at -787.60, showing a subtle bullish convergence as the MACD is inching closer to the signal line, suggesting potential bullish reversal signals.

Relative Strength Index (RSI)
The RSI stands at 50.88, often indicating neutral conditions. This suggests that the market is neither overbought nor oversold, aligning with the balanced tension between bulls and bears at the moment.

Indices Performance for the Dow Jones Industrial Average (US) - January 31, 2025
On January 31, 2025, the Dow Jones Industrial Average (^DJI) had an opening value of 44,548.70, a high of 45,008.75, a low of 44,548.69, and closed at 44,882.13. Compared to the previous close of 44,713.52, it showed a points change of 168.61, resulting in a percentage change of 0.38%. The trading volume on this day was 714,088,502. 

Relationship with Key Moving Averages
The Dow Jones Industrial Average is currently trading above its 10-day EMA (44,299.90), 20-day EMA (43,862.40), 50-day EMA (43,478.18), and 200-day EMA (41,504.71). This indicates a bullish trend, as the current closing price is higher than all of the key moving averages. The fact that shorter-term EMAs are above longer-term EMAs further supports a bullish outlook.
Moving Averages Trend (MACD)
The MACD is valued at 432.01, with a signal line at 210.42. The positive value of the MACD, along with it being above the signal line, suggests a strong upward trend. This further corroborates the bullish trend indicated by the moving averages. 
RSI Analysis
The Relative Strength Index (RSI) is at 67.22, which is close to the overbought territory. This indicates that while the stock is showing definite strength, there could be potential for a pullback if it crosses into overbought levels above 70. 
CAC 40 (France) - Indices Performance on January 31, 2025
Open: 7954.43
High: 7986.37
Low: 7950.62
Close: 7976.24
Previous Close: 7872.48
% Change: 1.32%
Points Change: 103.76
Volume: 0.0

The CAC 40 index is currently trading above its key moving averages: 10-EMA (7832.28), 20-EMA (7706.43), 50-EMA (7548.28), and 200-EMA (7526.95). This positions the index in a bullish trend, as the short-term average is above the long-term averages, indicating upward momentum. Maintaining values above these EMAs typically supports the notion of continued bullishness in the market.
RSI Analysis:
The RSI value is currently at 75.38, which suggests that the CAC 40 is in overbought territory. This may indicate a potential for a pullback, as the high RSI implies strong recent gains. 
MACD Analysis:
The MACD is at 148.48, with the MACD Signal at 120.68. The MACD line being higher than the signal line further affirms the bullish trend seen in the CAC 40 index. This crossing into positive territory reinforces potential strength continuation, but traders should be cautious of any reversals given the high RSI. 
FTSE 100 (UK) Indices Performance - January 31, 2025:
The FTSE 100 index opened at 8646.88 and had a high of 8692.83 and a low of 8646.88. It closed the day at 8688.79, compared to a previous close of 8557.80, showing a significant change of +1.53% or +130.99 points.


Relationship with Key Moving Averages:
The FTSE 100's close of 8688.79 positions it above the 10-EMA (8526.49), 20-EMA (8442.40), 50-EMA (8337.94), and 200-EMA (8184.50). This indicates a bullish trend as the index is trading well above these key moving averages, suggesting strong upward momentum.
Moving Averages Trend [MACD]:
The MACD value is 97.27, which is above the MACD Signal line of 75.39. This is a bullish indicator, suggesting that the upward momentum is strong and likely to continue.

Relative Strength Index (RSI):
The RSI is currently at 74.74, which is above the 70 threshold, indicating that the FTSE might be overbought. Although this suggests caution, it also highlights strong buying interest in the index.

DAX (Germany) Index Performance on January 31, 2025:
The DAX opened at 21,771.49, reached a high of 21,799.80, a low of 21,724.03, and closed at 21,784.64. There was a % change of 0.68% from the previous close at 21,637.53.


Relationship with Key Moving Averages:
The DAX is trading above its 10-EMA (21,300.36), 20-EMA (20,952.32), 50-EMA (20,372.27), and 200-EMA (19,086.11). This positive alignment of the shorter-term EMAs above the longer-term EMAs indicates a strong bullish trend, signaling upward momentum in the market.
Moving Averages Trend (MACD) and RSI:
The MACD is at 417.20, above the signal line at 334.78, which suggests bullish momentum as long as the MACD line remains above the signal line. This indicates investor confidence in a continued upward trend.

The RSI at 80.18 indicates that the DAX is currently in overbought territory, suggesting a possible pullback or a need for a correction in the near term. However, during strong trends, overbought conditions can persist for an extended period.

Indices Performance for the S&P 500 (US) - January 31, 2025:

On January 31, 2025, the S&P 500 opened at 6050.75, reached a high of 6086.64, and closed at 6071.17. The previous close was 6039.31, resulting in a points change of 31.86 and a percentage change of 0.53%. The trading volume for the day was 3,068,265,000.

Key Moving Averages and Trend:
The S&P 500's current price of 6071.17 is above the 10-EMA (6036.22), 20-EMA (6007.08), 50-EMA (5962.22), and significantly above the 200-EMA (5634.22). This positioning above the key moving averages suggests a bullish trend, as the price is leading all these averages, indicating upward momentum in the short to medium term.
Moving Averages Trend (MACD):
The MACD value of 30.75 is above its signal line (18.27), suggesting a bullish momentum. A positive MACD indicates that the short-term momentum is more robust than the long-term average and could lead to further price increases.

Relative Strength Index (RSI):
The RSI is at 56.81, suggesting a neutral to slightly bullish sentiment. An RSI value between 50 and 70 typically indicates that the asset is neither overbought nor oversold, supporting the continuation of the current price trend, which in this case leans bullish.

Hang Seng Index (Hong Kong) Performance on January 31, 2025:
The Hang Seng Index opened at 20,337.46, reached a high of 20,337.46, a low of 20,165.73, and closed at 20,225.11. The index shows a slight upward movement from the previous close of 20,197.77, with a percentage change of 0.135% and a points change of 27.34.

Relationship with Key Moving Averages:
The Hang Seng Index is currently above the 10-EMA (19,890.25), 20-EMA (19,778.42), 50-EMA (19,746.30), and 200-EMA (18,979.51). This suggests a bullish trend in the short to medium term. The alignment of EMAs supports the upward momentum, with the index's price above all key moving averages indicating potential further strength.
Moving Averages Trend (MACD):
The MACD value is 86.23, with a MACD signal line of -12.97. The positive MACD value suggests a strong upward momentum, which might indicate a continuing bullish trend. The gap between the MACD line and the signal line further strengthens this bullish sentiment.
RSI Analysis:
The RSI value is 59.85, which is in the neutral to slightly bullish territory. Generally, an RSI above 50 is considered bullish, and the current RSI level supports the upward trend narrative of the Hang Seng Index. This suggests that the market is not overbought and may have room for further upward movement.
IBEX 35 (Spain) Performance for January 31, 2025:

The IBEX 35 index closed at 12,436.90, with an increase of 150.40 points from the previous close of 12,286.50. This represents a percentage change of 1.22%. The day's high was 12,465.40, and the low was 12,425.60, with a total trading volume of 22,825,532 shares.

When analyzing the relationship of IBEX 35 with key moving averages:
- The index is currently trading above all major moving averages: the 10-EMA (12,093.95), 20-EMA (11,964.39), 50-EMA (11,821.67), and 200-EMA (11,362.95). This positioning indicates a strong bullish trend as the price action maintains above these moving averages, showcasing momentum and potential continued upward movements.
RSI (Relative Strength Index):
The RSI for IBEX 35 stands at 75.91, which is above the typical overbought threshold of 70. This suggests that the index may be in overbought territory, indicating a potential pullback or correction in the near term. Caution is advised, as such levels often precede a price retracement.

MACD (Moving Average Convergence Divergence):
The MACD value is currently at 139.55, compared to a MACD Signal of 85.78. The positive difference between the MACD and its signal line indicates bullish momentum, as the increase in the MACD histogram suggests growing buying pressure. The continuation of this trend could lead to further price increases if sustained.

Indices Performance for NASDAQ Composite (US) - January 31, 2025
The NASDAQ Composite index opened at 19,697.5, reached a high of 19,785.79, and a low of 19,483.83, closing at 19,681.75. This indicated a slight increase from the previous close of 19,632.32, resulting in a percentage change of 0.25% with a points change of 49.43. The trading volume for the day was 6,109,423,000.


Relationship with Key Moving Averages
The NASDAQ Composite index is currently above the 50-EMA (19,419.41) and the 20-EMA (19,622.5), indicating a bullish short-term trend as it remains near the 10-EMA (19,663.86). However, it is significantly above the 200-EMA (18,055.42), suggesting a strong long-term bullish trend.
Moving Averages Trend - MACD
The MACD value is 58.03, above its signal line (MACD_Signal) of 52.59, suggesting potential bullish momentum. It indicates continuation of an uptrend if supported by higher trading volumes.

RSI Analysis
The RSI stands at 51.70, indicating a neutral momentum neither oversold nor overbought. This suggests that the market might consolidate or prepare for further movement in either direction, depending on upcoming market conditions.

Nikkei 225 (Japan) Indices Performance on January 31, 2025:

The Nikkei 225 index closed at 39,572.49, opening at 39,574.38, with a high of 39,681.82 and a low of 39,458.95. The index experienced a 0.40% increase, rising by 157.71 points from the previous close of 39,414.78.

Relationship with Key Moving Averages:
The Nikkei 225 is trading above its 10-EMA (39,391.10), 20-EMA (39,321.08), 50-EMA (39,138.05), and significantly higher than the 200-EMA (38,213.55). This indicates a bullish trend, with the index showing strength and a potential for continuous upward movement. The position above key moving averages confirms strong support and momentum in the current uptrend.
Technical Indicators:
RSI: The Relative Strength Index (RSI) is at 53.49, suggesting that the index is neither overbought nor oversold. The RSI hovering around the mid-level indicates a stable price movement, with room for further upward momentum if the buying interest increases.

MACD: The MACD is at 85.36, while the MACD Signal is at 60.17. The MACD line being well above the signal line suggests a prevailing bullish momentum. This divergence between the MACD and its signal line supports the continuation of the current upward trend in the Nikkei 225 index.

Indices Performance for Nifty Bank on January 31, 2025
The Nifty Bank index had a positive day, opening at 49,259.65, reaching a high of 49,674.80, and closing at 49,630.00. This reflects a percentage change of 0.94% compared to the previous close. The index gained 464.05 points, indicating a positive sentiment in the market.


Relationship with Key Moving Averages
The Nifty Bank's current price is below the 50-EMA (50,311.34) and the 200-EMA (50,234.54), indicating a potential bearish trend. However, it remains above the 10-EMA (48,972.98) and the 20-EMA (49,329.24), suggesting short-term bullish momentum.
Trend Analysis Using MACD
The MACD value is -573.33, with a MACD Signal of -731.72. The MACD line being above the Signal line could imply a bullish crossover, signaling potential upward momentum in the market. This suggests a cautious bullish outlook given the negative MACD values.

RSI Analysis
The RSI is at 50.01, which is in the neutral zone. This suggests that the market is neither overbought nor oversold, indicating a balanced sentiment. Traders might look for a breakout from this level to determine future market direction.

Indices Performance for the Nifty 50 on January 31, 2025
On January 31, 2025, the Nifty 50 opened at 23,296.75, with a high of 23,542.70 and a low of 23,277.40, closing at 23,535.95. This reflected a percentage change of 1.61% and a points change of 372.85 from the previous close of 23,163.10. The volume traded was 0.0.


Relationship with Key Moving Averages
The Nifty 50's current closing price of 23,535.95 is slightly below the 50-day EMA of 23,698.29 and the 200-day EMA of 23,627.99, indicating a resistance at these levels. However, it is above the 10-day EMA of 23,207.00 and the 20-day EMA of 23,332.70. This relationship suggests that while the short-term trend is attempting a bullish breakout, the longer-term trend remains under pressure from these resistance levels.
Moving Averages Trend (MACD)
The MACD of -193.15, compared to the MACD signal of -231.67, indicates a bullish divergence, suggesting that the momentum is attempting to shift upwards. The MACD being less negative than the signal line implies potential for upward movement.

Relative Strength Index (RSI)
The RSI for the Nifty 50 is at 52.32, which positions the index in the neutral zone. This indicates that the index is neither overbought nor oversold, reflecting a balanced state with minor leaning towards bullish sentiment.

Up Next
Global stock market indices: How the world markets performed today - 31 January 2025

Indian stock market sector-wise performance today - March 03, 2025

Top 5 Nifty 50 gainers today – March 03, 2025: Biggest stock moves

NSE Nifty 50: Top 5 stock losers of March 03, 2025

Bloodbath on D-Street: Sensex, Nifty tank nearly 2 pc on global rout after Trump's tariff threats

NSE Nifty 50: Top 5 stock losers of February 28, 2025

More videos

Top 5 Nifty 50 gainers today – February 28, 2025: Biggest stock moves

Indian stock market sector-wise performance today - February 28, 2025

Global stock market indices: How the world markets performed today - 28 February 2025

Global stock market indices: How the world markets performed today - 27 February 2025

Indian stock market sector-wise performance today - February 27, 2025

Sensex bounces back after 5-day slump; Nifty ends marginally lower

LIC faces Rs 57.2 Crore tax demand over excess ITC

Maruti Suzuki aims to double production and boost exports by 2030

Global stock market indices: How the world markets performed today - 18 February 2025

Indian stock market sector-wise performance today - February 18, 2025