


Highlights
- DAX shows short-term gains but long-term bearish
- Dow Jones remains below key moving averages, bearish
- Nifty 50 gains but faces strong resistance levels
Latest news

Ashes 2025: Travis Head slams unbeaten 142 to crush England's Ashes hopes

Tipra Motha youth wing protests Bangladesh leader's anti-India remarks in Agartala

Bangladesh interim government condemns violence amid nationwide unrest

AAP holds review meeting in Navsari ahead of municipal corporation elections

Parliament concludes productive winter session; Rajya Sabha 121%, Lok Sabha 111%

AAP holds protest in Ahmedabad’s Naroda after demolition of houses, alleges lack of rehabilitation

AAP claims major win in Punjab local body polls; Gujarat unit sees momentum ahead of state elections

US Democrats release Epstein photos showing Bill Gates, Noam Chomsky
Global stock market indices: How the world markets performed today - 18 March 2025


The international stock market indices showed varied performances on March 18, 2025, reflecting the economic sentiment across different regions.
In this article, we analyze the performance of key global indices including the S&P 500, Dow Jones Industrial Average, NASDAQ Composite, FTSE 100, DAX, CAC 40, IBEX 35, Nikkei 225, Hang Seng, Nifty 50, and BSE Sensex.

Analysis for Sensex - March 18, 2025

The BSESN opened at 74,608.66 and closed at 75,301.26, showing a positive change of 1.53%, reflecting a points change of 1131.30. The current RSI is 53.24, indicating neutral momentum, while MACD at -557.43 suggests a bearish trend.

Relationship with Key Moving Averages
The Sensex closed at 75,301.26, which is below its 50-day EMA of 75,924.99 and 200-day EMA of 77,175.95, indicating a bearish sentiment in the longer term. However, it is above the 10-day EMA of 74,340.95 and 20-day EMA of 74,665.80, suggesting short-term upward momentum.
Moving Averages Trend (MACD)
The MACD for Sensex is -557.43, with a MACD Signal of -738.68, indicating a potential upward momentum as the MACD is above the signal line. The crossover shows a bullish signal, suggesting a possible trend reversal or strengthening in market sentiment.

RSI Analysis
The RSI for Sensex is 53.24, which suggests that the market is in a neutral zone and is neither overbought nor oversold. A typical RSI range from 30 to 70 is considered neutral, so this value indicates balanced market momentum.

Analysis for Dow Jones Industrial Average (US) - March 18, 2025

The Dow Jones Industrial Average opened at 41,460.22, reaching a high of 42,013.10 and closing at 41,841.63, marking a 0.85% increase from the previous close of 41,488.19. The index saw a points change of +353.44 with a volume of 564.19 million. Technical indicators show an RSI of 40.03, suggesting a decrease in momentum, while MACD values indicate a bearish trend with the MACD line below the signal line.

Relationship with Key Moving Averages
The Dow Jones Industrial Average is trading below its key moving averages, with its close value of 41841.63 being under the 50-day EMA of 43187.55, the 200-day EMA of 42004.55, and the 10-day EMA of 41984.47. This suggests a bearish trend in the short to mid-term, further evidenced by a negative MACD value.
Moving Averages Trend (MACD)
The Dow Jones Industrial Average shows a bearish signal as the MACD of -686.00 is below the MACD Signal line of -520.21, indicating potential downward momentum. With the RSI at 40.03, the index is approaching oversold territory, which may prompt some caution.

RSI Analysis
RSI Analysis for Dow Jones Industrial Average (US): The RSI value of 40.03 suggests that the Dow Jones Industrial Average is approaching the oversold territory. This indicates potential buying opportunities if the trend continues, though further analysis and context are necessary before making investment decisions.

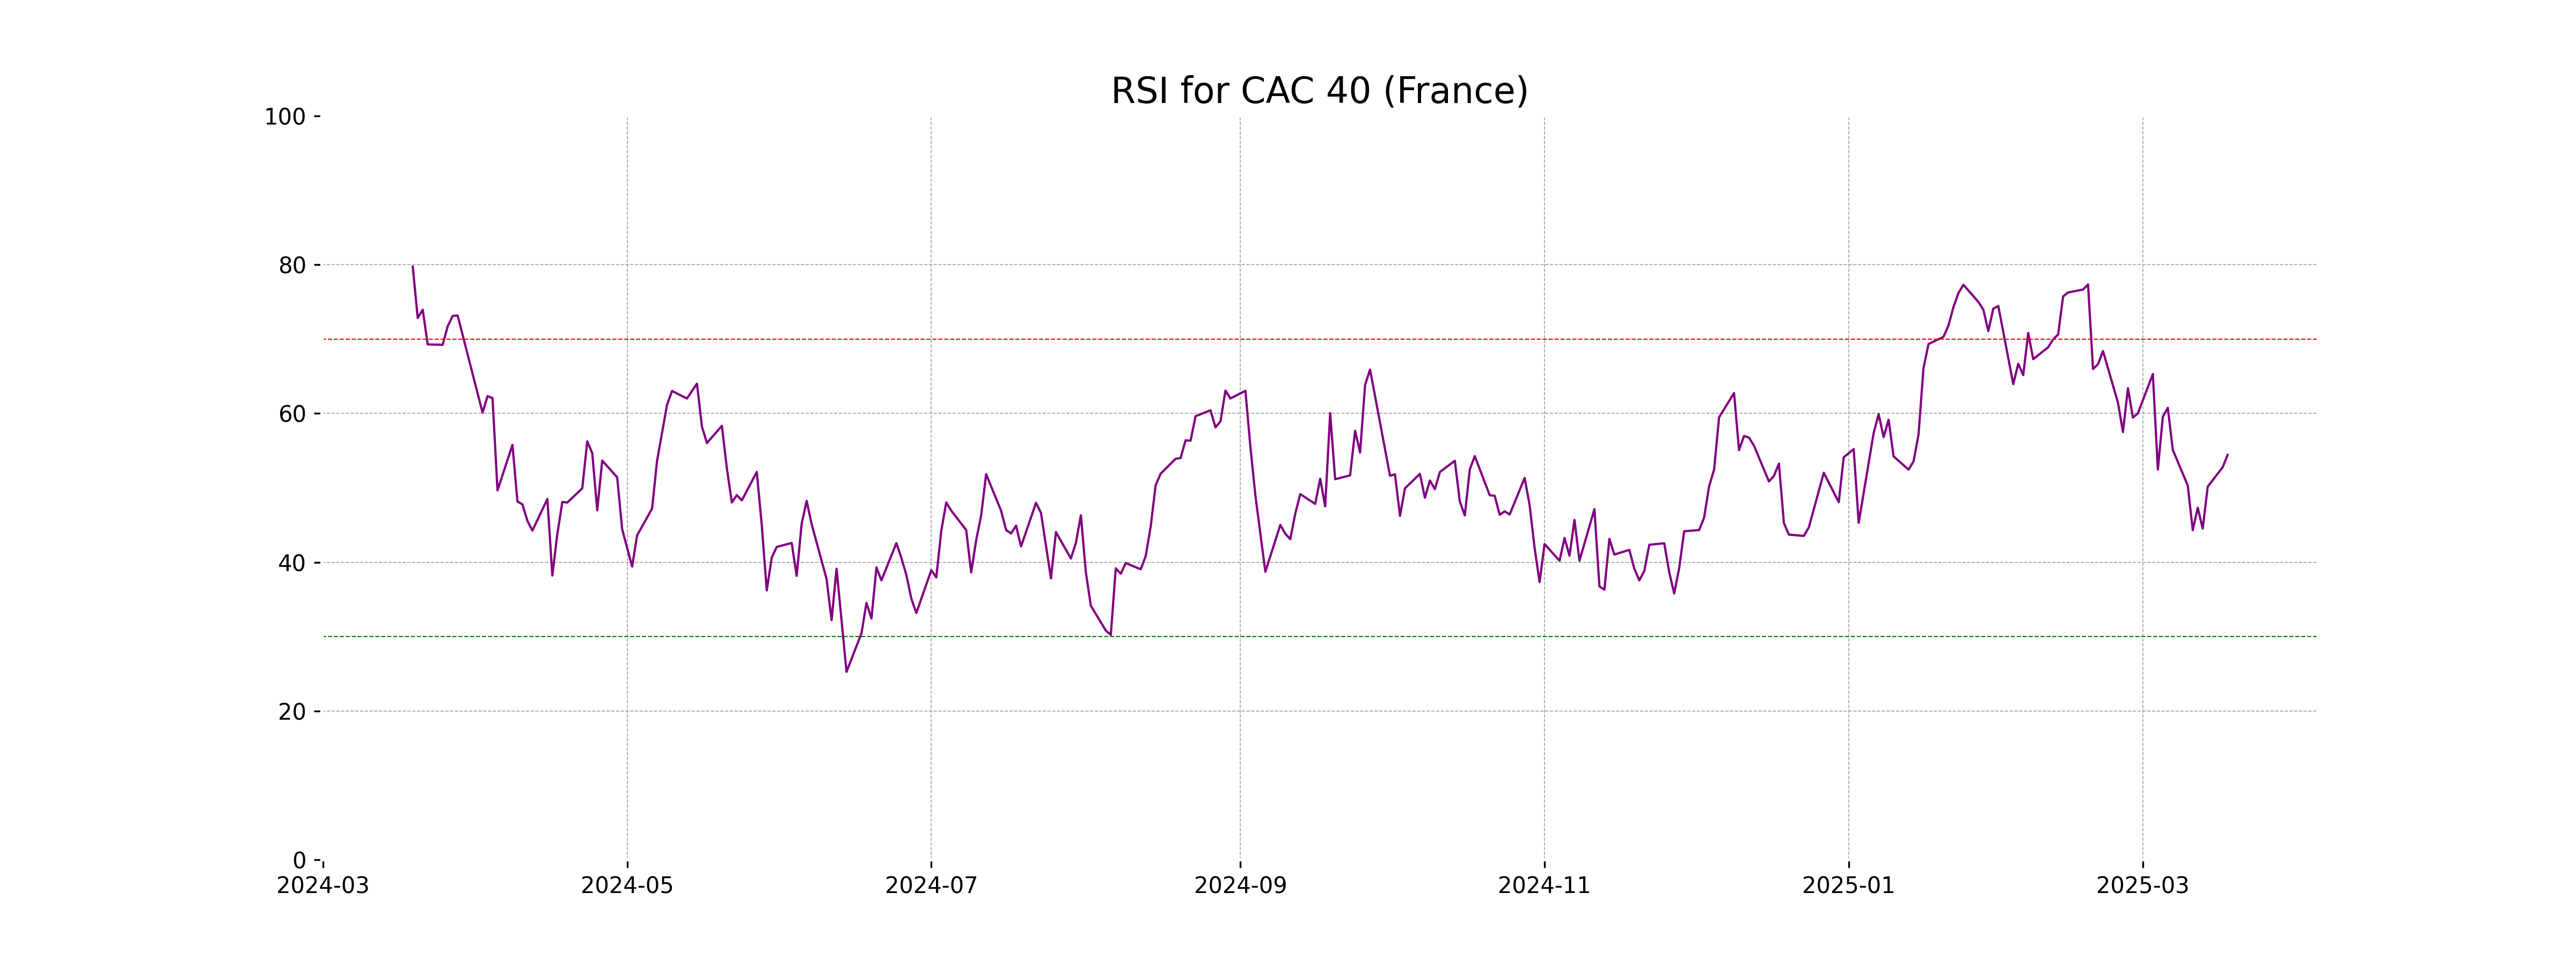
Analysis for CAC 40 (France) - March 18, 2025

CAC 40 (France) Performance: The CAC 40 index opened at 8100.89 and closed at 8103.38, marking a percentage change of 0.36% and a points increase of 29.40 from the previous close of 8073.98. The index exhibited an RSI of 54.43, suggesting moderate strength, with the MACD line below the signal line indicating potential bearish momentum.

Relationship with Key Moving Averages
The CAC 40 index is trading above its 50-day EMA (7931.50) and 200-day EMA (7679.09), indicating an overall bullish trend. However, it is slightly above its 10-day EMA (8057.31) and 20-day EMA (8055.70), suggesting recent upward momentum.
Moving Averages Trend (MACD)
The MACD for CAC 40 (France) is currently at 21.68, which is below the MACD Signal line of 40.86. This indicates a potential bearish momentum. Investors should watch for potential trend reversals or confirmations with further market movements.

RSI Analysis
Given the RSI value of 54.43 for the CAC 40, the index is in a neutral zone, indicating it's not currently overbought or oversold. This suggests a balanced momentum without immediate signals of significant price reversals.
Analysis for FTSE 100 (UK) - March 18, 2025

FTSE 100 opened at 8680.29 and closed at 8711.67, marking a positive change of 31.37 points or 0.36%. The high during this session was 8726.95, with no trading volume data provided. The index is above key moving averages, with a 50-day EMA at 8591.72 and a 200-day EMA at 8327.06, indicating an upward trend. The RSI of 55.00 suggests moderate momentum.

Relationship with Key Moving Averages
The FTSE 100 is trading above its 50 EMA and 200 EMA, indicating a bullish trend. The index is also positioned above its 10 EMA and 20 EMA, suggesting continued upward momentum in the short term.
Moving Averages Trend (MACD)
The MACD value for FTSE 100 (UK) is 0.7255, which is below the MACD Signal line at 12.4234. This suggests a bearish signal, indicating potential weakness in momentum. However, the close price shows a positive change compared to the previous close.

RSI Analysis
RSI Analysis for FTSE 100 (UK): The Relative Strength Index (RSI) of 55.00 for the FTSE 100 indicates a moderate momentum in the market, suggesting that the index is neither overbought nor oversold. It lies in the neutral range, typically encouraging investors to watch for potential trends before making investment decisions.

Analysis for DAX (Germany) - March 18, 2025

The DAX (Germany) opened at 23,266.65 and closed at 23,417.66, showing a positive change of 1.14% with a point increase of 263.09. The RSI indicates moderate strength at 61.86, and the MACD slightly below the signal, suggesting potential consolidation.

Relationship with Key Moving Averages
The DAX (Germany) is above its 50-day EMA of 22,013.71 and 200-day EMA of 20,048.38, indicating a potential upward trend or bullish sentiment. Its current price is slightly above the 10-day EMA of 22,919.39 and 20-day EMA of 22,709.43, suggesting short-term bullish momentum.
Moving Averages Trend (MACD)
The MACD for DAX (Germany) is currently at 307.34, slightly below the MACD Signal of 312.50, indicating a potential weakening in the bullish momentum. This suggests that a trend reversal or a short-term correction might occur if the MACD fails to cross above the signal line.

RSI Analysis
The current RSI for DAX (Germany) is 61.86, indicating a neutral to slightly bullish momentum. Generally, an RSI above 70 is considered overbought, whereas below 30 is oversold. With the RSI slightly below 70, the market isn't showing strong overbought conditions but indicates potential bullishness.

Analysis for S&P 500 (US) - March 18, 2025

S&P 500 (US) experienced a positive trading session, opening at 5635.60 and closing higher at 5675.12, marking a 0.64% increase with a gain of 36.18 points. Despite the positive close, the index is trading below key moving averages with a subdued RSI of 40.36, indicating potential underlying weakness. The MACD value of -110.42 also suggests bearish momentum compared to its Signal line of -88.34.

Relationship with Key Moving Averages
The S&P 500's closing price of 5675.12 is below its 50-day EMA (5886.42) and its 200-day EMA (5705.80), indicating a bearish trend compared to these longer-term averages. However, it is above its 10-day EMA (5687.19), suggesting a slight recovery in the short term.
Moving Averages Trend (MACD)
The MACD for S&P 500 stands at -110.42, with a signal line of -88.34. This suggests a bearish momentum as the MACD is below the signal line, indicating potential downward pressure.

RSI Analysis
The current RSI value for the S&P 500 is 40.36, which indicates that the index is approaching the oversold territory. Generally, an RSI below 30 is considered oversold, suggesting that the S&P 500 might be nearing a buying opportunity if other indicators confirm.

Analysis for Hang Seng Index (Hong Kong) - March 18, 2025

Hang Seng Index opened at 24,679.35 and closed at 24,740.57, showing a percentage increase of approximately 2.46% with a points change of 595. Despite the lack of volume information, the index reflects a strong position with an RSI of 69.37, indicating a possible overbought condition. The MACD suggests a negative divergence as it is below the MACD Signal.

Relationship with Key Moving Averages
The Hang Seng Index is currently trading above its 10-day, 20-day, 50-day, and 200-day EMAs, indicating a bullish trend. The RSI is high at 69.37, suggesting the index is nearing overbought territory.
Moving Averages Trend (MACD)
The MACD for the Hang Seng Index (Hong Kong) is 682.996, which is slightly below the MACD Signal of 705.545, suggesting a potential bearish signal as the momentum may be weakening. However, given the RSI of 69.37, the index is approaching overbought levels, indicating strong recent performance.

RSI Analysis
The current RSI value for the Hang Seng Index is 69.37, indicating that it's approaching overbought territory (RSI > 70), which suggests potential resistance to further price increases. Investors might want to watch for signs of a trend reversal or potential pullbacks.

Analysis for IBEX 35 (Spain) - March 18, 2025

The IBEX 35 index in Spain opened at 13,175.90, reached a high of 13,283.90, and closed at 13,265.70, with a notable rise of 0.90% from the previous close. The index saw a points increase of 118.5, with a trading volume of 39,171,920. The RSI stands at 61.05, suggesting a potential bullish momentum, while the MACD is below the signal line.

Relationship with Key Moving Averages
The IBEX 35 (Spain) is trading above its key moving averages, with a current close of 13,265.70 that is higher than the 50-day EMA of 12,695.50 and the 200-day EMA of 11,815.45, indicating a potential bullish trend. Additionally, the close is also above the 10-day EMA of 13,078.39 and the 20-day EMA of 13,022.50.
Moving Averages Trend (MACD)
IBEX 35's MACD value is 112.81, which is below its MACD Signal value of 151.12, indicating potential bearish momentum. Investors might interpret this as a signal to watch for possible downward movement in the near-term.

RSI Analysis
Relative Strength Index (RSI) Analysis for IBEX 35 (Spain): The RSI value of 61.05 suggests that the index is in a bullish momentum but not yet in overbought territory, indicating room for potential upward movement while remaining cautionary for any changes.

Analysis for NASDAQ Composite (US) - March 18, 2025

NASDAQ Composite (US) Performance: The NASDAQ Composite opened at 17,722.54, reached a high of 17,925.94, and closed at 17,808.66. It experienced a percentage gain of 0.31% over the previous close, with a points change of 54.57. The volume traded was 6,306,340,000. The 50-day EMA is at 18,892.67, which is higher than the 10-day EMA of 17,914.55, indicating potential bearish momentum. The RSI is at 38.45, suggesting that the index is approaching oversold territory.

Relationship with Key Moving Averages
The NASDAQ Composite index is trading below its 10 EMA, 20 EMA, 50 EMA, and 200 EMA, indicating a bearish trend and potential downward momentum. The RSI value of 38.45 suggests the index is approaching an oversold condition, while the MACD value of -522.93 is also below the signal line, reinforcing the bearish sentiment.
Moving Averages Trend (MACD)
The NASDAQ Composite's MACD value of -522.93 indicates a bearish trend, as it is lower than its MACD Signal of -448.03. The negative MACD suggests potential downward pressure on the index in the short term.

RSI Analysis
Based on the stock data provided for NASDAQ Composite (US), the Relative Strength Index (RSI) is 38.45, indicating that the market is tending towards being oversold. This suggests potential buying opportunities as RSI values below 30 generally denote oversold conditions, while values above 70 indicate overbought levels.

Analysis for Nikkei 225 (Japan) - March 18, 2025

Nikkei 225 (Japan) closed at 37,845.42, marking a 1.20% increase from the previous close of 37,396.52, with a points change of 448.90. Although the day's high was 38,004.20 and the low was 37,822.87, the index volume was notably unavailable. The Relative Strength Index (RSI) is at 49.69, suggesting a neutral market condition, and the Moving Average Convergence Divergence (MACD) shows a divergence from its signal line, indicating potential volatility ahead.

Relationship with Key Moving Averages
The Nikkei 225 closed at 37845.42, below its 50 EMA of 38267.20 and 200 EMA of 38190.40, indicating potential short-term bearishness in contrast to its longer-term trends. However, it remains above the 10 EMA and 20 EMA, suggesting short-term upward momentum.
Moving Averages Trend (MACD)
The MACD value for Nikkei 225 is -438.53, while the MACD Signal is -485.47. Since the MACD is above the MACD Signal, it suggests that momentum might shift to bullish. However, given that both values are negative, caution is warranted, and investors should observe for confirmation of any trend reversal.

RSI Analysis
The RSI for Nikkei 225 is approximately 49.69, which suggests a neutral trend, as it is close to the midpoint of 50. This indicates that the index is neither overbought nor oversold at the moment.

Analysis for Nifty Bank - March 18, 2025

The Nifty Bank index opened at 48792.90 and closed higher at 49314.50, reflecting a positive change of 1.99% or 960.35 points from the previous close. The index's current level is above its 10-day and 20-day EMAs but below the 50-day and 200-day EMAs, indicating potential short-term strength but longer-term resistance. The RSI of 56.87 suggests a slightly positive momentum, while the negative MACD of -249.18 compared to the MACD Signal of -323.99 indicates bearish pressure may still be present.

Relationship with Key Moving Averages
The Nifty Bank index closed at 49,314.5, which is above its 50-day EMA of 49,247.88, indicating a recent upward trend. However, it remains below the 200-day EMA of 49,899.04, suggesting a longer-term downtrend. The 10 and 20 EMAs are also below the current close, reinforcing the short-term bullish trend.
Moving Averages Trend (MACD)
The MACD value for Nifty Bank is -249.18, which is above the MACD Signal line at -323.99, indicating a bullish crossover. This suggests potential upward momentum in the stock price, as the recent price movement outpaces its historical average.

RSI Analysis
The RSI (Relative Strength Index) for Nifty Bank is 56.87, suggesting a moderately strong position. This value indicates that the index is neither overbought nor oversold, situated in a neutral zone.

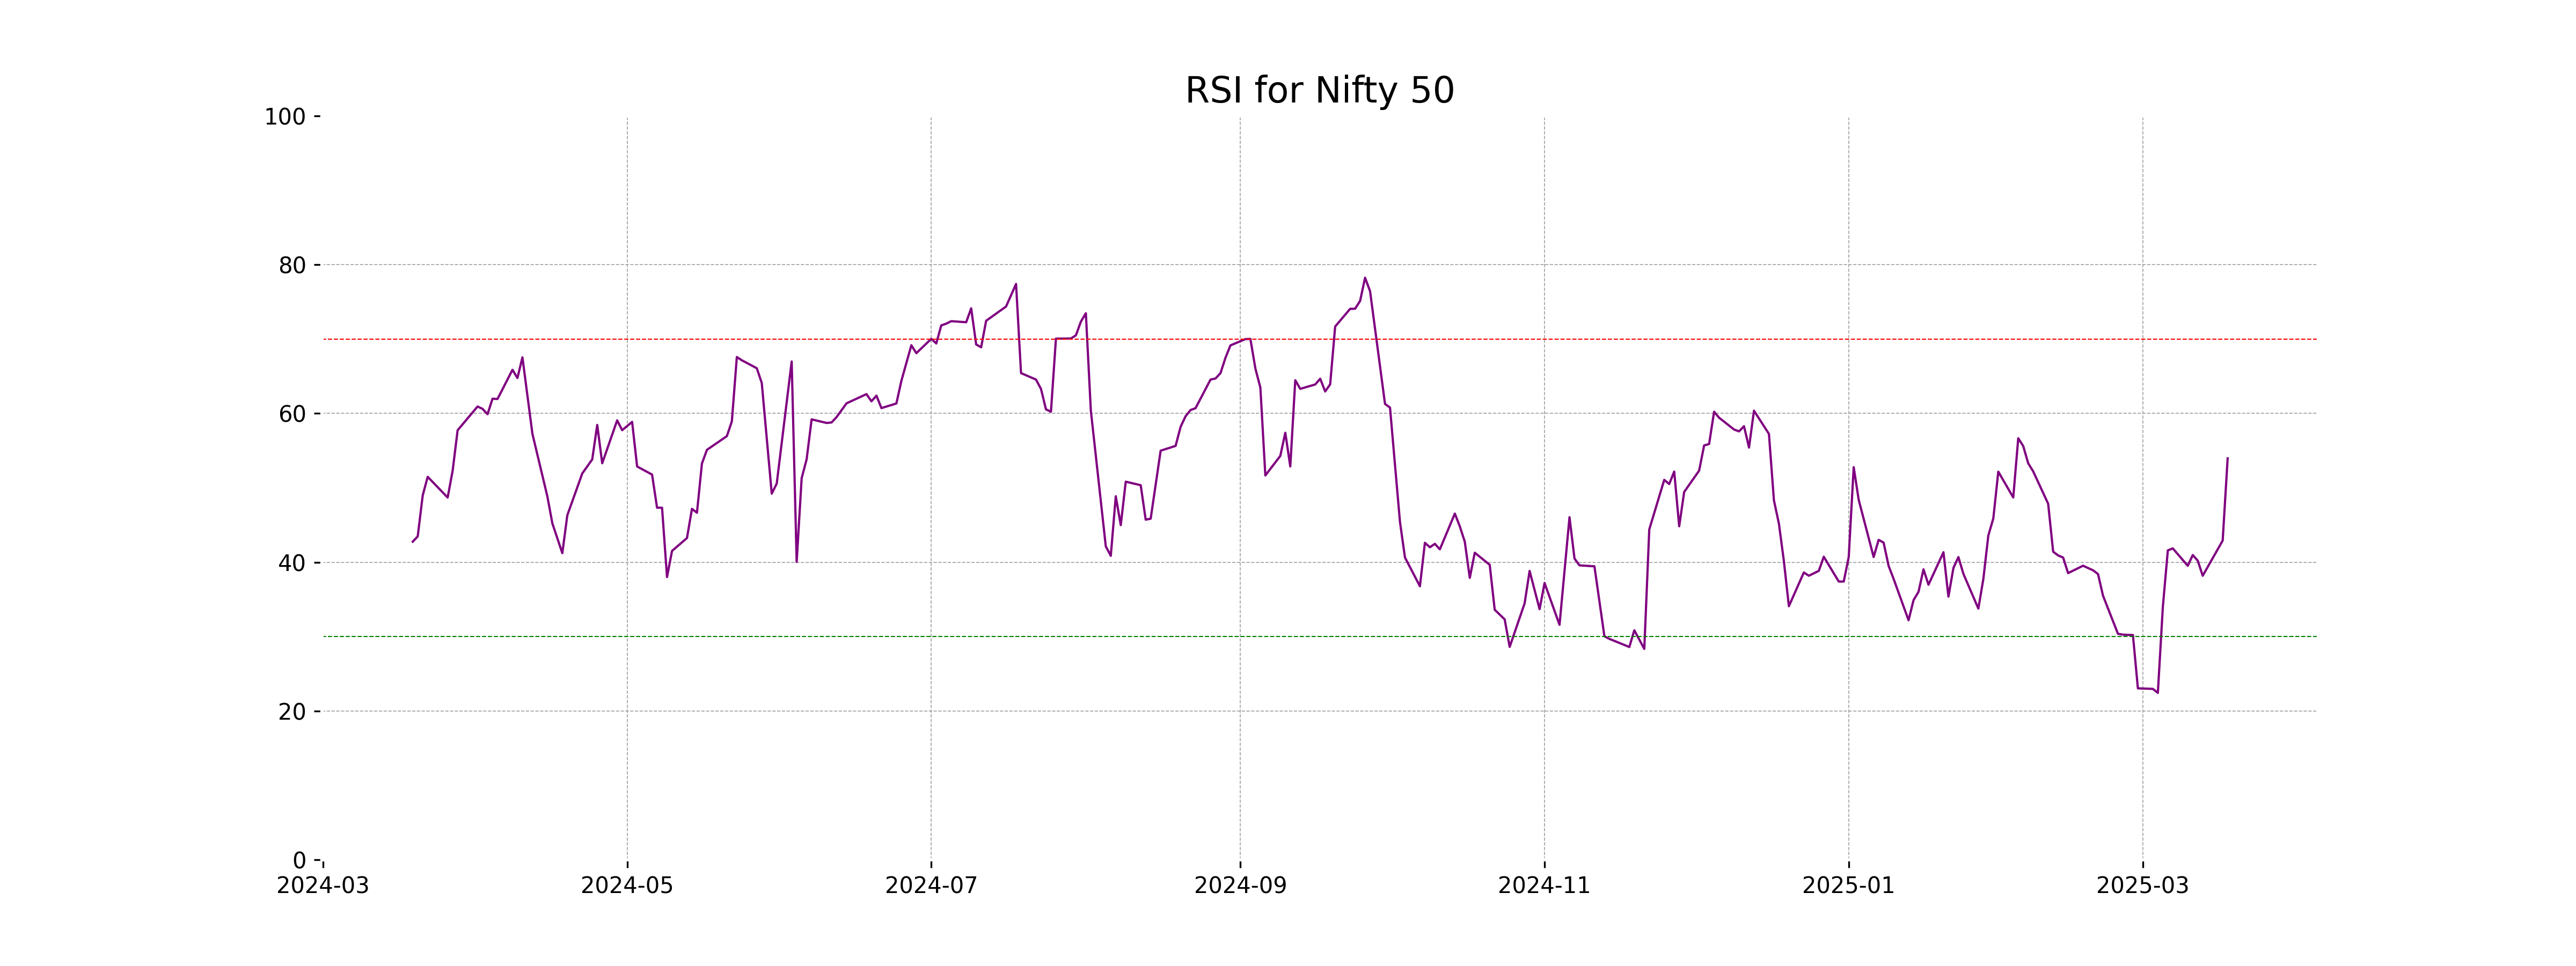
Analysis for Nifty 50 - March 18, 2025

Nifty 50 opened at 22,662.25 and closed at 22,834.30, marking a significant gain with a percentage change of 1.45% and a points change of 325.55. Although the market witnessed a bullish trend, the close was below the 50 EMA of 22,994.50, indicating a potential short-term resistance, with an RSI of 53.97 suggesting moderate momentum.

Relationship with Key Moving Averages
The Nifty 50 closed at 22834.30, which is below its 50-day EMA of 22994.50 and the 200-day EMA of 23408.86, indicating a bearish trend in relation to these key moving averages. However, it is above the 10-day EMA of 22540.45 and the 20-day EMA of 22622.47, suggesting some short-term bullish momentum.
Moving Averages Trend (MACD)
The Nifty 50 shows a MACD of -151.37, which is above the MACD Signal of -212.08, indicating a potential bullish crossover. This suggests a possible upward trend as the MACD line begins to move closer to the zero line. Keep an eye on volume and other indicators to confirm the trend.

RSI Analysis
The Relative Strength Index (RSI) for Nifty 50 is 53.97, indicating a neutral momentum without being overbought or oversold. This suggests a balanced market, with potential for either upward or downward movement.
Up Next
Global stock market indices: How the world markets performed today - 18 March 2025

Rupee breaches 91-mark against US dollar for first time in intra-day trade

Microsoft commits USD 17.5 billion investment in India: CEO Satya Nadella

CBI books Anil Ambani's son, Reliance Home Finance Ltd. in Rs 228 crore bank fraud case

RBI raises FY26 GDP growth projection to 7.3 pc

RBI trims policy interest rate by 25bps to 5.25pc, loans to get cheaper

More videos

Rupee slumps to all-time low of 90.25 against US dollar in intra-day trade

Reliance completes merger of Star Television Productions with Jiostar

India to lead emerging market growth with 7pc GDP rise in 2025: Moody’s

Nifty hits record high after 14 months; Sensex nears all-time peak

Reliance stops Russian oil use at its only-for-export refinery to comply with EU sanctions

ED attaches fresh assets worth over Rs 1,400 cr in case against Anil Ambani's Reliance Group

India signs one-year deal to import 2.2 million tonnes of LPG from US

India International Trade Fair begins at Pragati Maidan amid tight security

Stock markets decline in initial trade on foreign fund outflows, weak Asian peers

Amazon to lay off 30,000 office workers amid AI-driven cost cuts