


Highlights
- Global stock markets show mixed performance trends
- Dow Jones struggles below key moving averages
- NASDAQ composite gains despite bearish momentum
Latest news

Samsung Galaxy M17 5G Review: Best Budget Samsung Phone Under ₹15,000?

OnePlus 15R first look: OnePlus changes the R-series playbook

India's retail inflation rises to 0.71% in November

Cabinet approves CoalSETU window for auction of coal to boost industrial use and export

Cabinet approves Minimum Support Price for Copra for 2026 season

Fire never left: Vinesh Phogat comes out of retirement, targets LA Olympics

Flexible office segment in India set to grow faster, over 25% annually by 2027: Report

Rahul Gandhi flags issue of air pollution, seeks discussion in Lok Sabha
Global stock market indices: How the world markets performed today - 20 March 2025


The international stock market indices showed varied performances on March 20, 2025, reflecting the economic sentiment across different regions.
In this article, we analyze the performance of key global indices including the S&P 500, Dow Jones Industrial Average, NASDAQ Composite, FTSE 100, DAX, CAC 40, IBEX 35, Nikkei 225, Hang Seng, Nifty 50, and BSE Sensex.

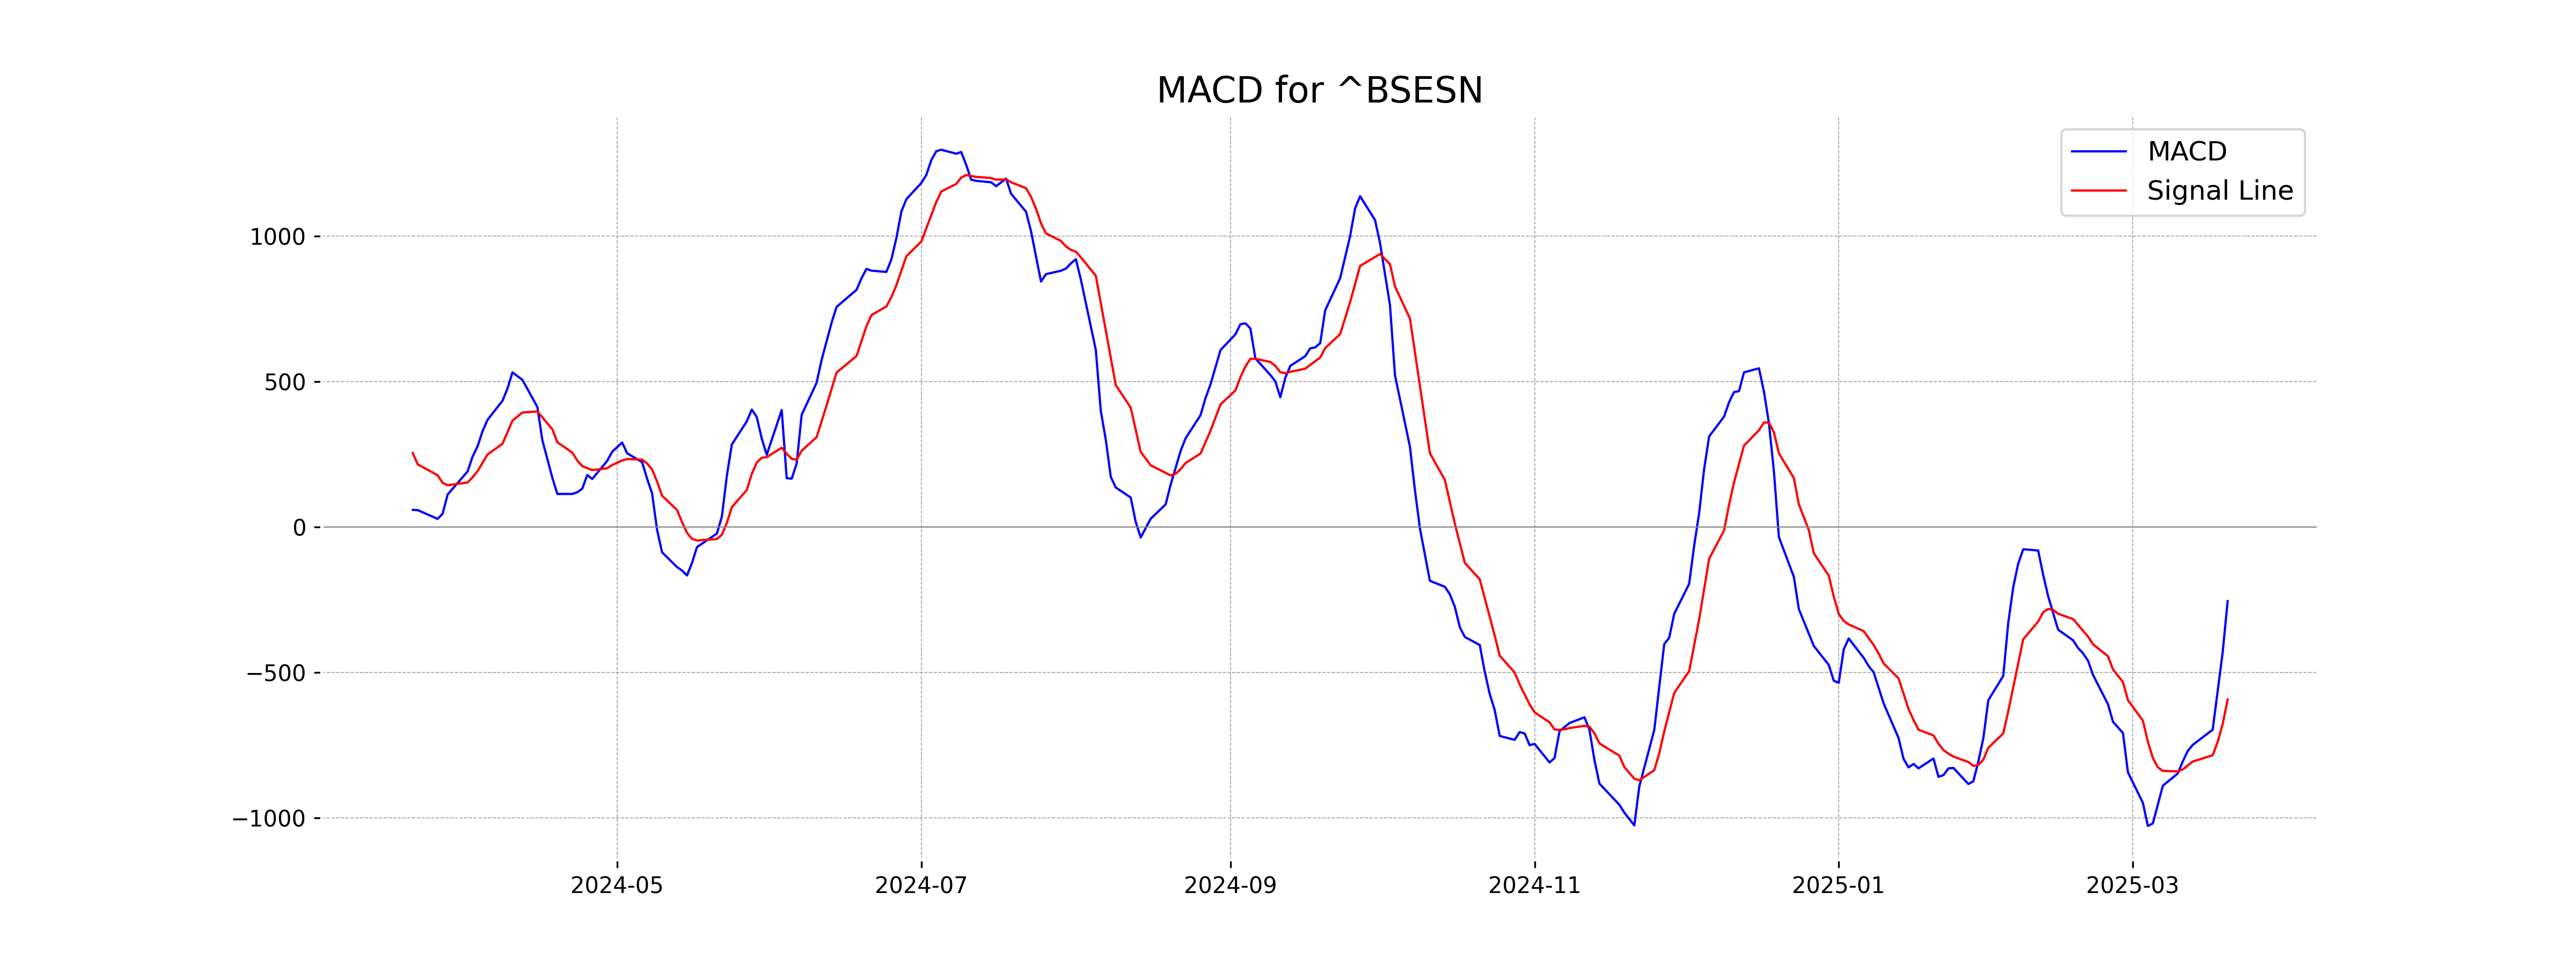
Analysis for Sensex - March 20, 2025

Sensex Performance: On the trading day, Sensex opened at 75,917.11 and closed higher at 76,348.06, marking a positive change of approximately 1.19% or 899.02 points from the previous close. Despite no volume data available, the RSI indicates moderately strong momentum at 61.76, while the MACD suggests ongoing bearish sentiment. The 50-day EMA (75,923.65) remains above the recent 10-day and 20-day EMAs, with the 200-day EMA notably higher at 77,151.25.

Relationship with Key Moving Averages
Based on the provided data, the Sensex closed above its 50-day Exponential Moving Average (EMA) of 75,923.65, indicating a bullish sign in the short term. However, it remains below the 200-EMA of 77,151.25, suggesting a longer-term bearish trend. The 10-EMA and 20-EMA, both below the close, support a short-term upward momentum.
Moving Averages Trend (MACD)
The MACD value is -254.23, which is above the MACD Signal of -592.47, suggesting potential bullish momentum in the Sensex. The positive MACD histogram indicates that the recent price trend may continue upwards. However, the overall MACD being negative indicates caution as the market might still be under previous bearish trends.
RSI Analysis
The Sensex RSI value is 61.76, indicating that the index is approaching overbought conditions but is currently in a healthy position. This suggests a moderately strong market momentum.

Analysis for Dow Jones Industrial Average (US) - March 20, 2025

The Dow Jones Industrial Average (US) opened at 41613.19 and closed higher at 41964.63, reflecting a positive change of 0.92% or 383.32 points. With a trading volume of 577.53 million, the index experienced fluctuations between a high of 42178.41 and a low of 41613.19. The RSI indicates a moderately weak momentum at 42.54, while the MACD suggests a bearish trend relative to its signal line.

Relationship with Key Moving Averages
The Dow Jones Industrial Average opened at 41613.19, which is below the 50 EMA of 43079.07 and slightly below the 200 EMA of 42000.22, indicating a short-term bearish trend. However, the close at 41964.63 is above the 10 EMA of 41920.89 but still below both the 50 EMA and 20 EMA, reflecting a potential struggle to gain upward momentum.
Moving Averages Trend (MACD)
The Dow Jones Industrial Average currently shows a negative MACD value of -635.26, indicating a bearish trend as the MACD line is below the signal line of -568.63. This suggests potential downward momentum in the market.

RSI Analysis
RSI Analysis for Dow Jones Industrial Average (US): The current RSI of 42.54 indicates that the Dow Jones Industrial Average is in a neutral zone, slightly leaning towards being oversold. It suggests that there may be a potential for upward movement if buying interest increases.

Analysis for CAC 40 (France) - March 20, 2025

The CAC 40 (France) index opened at 8164.09 and closed lower at 8062.90, marking a decline of 1.33% from the previous close of 8171.47. The index saw a points change of -108.57 with no reported trading volume, indicating reduced investor activity. Key technical indicators like the RSI at 51.00 suggest neutral momentum, while the MACD value of 26.22 falling below the signal line highlights a potential bearish trend.

Relationship with Key Moving Averages
CAC 40 open price (8164.09) is slightly above the 20-EMA (8067.23) and close price (8062.90) is slightly below, suggesting a potential ranging pattern around this level. The 50-EMA (7946.10) and 200-EMA (7687.91) are below both open and close, indicating a longer-term bullish trend despite the daily % change of -1.33%.
Moving Averages Trend (MACD)
The MACD for the CAC 40 (France) is 26.22, while the MACD Signal is 36.25. This indicates a negative divergence, suggesting potential weakness in the stock's momentum.

RSI Analysis
RSI Analysis for CAC 40 (France): The Relative Strength Index (RSI) for the CAC 40 is at 51.00, suggesting a neutral momentum as it is close to the midpoint of 50. This indicates that neither overbought nor oversold conditions are prevalent in the current market scenario for this index.

Analysis for FTSE 100 (UK) - March 20, 2025

FTSE 100 (UK) opened at 8706.66 and closed slightly lower at 8666.23, marking a decrease of 0.46% with a points change of -40.47. The RSI indicates a neutral condition at 50.92, while the MACD is slightly below its signal line, suggesting potential bearish momentum. The market showed no trading volume for this period.
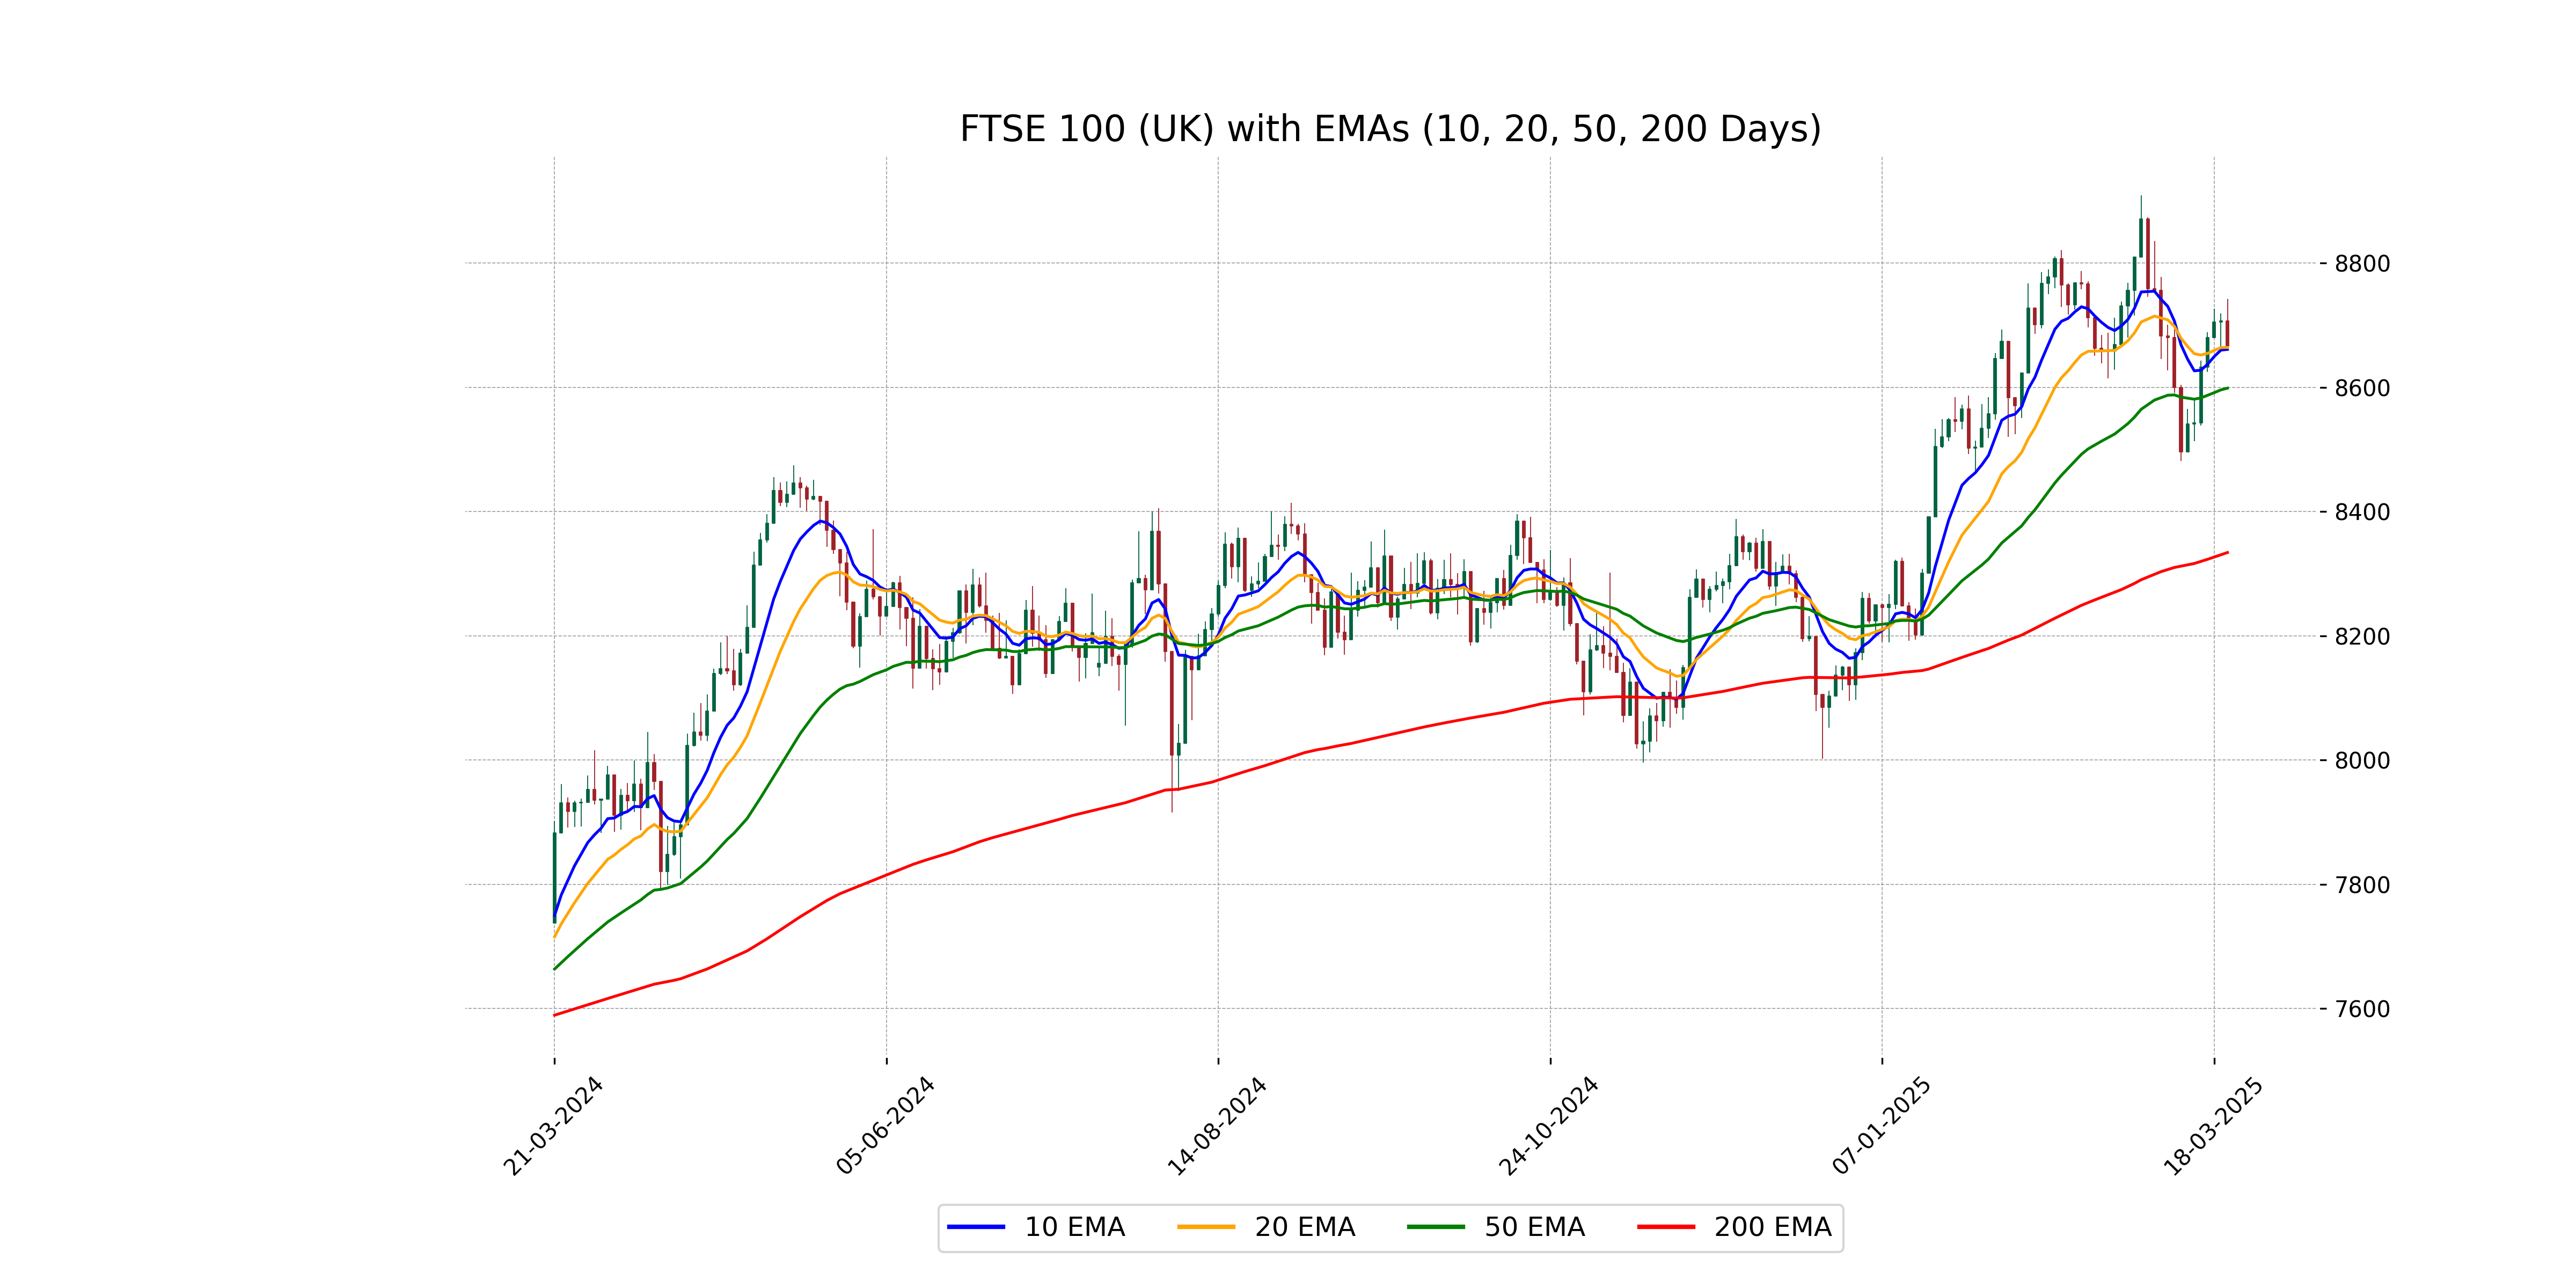
Relationship with Key Moving Averages
The FTSE 100's current close of 8666.23 is slightly above its 50-day EMA of 8598.74, indicating a short-term bullish trend, but below the 20-day EMA of 8664.26 and 10-day EMA of 8661.11. It remains considerably higher than the 200-day EMA of 8334.14, suggesting overall longer-term strength.
Moving Averages Trend (MACD)
The MACD for FTSE 100 (UK) at 4.50 is below its signal line at 9.50, suggesting a potential bearish trend. This indicates that the momentum to the downside might persist if the MACD continues below the signal line.

RSI Analysis
Based on the stock data for FTSE 100, the RSI is 50.92, indicating a neutral position in the market. This suggests that the index is neither overbought nor oversold, reflecting balanced market momentum.

Analysis for DAX (Germany) - March 20, 2025
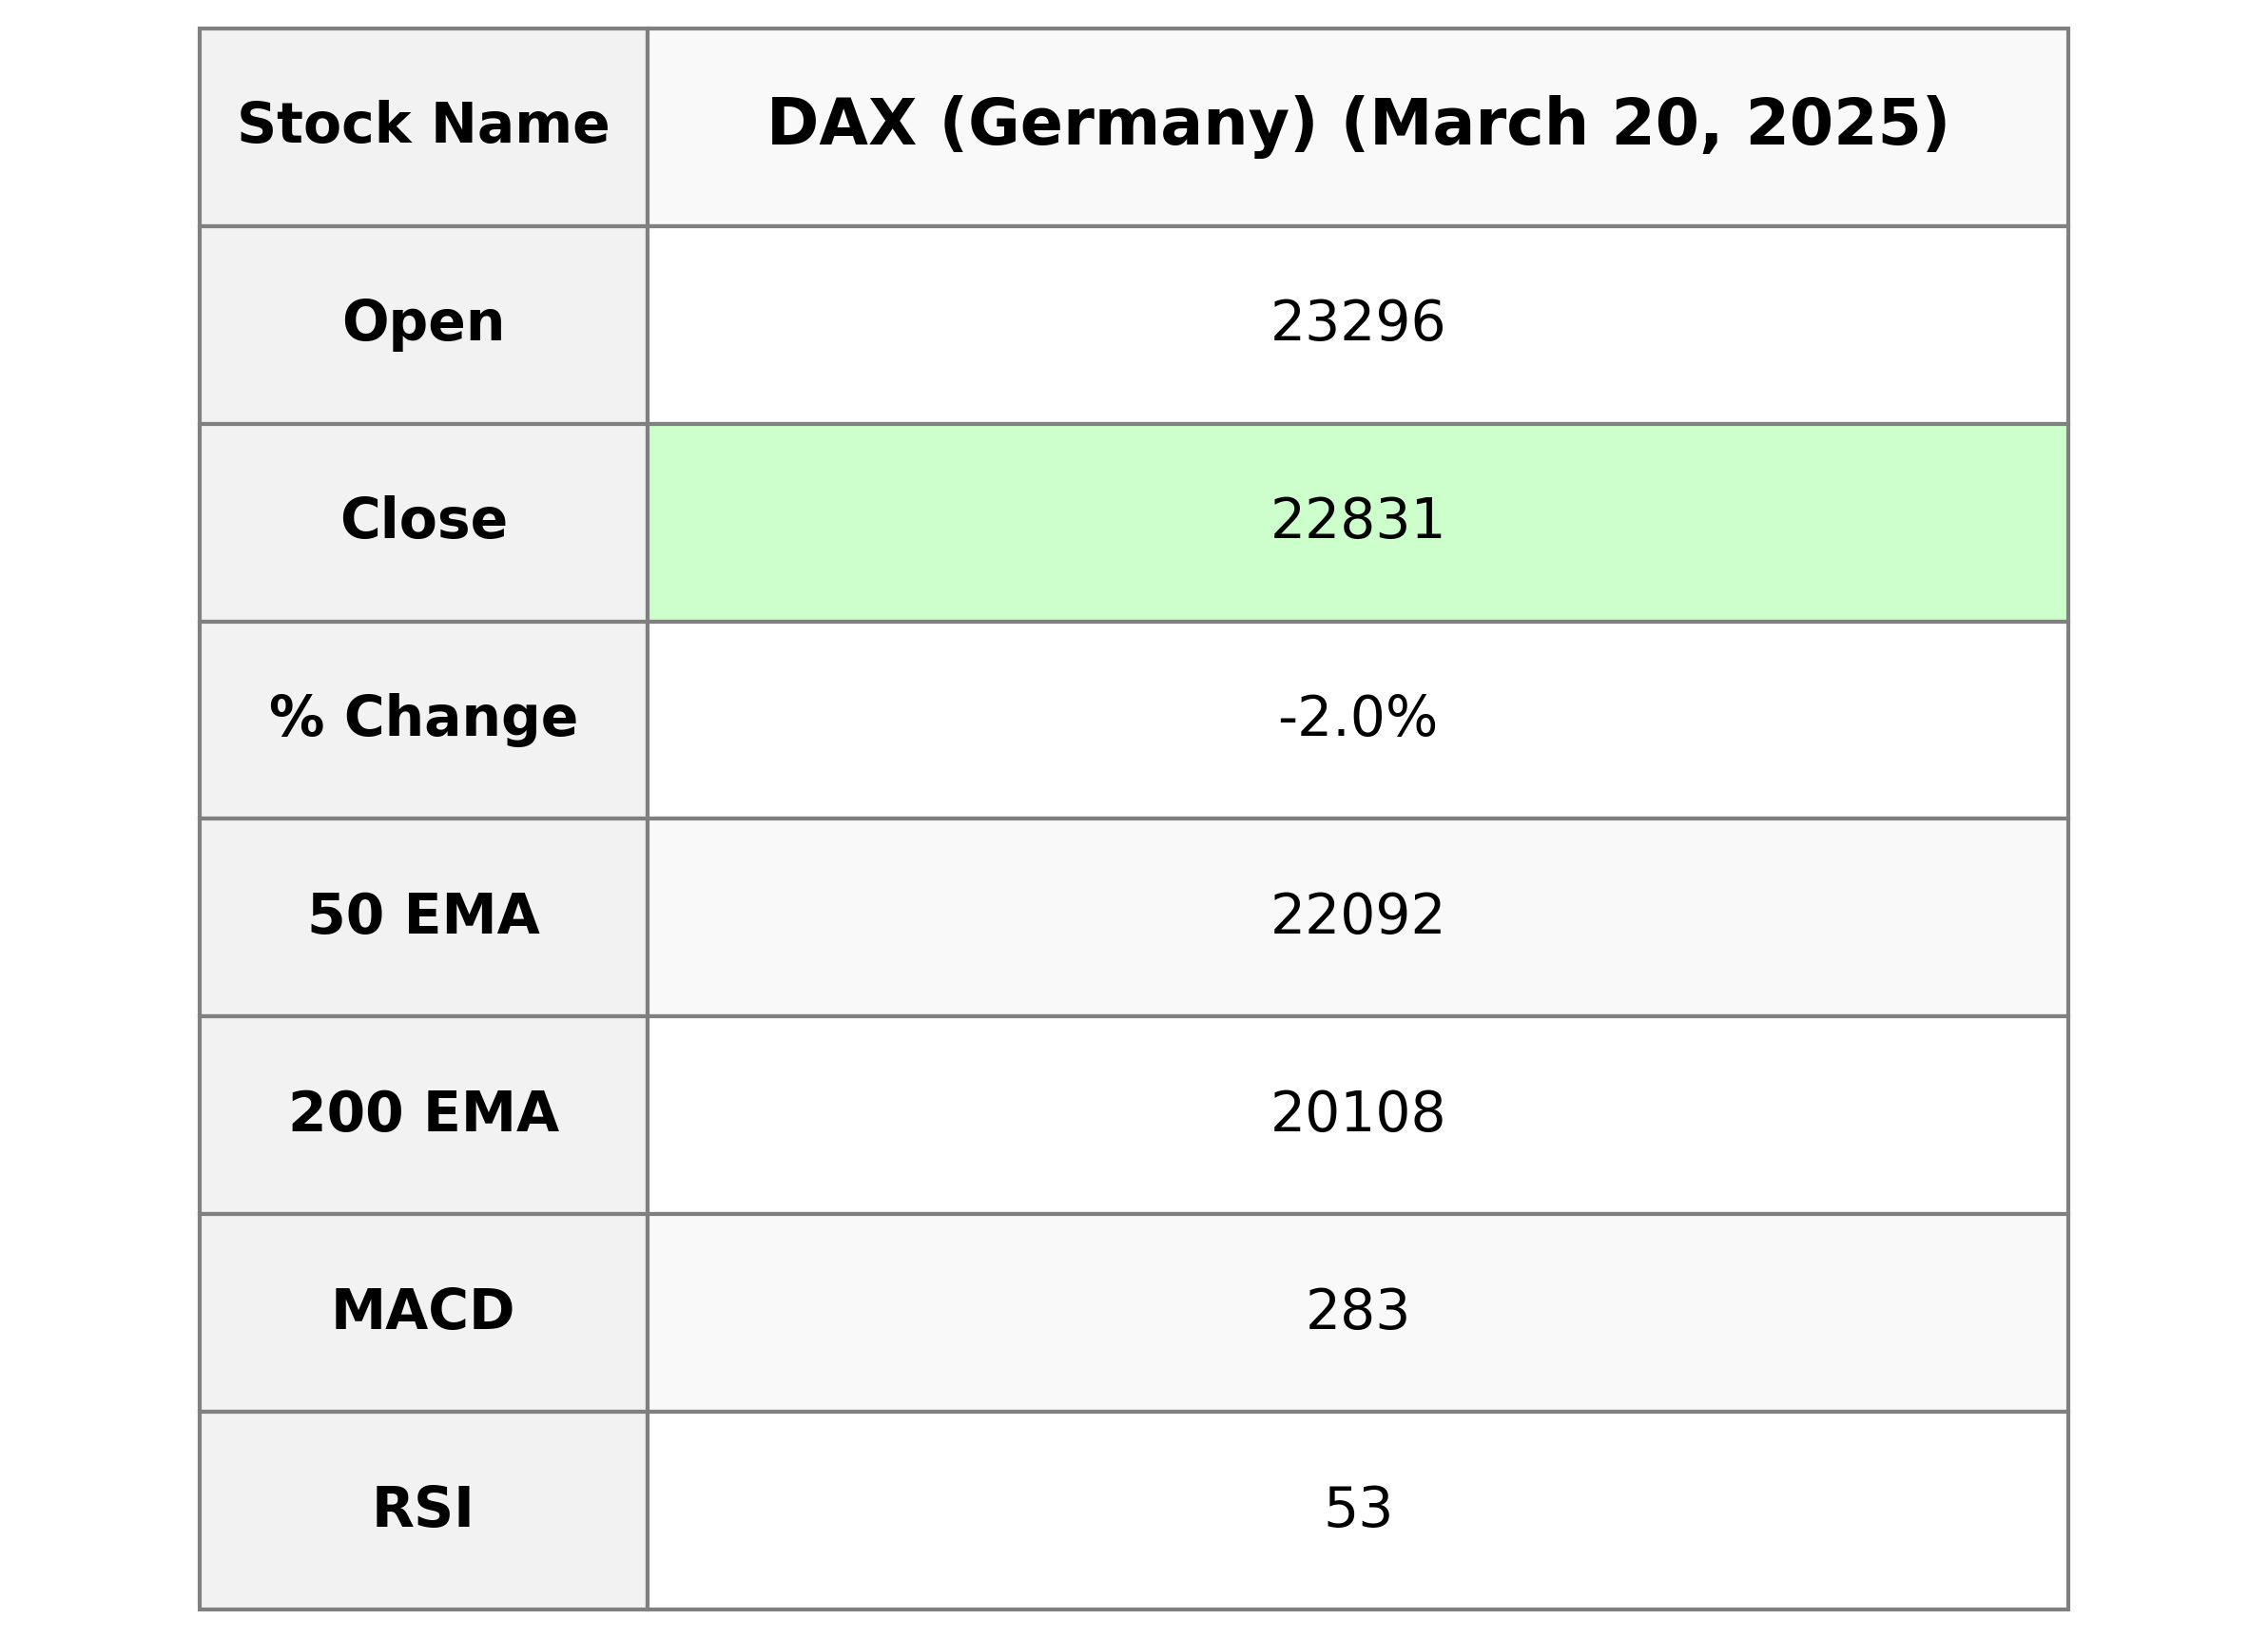
DAX (Germany) Performance: The DAX index opened at 23,295.72 and closed at 22,831.32, experiencing a decline of approximately 1.96%, equivalent to a points change of -456.74. Key indicators include a 10-day EMA at 22,953.72 and a 20-day EMA at 22,768.02, with the RSI at 52.99 suggesting a moderately balanced momentum.

Relationship with Key Moving Averages
DAX (Germany) closed below its 10 EMA of 22953.72 and just above its 20 EMA of 22768.02, indicating short-term weakness but some support nearby. Its current close of 22831.32 is well above the 50 EMA of 22092.45 and the 200 EMA of 20107.81, suggesting a longer-term bullish trend despite the recent decline.
Moving Averages Trend (MACD)
The MACD for DAX (Germany) is currently at 283.30, while the MACD Signal is at 306.69, indicating that the MACD line is below the signal line. This suggests bearish momentum as the stock might be experiencing some downward pressure.

RSI Analysis
Relative Strength Index (RSI) Analysis for DAX (Germany): The RSI for the DAX is currently at 52.99, which is in the neutral range of 30 to 70. This suggests that the market is neither overbought nor oversold, indicating a balanced state with no strong buying or selling pressures at the moment.

Analysis for S&P 500 (US) - March 20, 2025

S&P 500 (US) Performance Overview: The S&P 500 opened at 5632.37 and closed at 5675.29, marking a 1.08% increase or a gain of 60.63 points from the previous close of 5614.66. Despite a rising trend, technical indicators such as the RSI at 41.97 and a negative MACD of -103.25 suggest bearish momentum.

Relationship with Key Moving Averages
The S&P 500 is currently trading below its 50-day and 200-day EMAs but is slightly above its 10-day EMA, indicating a recent short-term recovery within an overall bearish trend. This suggests potential resistance levels at the 50-day and 200-day EMAs, with the 10-day EMA possibly acting as near-term support.
Moving Averages Trend (MACD)
S&P 500 (US) is experiencing a bearish momentum as indicated by the MACD value being lower than the MACD Signal, with a MACD of -103.25 and a MACD Signal of -94.76. This suggests a continued downtrend in the broader market.

RSI Analysis
The Relative Strength Index (RSI) for S&P 500 is 41.97, which suggests that the market is neither overbought nor oversold. This indicates a neutral market momentum and could imply consolidation or a potential shift in trend.

Analysis for Hang Seng Index (Hong Kong) - March 20, 2025

Hang Seng Index opened at 24,753.15, reached a high of the same, and closed at 24,219.95, showing a decrease of approximately 2.23%, with a points change of -551.19 from the previous close. The index's Relative Strength Index (RSI) is at 61.11, indicating a relatively stable momentum, while the MACD is below the MACD Signal, suggesting potential bearish movement.

Relationship with Key Moving Averages
Hang Seng Index is slightly above its 10 EMA of 24097.91, suggesting short-term support despite the negative % change. It is well above both its 50 EMA of 22399.89 and 200 EMA of 20143.17, indicating a continued long-term uptrend.
Moving Averages Trend (MACD)
The MACD for the Hang Seng Index (Hong Kong) is currently at 675.46, below the MACD Signal line at 699.91, suggesting bearish momentum in the market. This indicates the possibility of a downward trend continuation for the index.

RSI Analysis
The RSI for Hang Seng Index is at 61.11, which typically indicates that the index is in the neutral zone, not overbought or oversold. This level suggests that there is no significant momentum in either direction currently.

Analysis for IBEX 35 (Spain) - March 20, 2025

The IBEX 35 (Spain) opened at 13,404.10 and closed at 13,239.60, reflecting a decrease of 1.26%. The index experienced a high of 13,464.50 and a low of 13,233.10. With a Relative Strength Index (RSI) of 57.74, the market shows moderate momentum, while the Moving Average Convergence Divergence (MACD) is below its signal line, suggesting potential downward pressure.

Relationship with Key Moving Averages
The IBEX 35 index closed at 13239.60, which is below both its 50 EMA of 12746.90 and its 10 EMA of 13167.58, but above the 20 EMA of 13083.34. This suggests a potential downward momentum relative to its recent moving averages.
Moving Averages Trend (MACD)
The MACD value for IBEX 35 is 134.727, which is below the MACD Signal of 146.435. This indicates a bearish momentum as the price may be experiencing downward pressure.

RSI Analysis
The IBEX 35's RSI of 57.74 indicates a neutral trend, suggesting that the index is neither overbought nor oversold. This level implies potential for further movement in either direction, depending on upcoming market conditions.

Analysis for NASDAQ Composite (US) - March 20, 2025

The NASDAQ Composite (US) opened at 17,590.12 and closed at 17,750.79, marking a 1.41% increase with a points change of 246.67. The RSI stands at 39.67, indicating the index is approaching oversold conditions. Meanwhile, the MACD shows a bearish trend as it remains below the signal line at -500.49.

Relationship with Key Moving Averages
NASDAQ Composite closed at 17750.79, which is below its 50-day EMA of 18795.57 and 200-day EMA of 18268.16, but above its 10-day EMA of 17823.72. The current close suggests a bearish sentiment in the longer term, indicated by the price trading below both the 50 and 200-day EMAs.
Moving Averages Trend (MACD)
The MACD value for NASDAQ Composite is -500.49, which is lower than its signal line value of -470.79, indicating a bearish trend. Furthermore, both the MACD and signal line are in negative territory, suggesting ongoing downward momentum in the market.

RSI Analysis
The Relative Strength Index (RSI) for NASDAQ Composite is 39.67, indicating that the index is close to the oversold territory. This suggests potential buying opportunities if the trend reverses, as RSI values below 30 typically signal oversold conditions.

Analysis for Nikkei 225 (Japan) - March 20, 2025

Nikkei 225 (Japan) opened at 37,839.39 and closed at 37,751.88, marking a decrease of 0.25% with a points change of -93.54. The index's current RSI is 48.55, suggesting a neutral market sentiment, while the MACD indicates bearish momentum as it is below the signal line.

Relationship with Key Moving Averages
The Nikkei 225 opened at 37,839.39, with a close lower at 37,751.88, reflecting a decrease of 0.25% compared to the previous close of 37,845.42. The closing price is below the key 50-day EMA of 38,246.99 and the 200-day EMA of 38,186.33, but is above the 10-day EMA of 37,424.81 and the 20-day EMA of 37,675.17, indicating a potential short-term upward trend, although it remains under longer-term pressure.
Moving Averages Trend (MACD)
Nikkei 225's MACD value is -378.39, which is above its MACD Signal of -464.05. This situation suggests a potential bullish momentum as the MACD line crosses above the signal line, indicating a possible trend reversal or strengthening of the upward trend.

RSI Analysis
The RSI value for the Nikkei 225 is 48.55, which suggests that the index is neither overbought nor oversold, indicating a relatively neutral momentum currently. Generally, an RSI above 70 indicates overbought conditions, and below 30 indicates oversold conditions.

Analysis for Nifty Bank - March 20, 2025

Nifty Bank opened at 49,947.60 and closed at 50,062.85, showing a positive points change of 360.25 with a percentage change of 0.72% from the previous close of 49,702.60. The 50-day EMA is 49,296.97, and the 200-day EMA is 49,899.14, indicating a short-term bullish trend, while the RSI of 64.02 suggests moderate buying pressure.

Relationship with Key Moving Averages
Nifty Bank closed at 50062.85, which is above its 50-day EMA of 49296.97 and 200-day EMA of 49899.14, indicating a positive short-term trend. It is also higher than the 10-day EMA of 48956.71 and 20-day EMA of 48866.29, suggesting short-term momentum is aligned with the longer-term moving averages.
Moving Averages Trend (MACD)
MACD Analysis for Nifty Bank: The MACD value of -15.97 compared to the MACD Signal of -232.21 suggests a bullish momentum, as the MACD line is above the signal line. This indicates a potential positive trend change for Nifty Bank.

RSI Analysis
The RSI (Relative Strength Index) for Nifty Bank is 64.02, indicating a relatively strong momentum. An RSI above 70 generally suggests that a stock may be overbought, whereas an RSI below 30 might indicate it is oversold. Therefore, with an RSI of 64.02, Nifty Bank is neither in the overbought nor oversold territory, but is closer to the overbought side, suggesting strengthening market conditions.

Analysis for Nifty 50 - March 20, 2025

Nifty 50 opened at 23,036.60 and closed higher at 23,190.65, marking a 1.24% gain with an increase of 283.05 points in comparison to its previous close of 22,907.60. The index's RSI stands at 62.94, indicating positive momentum, while the MACD is at -56.12 with a signal line of -164.77, suggesting ongoing bearish conditions despite the recent price increase.

Relationship with Key Moving Averages
The Nifty 50 closed above its 50-day EMA suggesting a short-term bullish trend, but it remains below the 200-day EMA, indicating a longer-term bearish trend. The negative MACD value, although improving, also suggests that the overall momentum is still bearish.
Moving Averages Trend (MACD)
Based on the stock data for Nifty 50, the MACD value of -56.12, which is higher than the MACD Signal at -164.77, indicates a potential bullish signal as the MACD line is crossing above the signal line. This suggests potential positive momentum, but it is important to consider other indicators such as the RSI and EMAs for a comprehensive analysis.

RSI Analysis
The RSI for Nifty 50 is 62.94, which indicates a moderately strong buying momentum. It is below the overbought level (typically set at 70), suggesting that the index is not yet in an overbought condition.

Up Next
Global stock market indices: How the world markets performed today - 20 March 2025

Microsoft commits USD 17.5 billion investment in India: CEO Satya Nadella

CBI books Anil Ambani's son, Reliance Home Finance Ltd. in Rs 228 crore bank fraud case

RBI raises FY26 GDP growth projection to 7.3 pc

RBI trims policy interest rate by 25bps to 5.25pc, loans to get cheaper

Rupee slumps to all-time low of 90.25 against US dollar in intra-day trade

More videos

Reliance completes merger of Star Television Productions with Jiostar

India to lead emerging market growth with 7pc GDP rise in 2025: Moody’s

Nifty hits record high after 14 months; Sensex nears all-time peak

Reliance stops Russian oil use at its only-for-export refinery to comply with EU sanctions

ED attaches fresh assets worth over Rs 1,400 cr in case against Anil Ambani's Reliance Group

India signs one-year deal to import 2.2 million tonnes of LPG from US

India International Trade Fair begins at Pragati Maidan amid tight security

Stock markets decline in initial trade on foreign fund outflows, weak Asian peers

Amazon to lay off 30,000 office workers amid AI-driven cost cuts

US sanctions on Russian firms to hit Reliance; PSUs likely to keep buying Russian oil via traders