


Highlights
Latest news

Samsung Galaxy M17 5G Review: Best Budget Samsung Phone Under ₹15,000?

OnePlus 15R first look: OnePlus changes the R-series playbook

India's retail inflation rises to 0.71% in November

Cabinet approves CoalSETU window for auction of coal to boost industrial use and export

Cabinet approves Minimum Support Price for Copra for 2026 season

Fire never left: Vinesh Phogat comes out of retirement, targets LA Olympics

Flexible office segment in India set to grow faster, over 25% annually by 2027: Report

Rahul Gandhi flags issue of air pollution, seeks discussion in Lok Sabha
Global stock market indices: How the world markets performed today - 21 March 2025


The international stock market indices showed varied performances on March 21, 2025, reflecting the economic sentiment across different regions.
In this article, we analyze the performance of key global indices including the S&P 500, Dow Jones Industrial Average, NASDAQ Composite, FTSE 100, DAX, CAC 40, IBEX 35, Nikkei 225, Hang Seng, Nifty 50, and BSE Sensex.

Analysis for Sensex - March 21, 2025

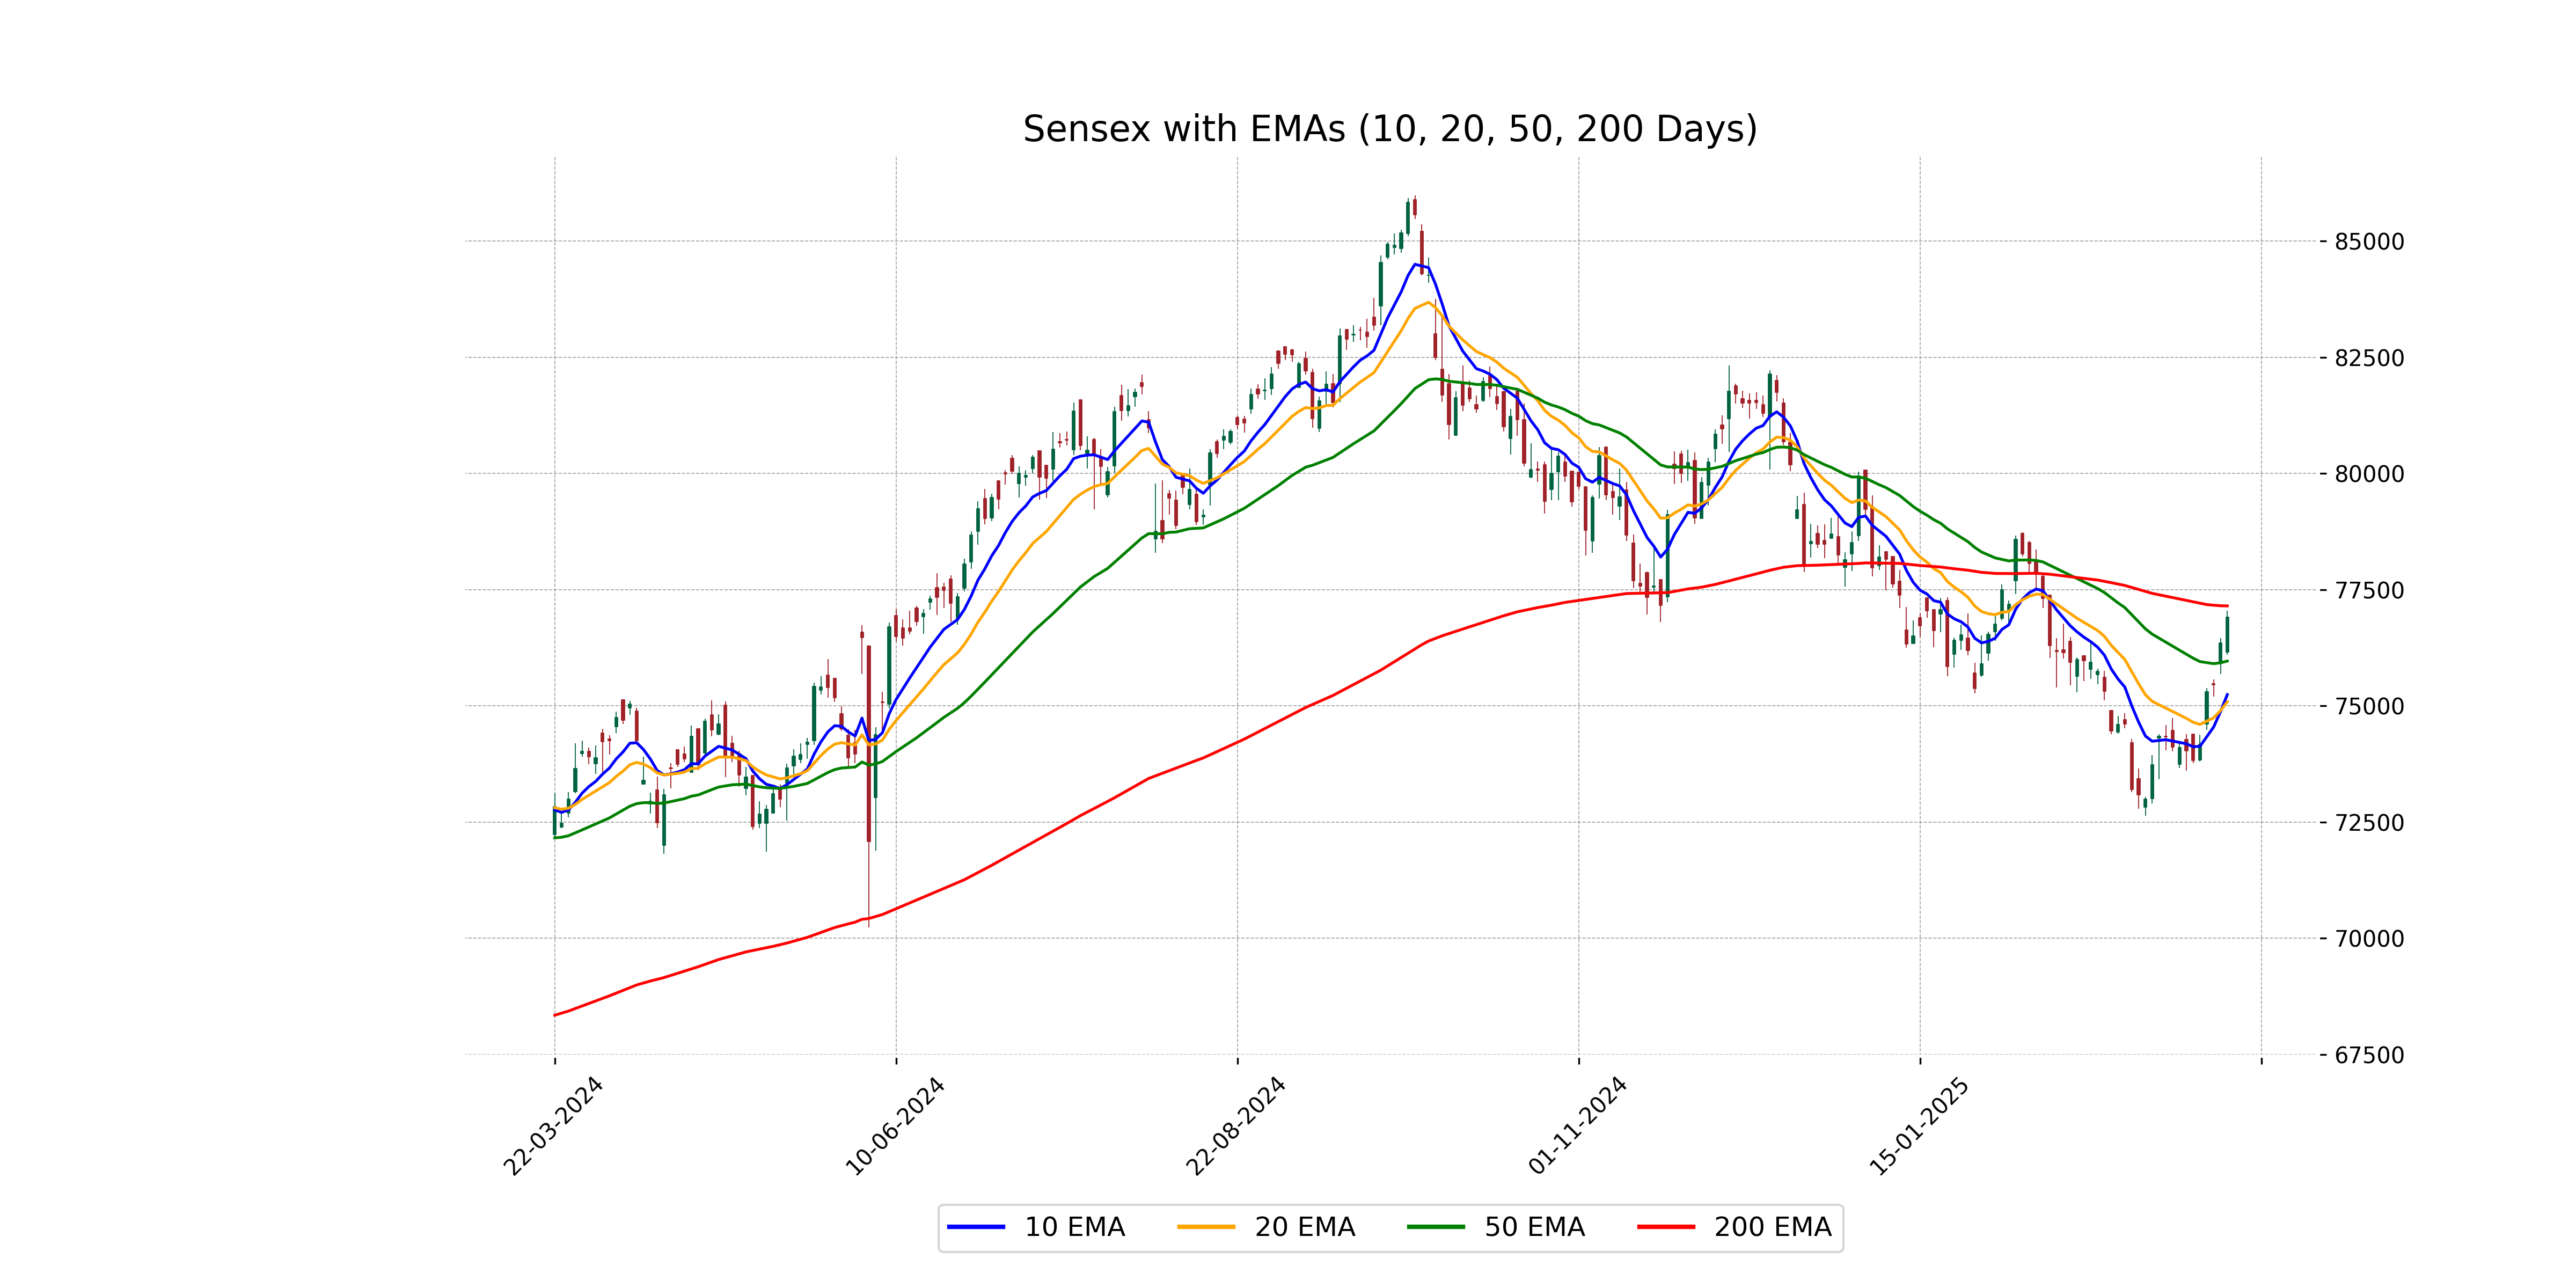
The BSESN (Sensex) opened at 76,155 and closed higher at 76,905.51, marking a gain of 0.73%. It experienced minor fluctuations with a high of 77,041.94 and a low of 76,095.26. The RSI indicates a moderately strong uptrend, despite the MACD suggesting potential bearish divergence.
Relationship with Key Moving Averages
The close of Sensex at 76905.51 is above the 50 EMA (75962.16) and the 10 EMA (75240.68), indicating a short-term bullish trend, but it is below the 200 EMA (77149.09), suggesting potential resistance and an overall neutral to bearish long-term outlook.
Moving Averages Trend (MACD)
The MACD value for Sensex is -68.85, while the MACD Signal is significantly lower at -487.74. This indicates that the MACD line is above the signal line, which suggests potential upward momentum or a bullish trend reversal.

RSI Analysis
The Relative Strength Index (RSI) for Sensex is 65.41, indicating a moderately strong upward momentum. Generally, RSI values between 70 and 100 are considered overbought, and those between 30 and 0 are considered oversold. An RSI of 65.41 suggests that Sensex is closer to overbought conditions, implying potential caution for investors as it continues to approach overbought territory.

Analysis for Dow Jones Industrial Average (US) - March 21, 2025

The Dow Jones Industrial Average closed at 41,953.32, showing a slight decrease of 0.03% compared to the previous close. The index experienced a minor drop of 11.31 points with most technical indicators signaling weakness, including a MACD of -594.63 and an RSI of 42.44, suggesting bearish market sentiment.

Relationship with Key Moving Averages
The Dow Jones Industrial Average (US) closed at 41,953.32, which is below both its 50-day EMA of 43,034.92 and its 20-day EMA of 42,398.71, indicating a bearish trend. However, it remains slightly above its 10-day EMA of 41,926.78 and close to its 200-day EMA of 41,999.86, suggesting potential near-term stability.
Moving Averages Trend (MACD)
The Dow Jones Industrial Average's MACD is -594.63, which is below the MACD Signal of -573.83. This suggests a bearish trend as the MACD line is moving further below the signal line, indicating potential for continued downward momentum.

RSI Analysis
RSI Analysis for Dow Jones Industrial Average (US): The Relative Strength Index (RSI) for the Dow Jones Industrial Average stands at 42.44, which is below the neutral level of 50. This indicates a potential bearish sentiment as the index is closer to the oversold territory, which generally begins below 30.

Analysis for CAC 40 (France) - March 21, 2025

CAC 40 (France) Performance On the recent trading day, the CAC 40 opened at 8062.27, reached a high of 8075.44, and closed at 8043.65, marking a decline from the previous close of 8094.20. The index experienced a percentage change of -0.62%, indicating a points drop of 50.55. The RSI stands at 49.71, suggesting a neutral market momentum.

Relationship with Key Moving Averages
The CAC 40 closed below its 10 EMA and 20 EMA, indicating short-term bearish momentum, but remains above its 50 EMA and 200 EMA, suggesting long-term bullish trends are still intact. The RSI near 50 suggests neutral momentum, while a negative MACD points to weakening momentum.
Moving Averages Trend (MACD)
CAC 40 (France) is exhibiting a bearish trend as indicated by the MACD analysis. The MACD line (23.62) is below the MACD Signal line (34.13), suggesting a potential continuation of downward momentum in the short term.

RSI Analysis
The RSI for CAC 40 (France) is 49.71, indicating a neutral position as it is close to the midpoint of the typical RSI scale. This suggests that the index is neither overbought nor oversold, and the market could move in either direction depending on other factors.

Analysis for FTSE 100 (UK) - March 21, 2025

FTSE 100 closed at 8665.99, down by 0.41% from the previous close of 8702.00, reflecting a points change of -36.01. The RSI stands at 50.66, indicating a neutral strength, while the MACD is slightly under its signal line, suggesting a potential trend reversal.

Relationship with Key Moving Averages
The FTSE 100 closed slightly below its 10-day and 20-day EMAs, indicating a potential short-term bearish trend. However, it remains above the 50-day and 200-day EMAs, suggesting that the overall longer-term trend may still have bullish elements.
Moving Averages Trend (MACD)
MACD Analysis for FTSE 100 (UK): The MACD value (6.66) for FTSE 100 is below the MACD Signal (9.38), indicating a bearish sentiment, as the momentum may be weakening. Investors should watch for any further divergence or confirmation from other technical indicators.

RSI Analysis
RSI for FTSE 100 is currently at 50.66, indicating a neutral position where the index is neither overbought nor oversold. This suggests a balanced trading environment where drastic buying or selling pressure is not evident.

Analysis for DAX (Germany) - March 21, 2025

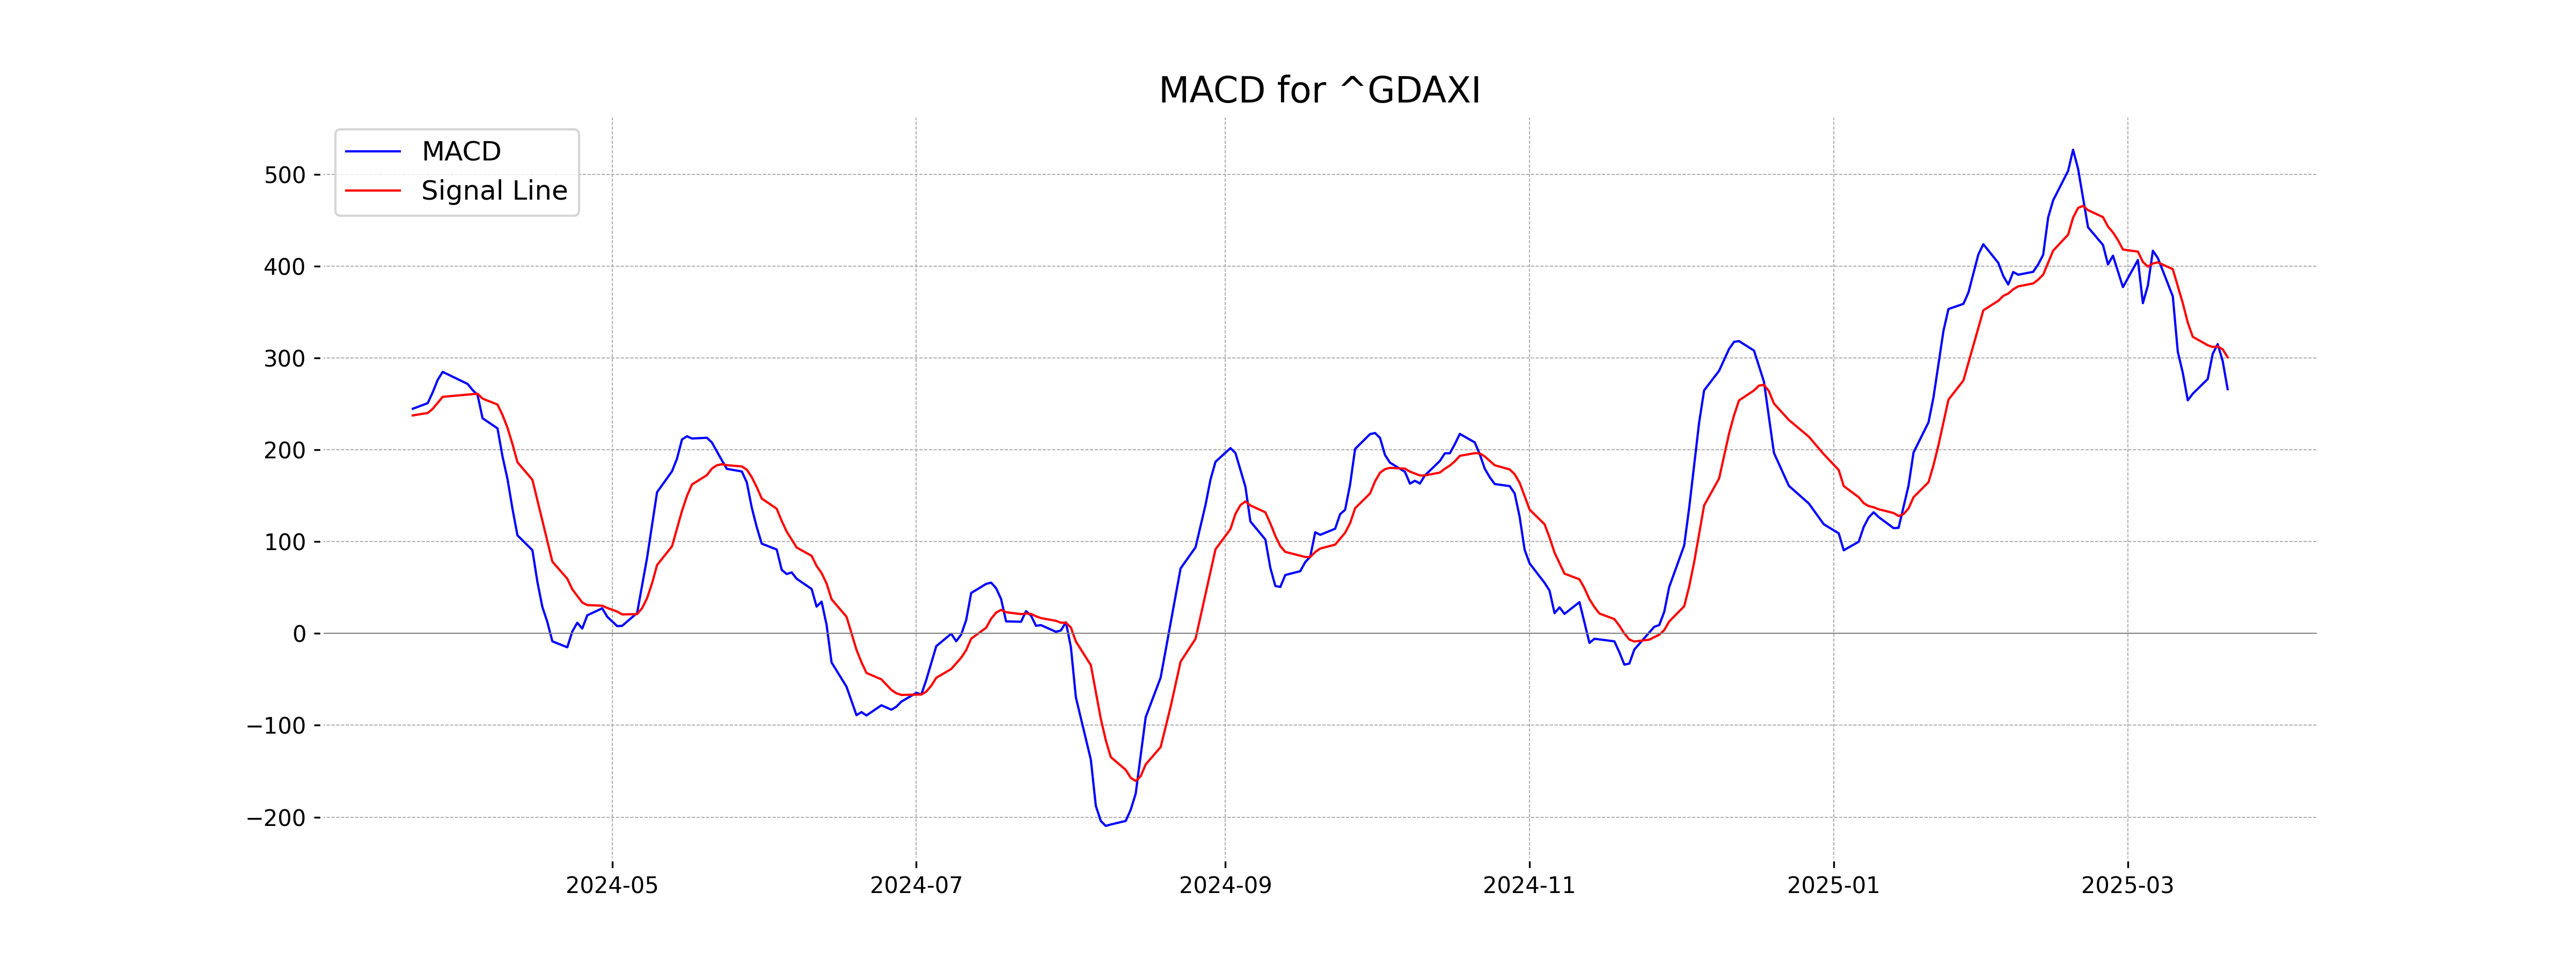
The DAX (Germany) opened at 22,926.42, reaching a high of 22,956.98 and closing slightly down at 22,835.40, marking a decrease of 0.71% from the previous close of 22,999.15. The index experienced a points change of -163.75, with the RSI indicating a relatively neutral momentum at 52.87. Current trends show it moving above its 50-day EMA but below its 10-day EMA, while the MACD suggests a potential weakening momentum compared to the signal line.

Relationship with Key Moving Averages
The current close of DAX (Germany) is 22,835.40, positioned above the 200-day EMA of 20,136.69, but below the 10-day EMA of 22,957.18. This indicates a long-term bullish trend, while the short-term suggests potential bearish pressure.
Moving Averages Trend (MACD)
The MACD for DAX (Germany) is 265.90, which is below the MACD Signal line of 300.67, suggesting a bearish trend. This indicates that the momentum might be shifting towards a downward movement.
RSI Analysis
The Relative Strength Index (RSI) for DAX (Germany) is currently 52.87, which is in the neutral range. An RSI value typically between 30 and 70 indicates a balanced momentum without any strong overbought or oversold signals.

Analysis for S&P 500 (US) - March 21, 2025

S&P 500 (US) opened at 5646.92 and closed at 5662.89, experiencing a slight decrease of -0.22%, indicating minor downward movement with a drop of 12.40 points. The trading volume was significant at 4.68 billion, and key indicators such as the 10 EMA are below the 50 and 200 EMA values, suggesting a bearish trend, while the RSI is at 41.32, potentially indicating oversold conditions.

Relationship with Key Moving Averages
The S&P 500 is currently trading below the 50-day EMA (5859.86) and the 200-day EMA (5704.24), indicating a bearish trend in the broader market. It is also slightly below the 10-day EMA (5672.17) and significantly below the 20-day EMA (5749.00), suggesting recent downward momentum.
Moving Averages Trend (MACD)
S&P 500 (US) MACD Analysis: The MACD value of -97.92 suggests that the short-term momentum is currently bearish. Furthermore, since the MACD is below the MACD Signal line (-95.39), it indicates continued downward movement, reinforcing the bearish sentiment in the market.

RSI Analysis
The RSI for S&P 500 is at 41.32, indicating that the index is approaching oversold territory but is not yet below the critical 30 level often associated with oversold conditions. Caution is advised as RSI is below the neutral 50 mark, suggesting potential weakness in the current trend.

Analysis for Hang Seng Index (Hong Kong) - March 21, 2025

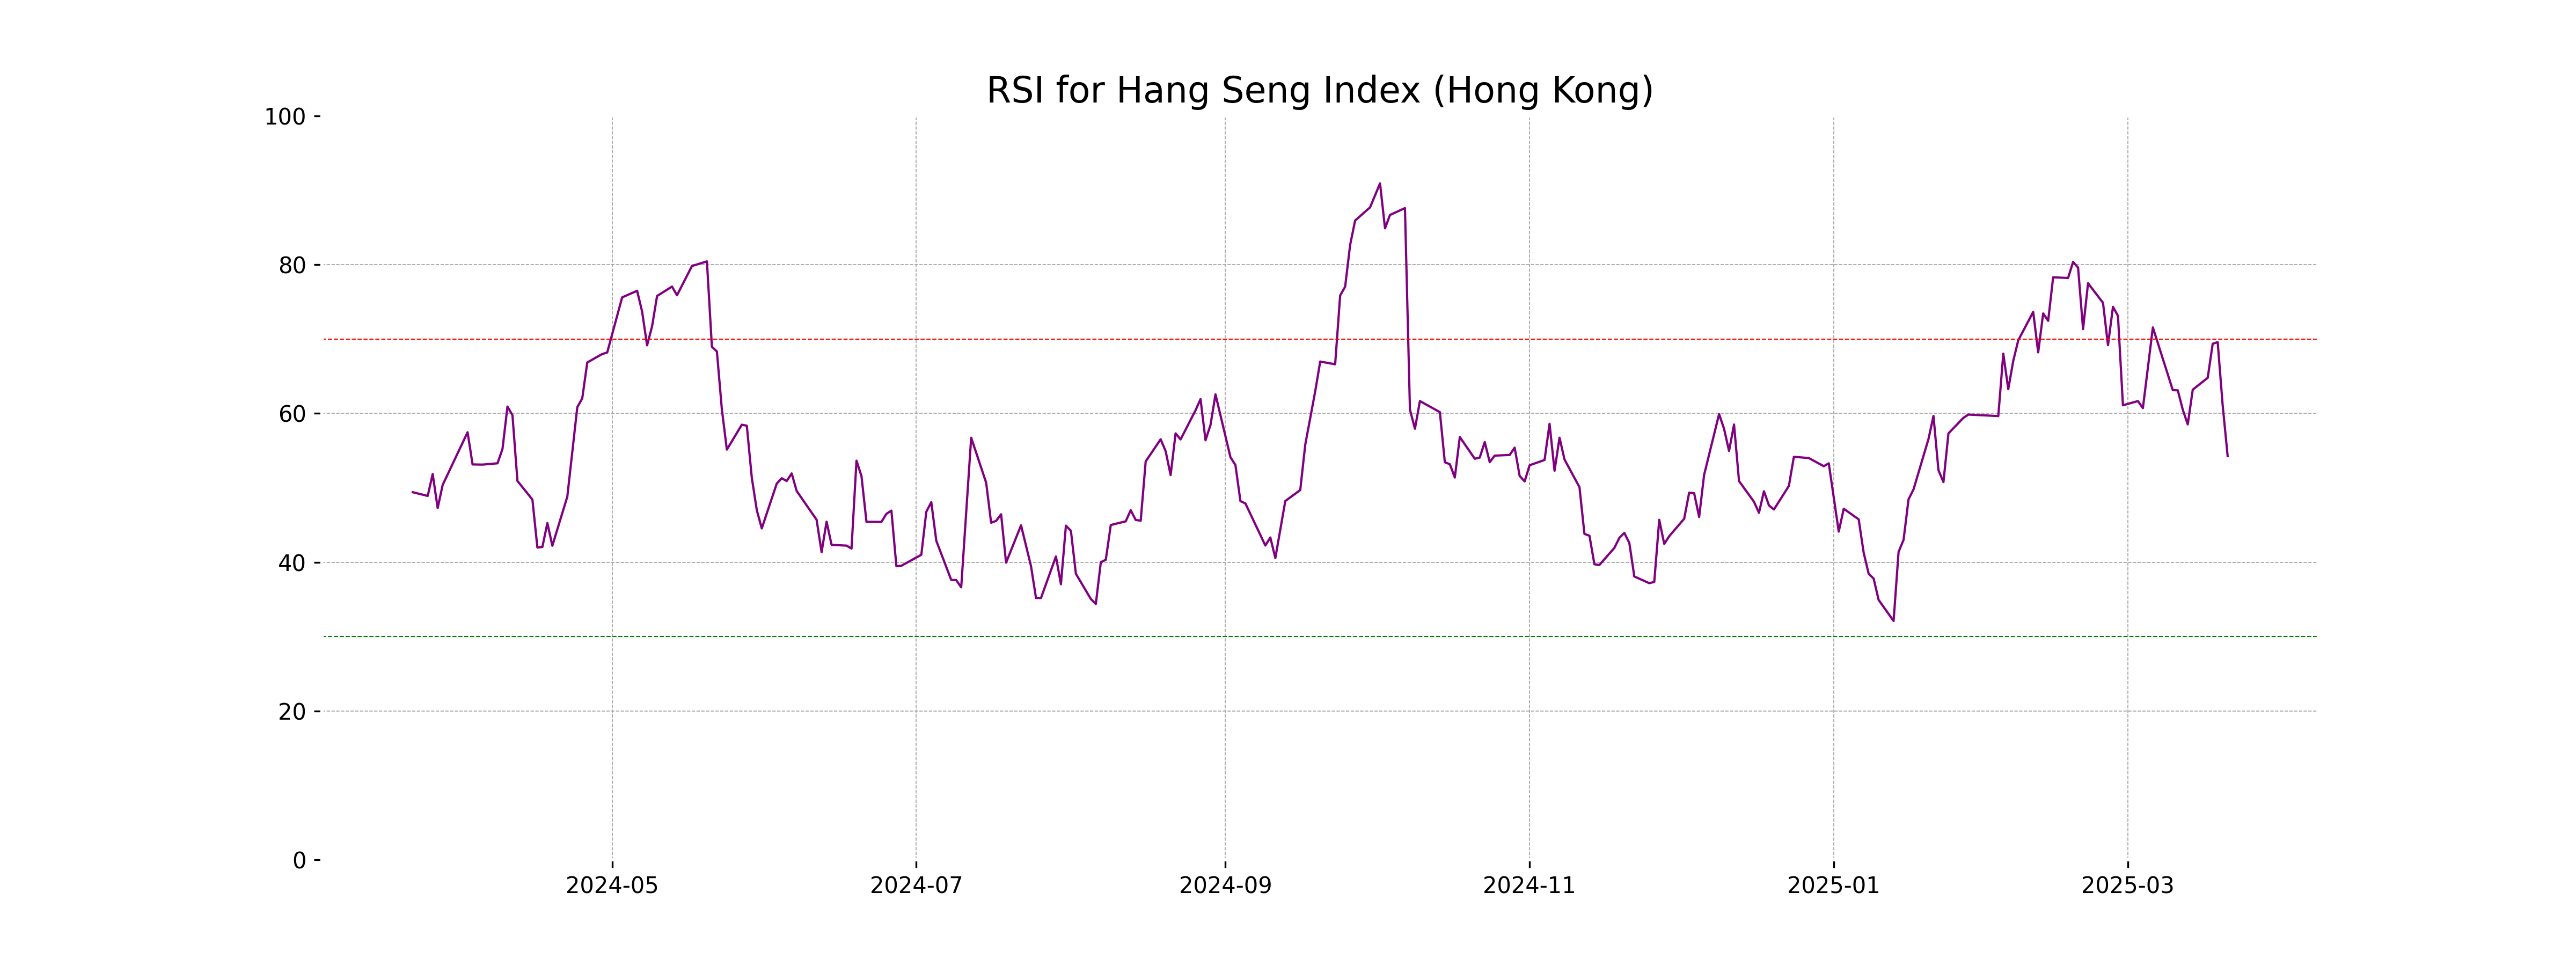
The Hang Seng Index (Hong Kong) opened at 24,109.07 and closed lower at 23,689.72, marking a decrease of 2.19% with a points change of -530.23. The 50-day EMA is above the 10 and 20-day EMAs, indicating a longer-term upward trend, while the RSI is at 54.27, suggesting neither overbought nor oversold conditions.

Relationship with Key Moving Averages
The closing price of the Hang Seng Index at 23,689.72 is below its 10-day EMA of 24,023.69, indicating short-term bearish momentum. It remains above the 50-day EMA of 22,450.47 and significantly above the 200-day EMA of 20,178.48, suggesting a long-term bullish trend despite recent declines.
Moving Averages Trend (MACD)
The MACD for the Hang Seng Index indicates a bearish signal as the MACD value of 600.01 is below the MACD Signal line of 679.93. This crossover suggests potential downward momentum in the coming sessions.

RSI Analysis
Based on the stock data, the RSI value for Hang Seng Index is 54.27, which indicates that the market is neither overbought nor oversold. An RSI near 50 suggests a stable or consolidating market for Hang Seng Index.
Analysis for IBEX 35 (Spain) - March 21, 2025

IBEX 35 (Spain) opened at 13258.40 and closed slightly lower at 13281.30, down by 0.19% from the previous close of 13306.30. The index reached a high of 13307.90 and a low of 13213.00 with a trading volume of 34,003,507. The 50-day EMA is at 12770.37, while the 200-day EMA is at 11861.25, indicating a positive trend in the mid to long term. The RSI stands at 59.19, suggesting moderate momentum.

Relationship with Key Moving Averages
The IBEX 35 is currently trading slightly above its 10 EMA (13,198.18) and well above its 50 EMA (12,770.37) and 200 EMA (11,861.25), indicating a short-term relative strength compared to its longer-term trends. With the close at 13,281.30, the index shows short-term bullish momentum with slight deviation from the 10 EMA.
Moving Averages Trend (MACD)
The IBEX 35's MACD value is 139.14, which is slightly below the MACD Signal value of 145.83. This indicates a potential bearish crossover, suggesting that the index may face some selling pressure in the near term.

RSI Analysis
The RSI for IBEX 35 (Spain) is 59.19, indicating a neutral to slightly bullish momentum since it is near the midpoint of the RSI range. This suggests the index is neither overbought nor oversold, with potential room for upward movement in the short term.

Analysis for NASDAQ Composite (US) - March 21, 2025

NASDAQ Composite (US) Performance: The NASDAQ Composite opened at 17,586.06, reached a high of 17,903.20, and closed at 17,691.63, showing a percentage change of -0.33% from the previous close of 17,750.79. The index experienced a points change of -59.16. The volume was approximately 6.1 billion, with the 50-day and 200-day EMAs at 18,752.28 and 18,262.48, respectively. The RSI indicates a value of 38.97, suggesting it is close to entering an oversold condition.

Relationship with Key Moving Averages
The NASDAQ Composite is trading below its 50-day EMA of 18,752.28 and 200-day EMA of 18,262.48, indicating a potential bearish trend. It is also just below its 10-day EMA of 17,799.70, and significantly below the 20-day EMA of 18,170.44, which may suggest short-term weakness.
Moving Averages Trend (MACD)
For NASDAQ Composite (US), the MACD is currently at -480.51, with a Signal line of -472.73. This indicates a bearish trend as the MACD is below the Signal line.

RSI Analysis
The Relative Strength Index (RSI) of the NASDAQ Composite is 38.97, indicating that it is in the lower range and may be approaching oversold conditions. An RSI below 30 typically suggests that a stock is considered oversold, while an RSI above 70 indicates it may be overbought. This relatively low RSI suggests caution, as it may imply potential buying opportunities if downward trends continue.

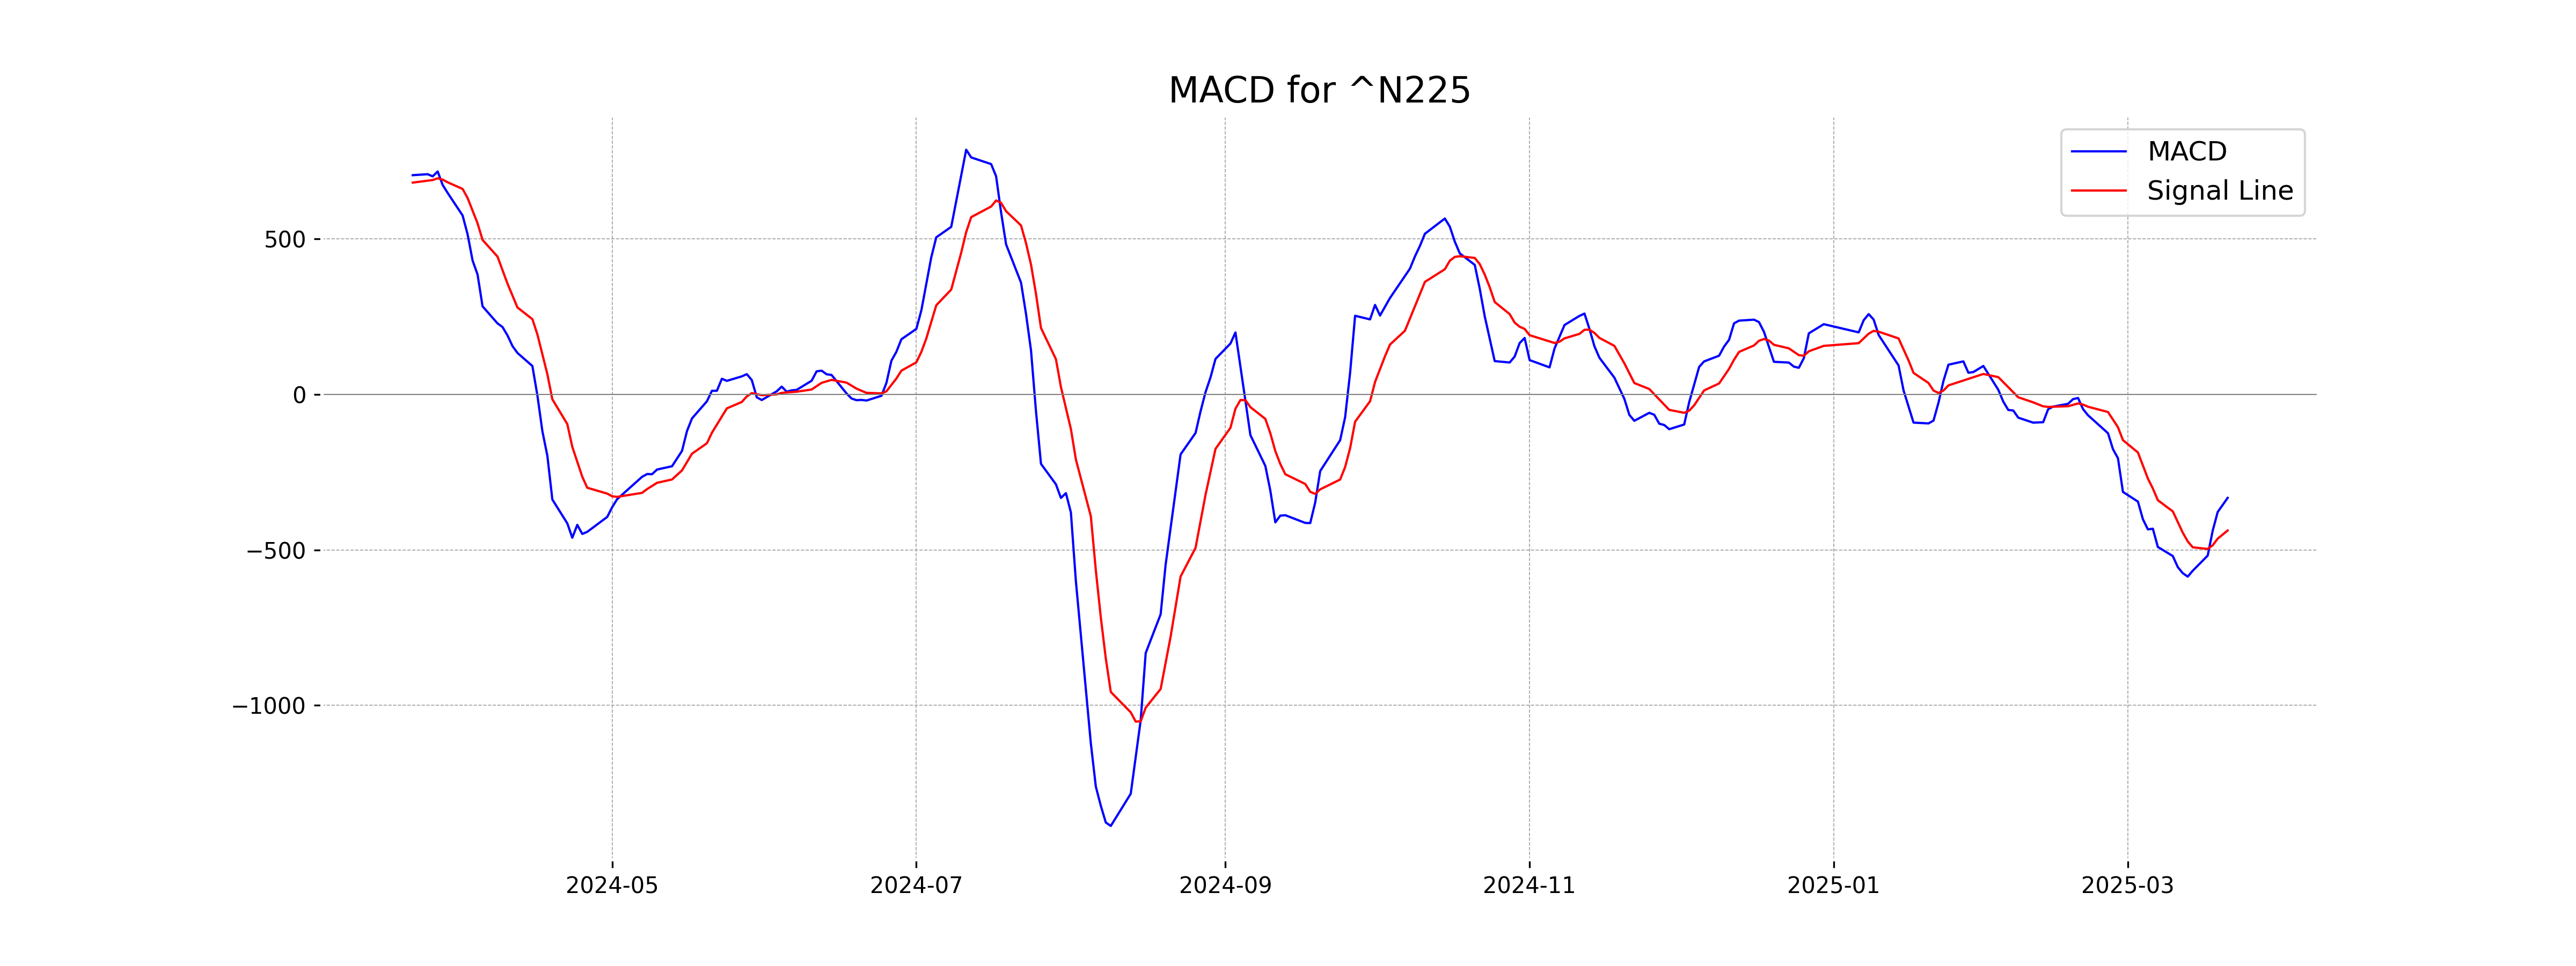
Analysis for Nikkei 225 (Japan) - March 21, 2025

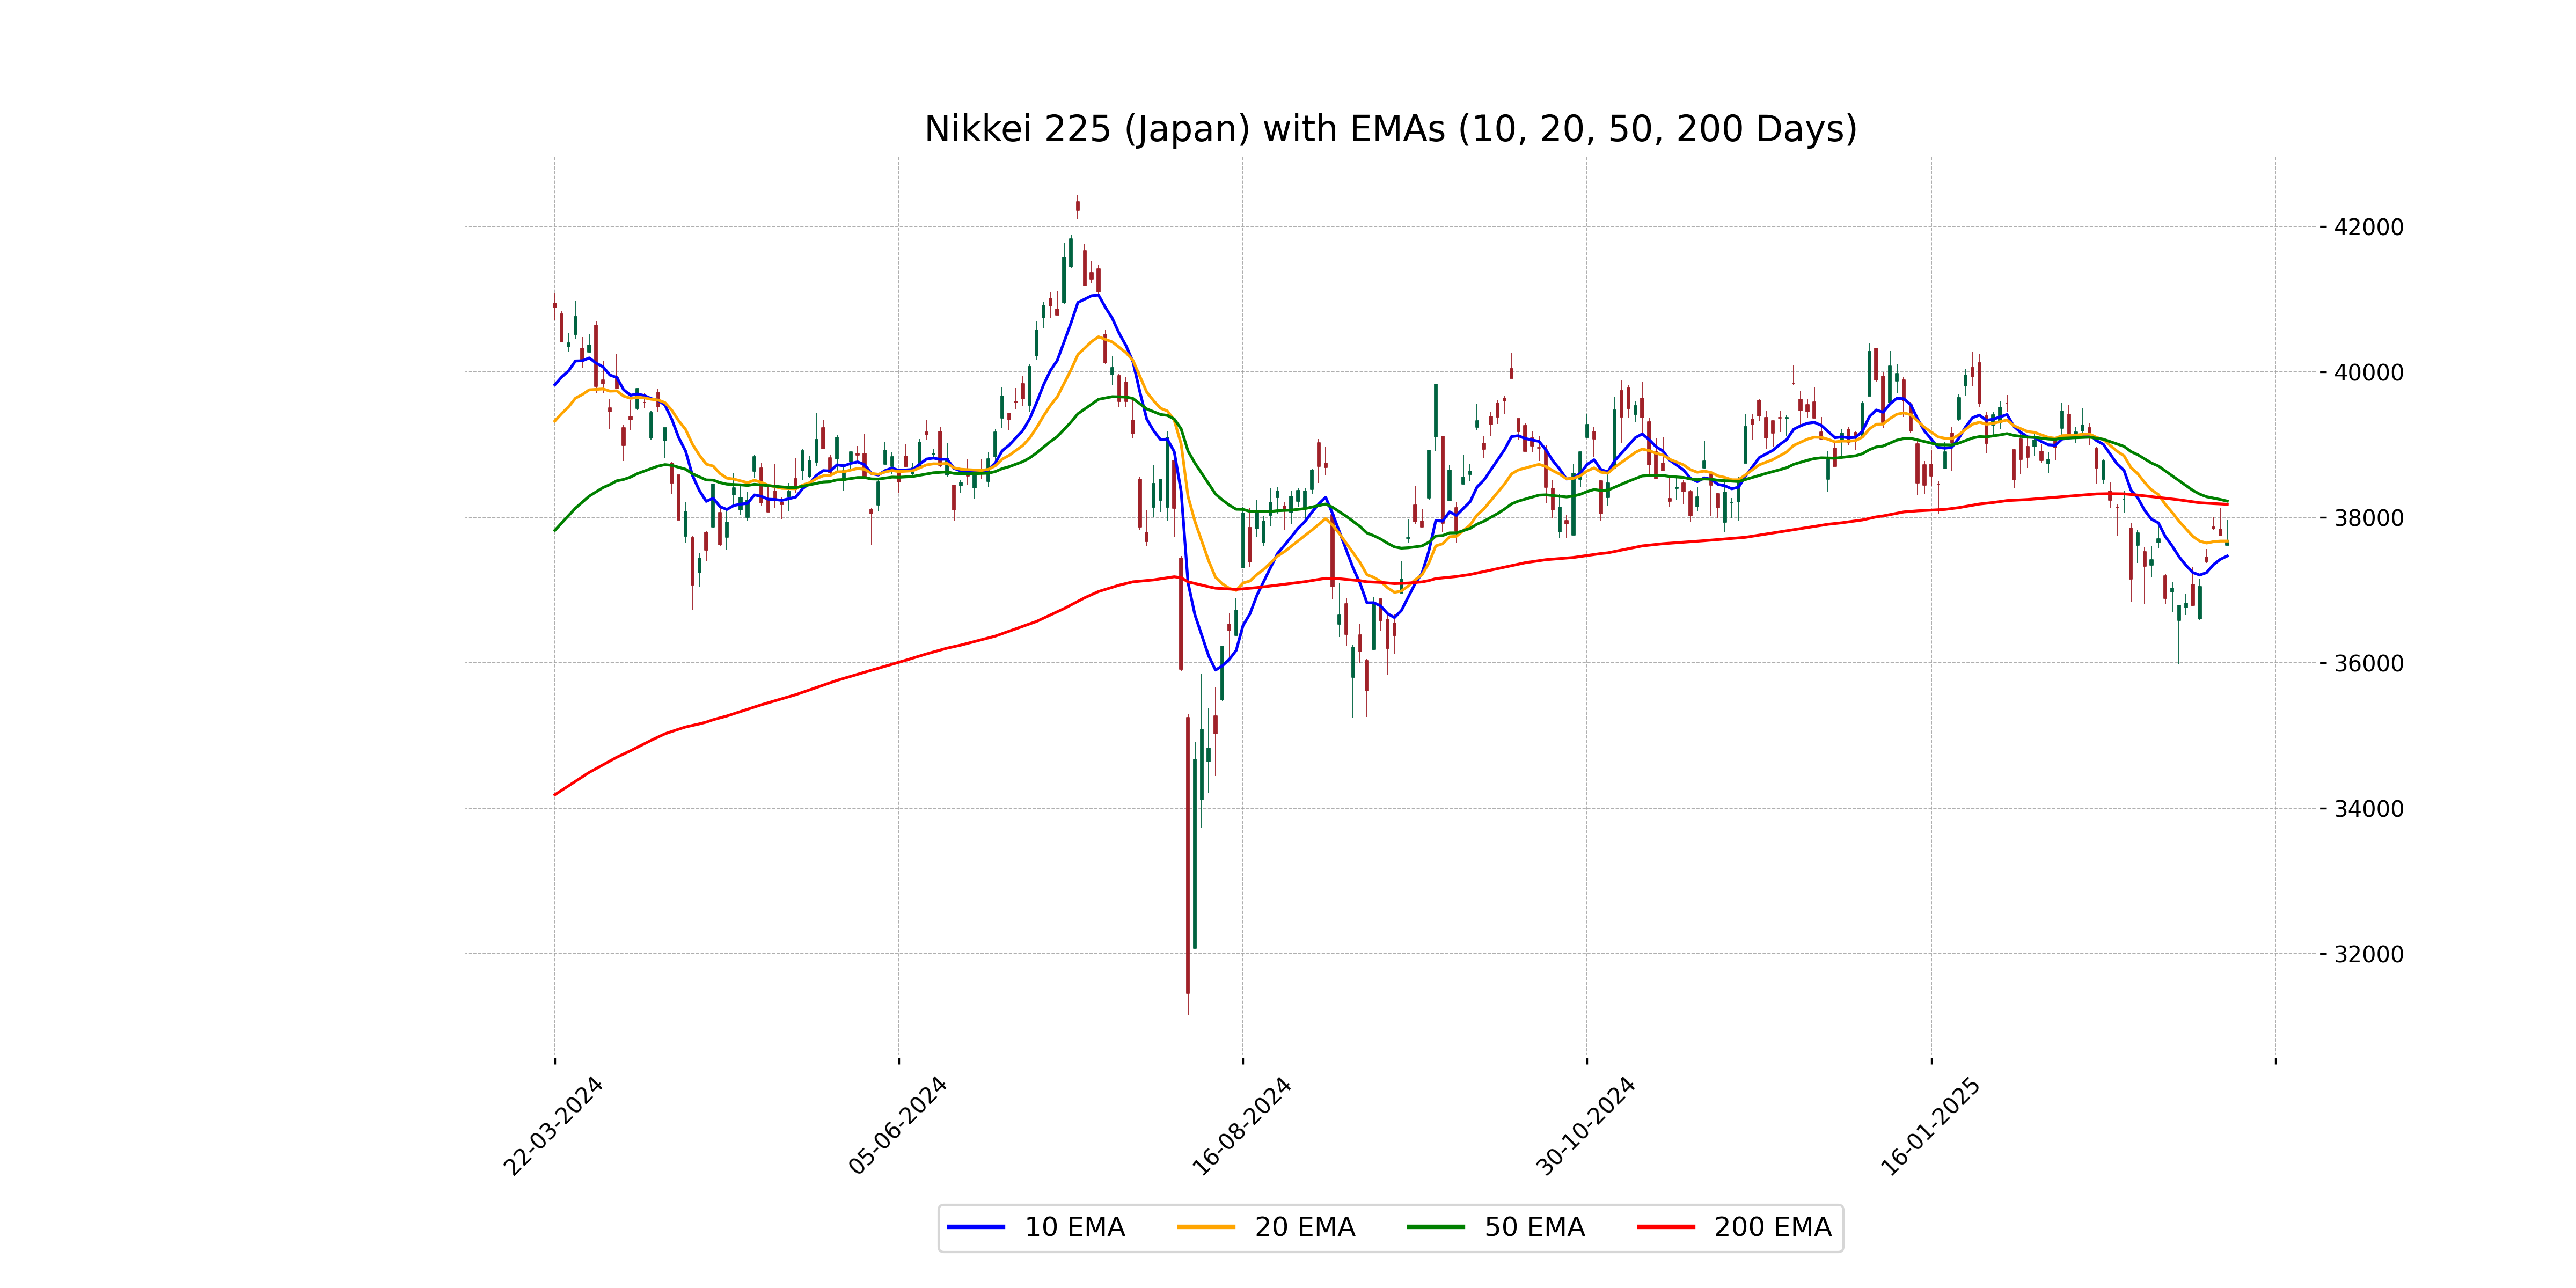
The Nikkei 225 (Japan) opened at 37,619.37 and closed slightly lower at 37,677.06, reflecting a modest decline with a -0.20% change from the previous close. The index experienced a points change of -74.82, with its RSI at 47.61 indicating a relatively neutral momentum. The MACD value is -332.92, below the signal line, suggesting potential bearish sentiment.
Relationship with Key Moving Averages
Nikkei 225 closed below both the 50-day EMA (38224.64) and the 200-day EMA (38181.40), indicating a bearish trend. However, it remained above the 10-day EMA (37470.68) and near the 20-day EMA (37675.35), suggesting potential short-term support.
Moving Averages Trend (MACD)
MACD Analysis for Nikkei 225 (Japan): The MACD for Nikkei 225 is -332.92, while the signal line is at -437.83. This indicates that the MACD line is above the signal line, suggesting a possible bullish crossover or a bullish trend. However, both values being negative may reflect a continuing bearish undertone overall.
RSI Analysis
Based on the stock data for Nikkei 225, the RSI (Relative Strength Index) is 47.61, indicating a neutral market condition since it is close to the midpoint of the traditional 30-70 range. This suggests that the index is neither overbought nor oversold at the moment.

Analysis for Nifty Bank - March 21, 2025

Nifty Bank exhibited a notable performance with a closing value of 50,593.55, registering a gain of 1.06% compared to the previous close. The index achieved a high of 50,672.15 and a low of 49,891.95 during the trading session. Technical indicators such as the RSI stand at 68.20, suggesting a bullish momentum.

Relationship with Key Moving Averages
Nifty Bank closed at 50,593.55, which is above the 50-day EMA of 49,347.81 and the 200-day EMA of 49,906.25, indicating a bullish trend. Additionally, it is trading higher than the 10-day EMA of 49,254.32 and the 20-day EMA of 49,030.79, suggesting short-term momentum to the upside.
Moving Averages Trend (MACD)
The MACD for Nifty Bank is positive at 120.12, with a MACD Signal at -161.75, indicating a potential bullish trend as the MACD line is above the signal line. However, it is essential to monitor as the RSI is relatively high at 68.20, suggesting the index might be close to overbought conditions.

RSI Analysis
The Relative Strength Index (RSI) for Nifty Bank is 68.20, which indicates that the stock is approaching overbought conditions. An RSI above 70 is typically considered overbought, suggesting that the stock may be due for a pullback or consolidation in the near term.

Analysis for Nifty 50 - March 21, 2025

Nifty 50 opened at 23,168.25, reached a high of 23,402.70, and closed at 23,350.40 with a % change of 0.69% from the previous close. The Relative Strength Index (RSI) is at 66.18, indicating a potentially strong momentum. The volume for the trading session was 0. The index is currently above its 50-day EMA of 23,012.70 but slightly below the 200-day EMA of 23,401.50.

Relationship with Key Moving Averages
Nifty 50 closed above its 50-day EMA (23012.70) and below its 200-day EMA (23401.50), indicating a short-term positive trend but still relatively weak in a longer-term context. The close value (23350.40) is near the 200-day EMA, which may act as a resistance level.
Moving Averages Trend (MACD)
The MACD value for Nifty 50 is 0.52, indicating a potential bullish trend as it is above the MACD signal line, which is at -131.71. This suggests that the recent momentum in the market is positive. However, the significant difference between the MACD and its signal line should be considered as it might indicate volatility.

RSI Analysis
Based on the RSI value of 66.18, Nifty 50 indicates a moderately strong uptrend but is approaching the overbought territory, which typically ranges above 70. Investors may want to monitor the index closely for potential signs of a reversal or continued upward momentum.

Up Next
Global stock market indices: How the world markets performed today - 21 March 2025

Microsoft commits USD 17.5 billion investment in India: CEO Satya Nadella

CBI books Anil Ambani's son, Reliance Home Finance Ltd. in Rs 228 crore bank fraud case

RBI raises FY26 GDP growth projection to 7.3 pc

RBI trims policy interest rate by 25bps to 5.25pc, loans to get cheaper

Rupee slumps to all-time low of 90.25 against US dollar in intra-day trade

More videos

Reliance completes merger of Star Television Productions with Jiostar

India to lead emerging market growth with 7pc GDP rise in 2025: Moody’s

Nifty hits record high after 14 months; Sensex nears all-time peak

Reliance stops Russian oil use at its only-for-export refinery to comply with EU sanctions

ED attaches fresh assets worth over Rs 1,400 cr in case against Anil Ambani's Reliance Group

India signs one-year deal to import 2.2 million tonnes of LPG from US

India International Trade Fair begins at Pragati Maidan amid tight security

Stock markets decline in initial trade on foreign fund outflows, weak Asian peers

Amazon to lay off 30,000 office workers amid AI-driven cost cuts

US sanctions on Russian firms to hit Reliance; PSUs likely to keep buying Russian oil via traders