


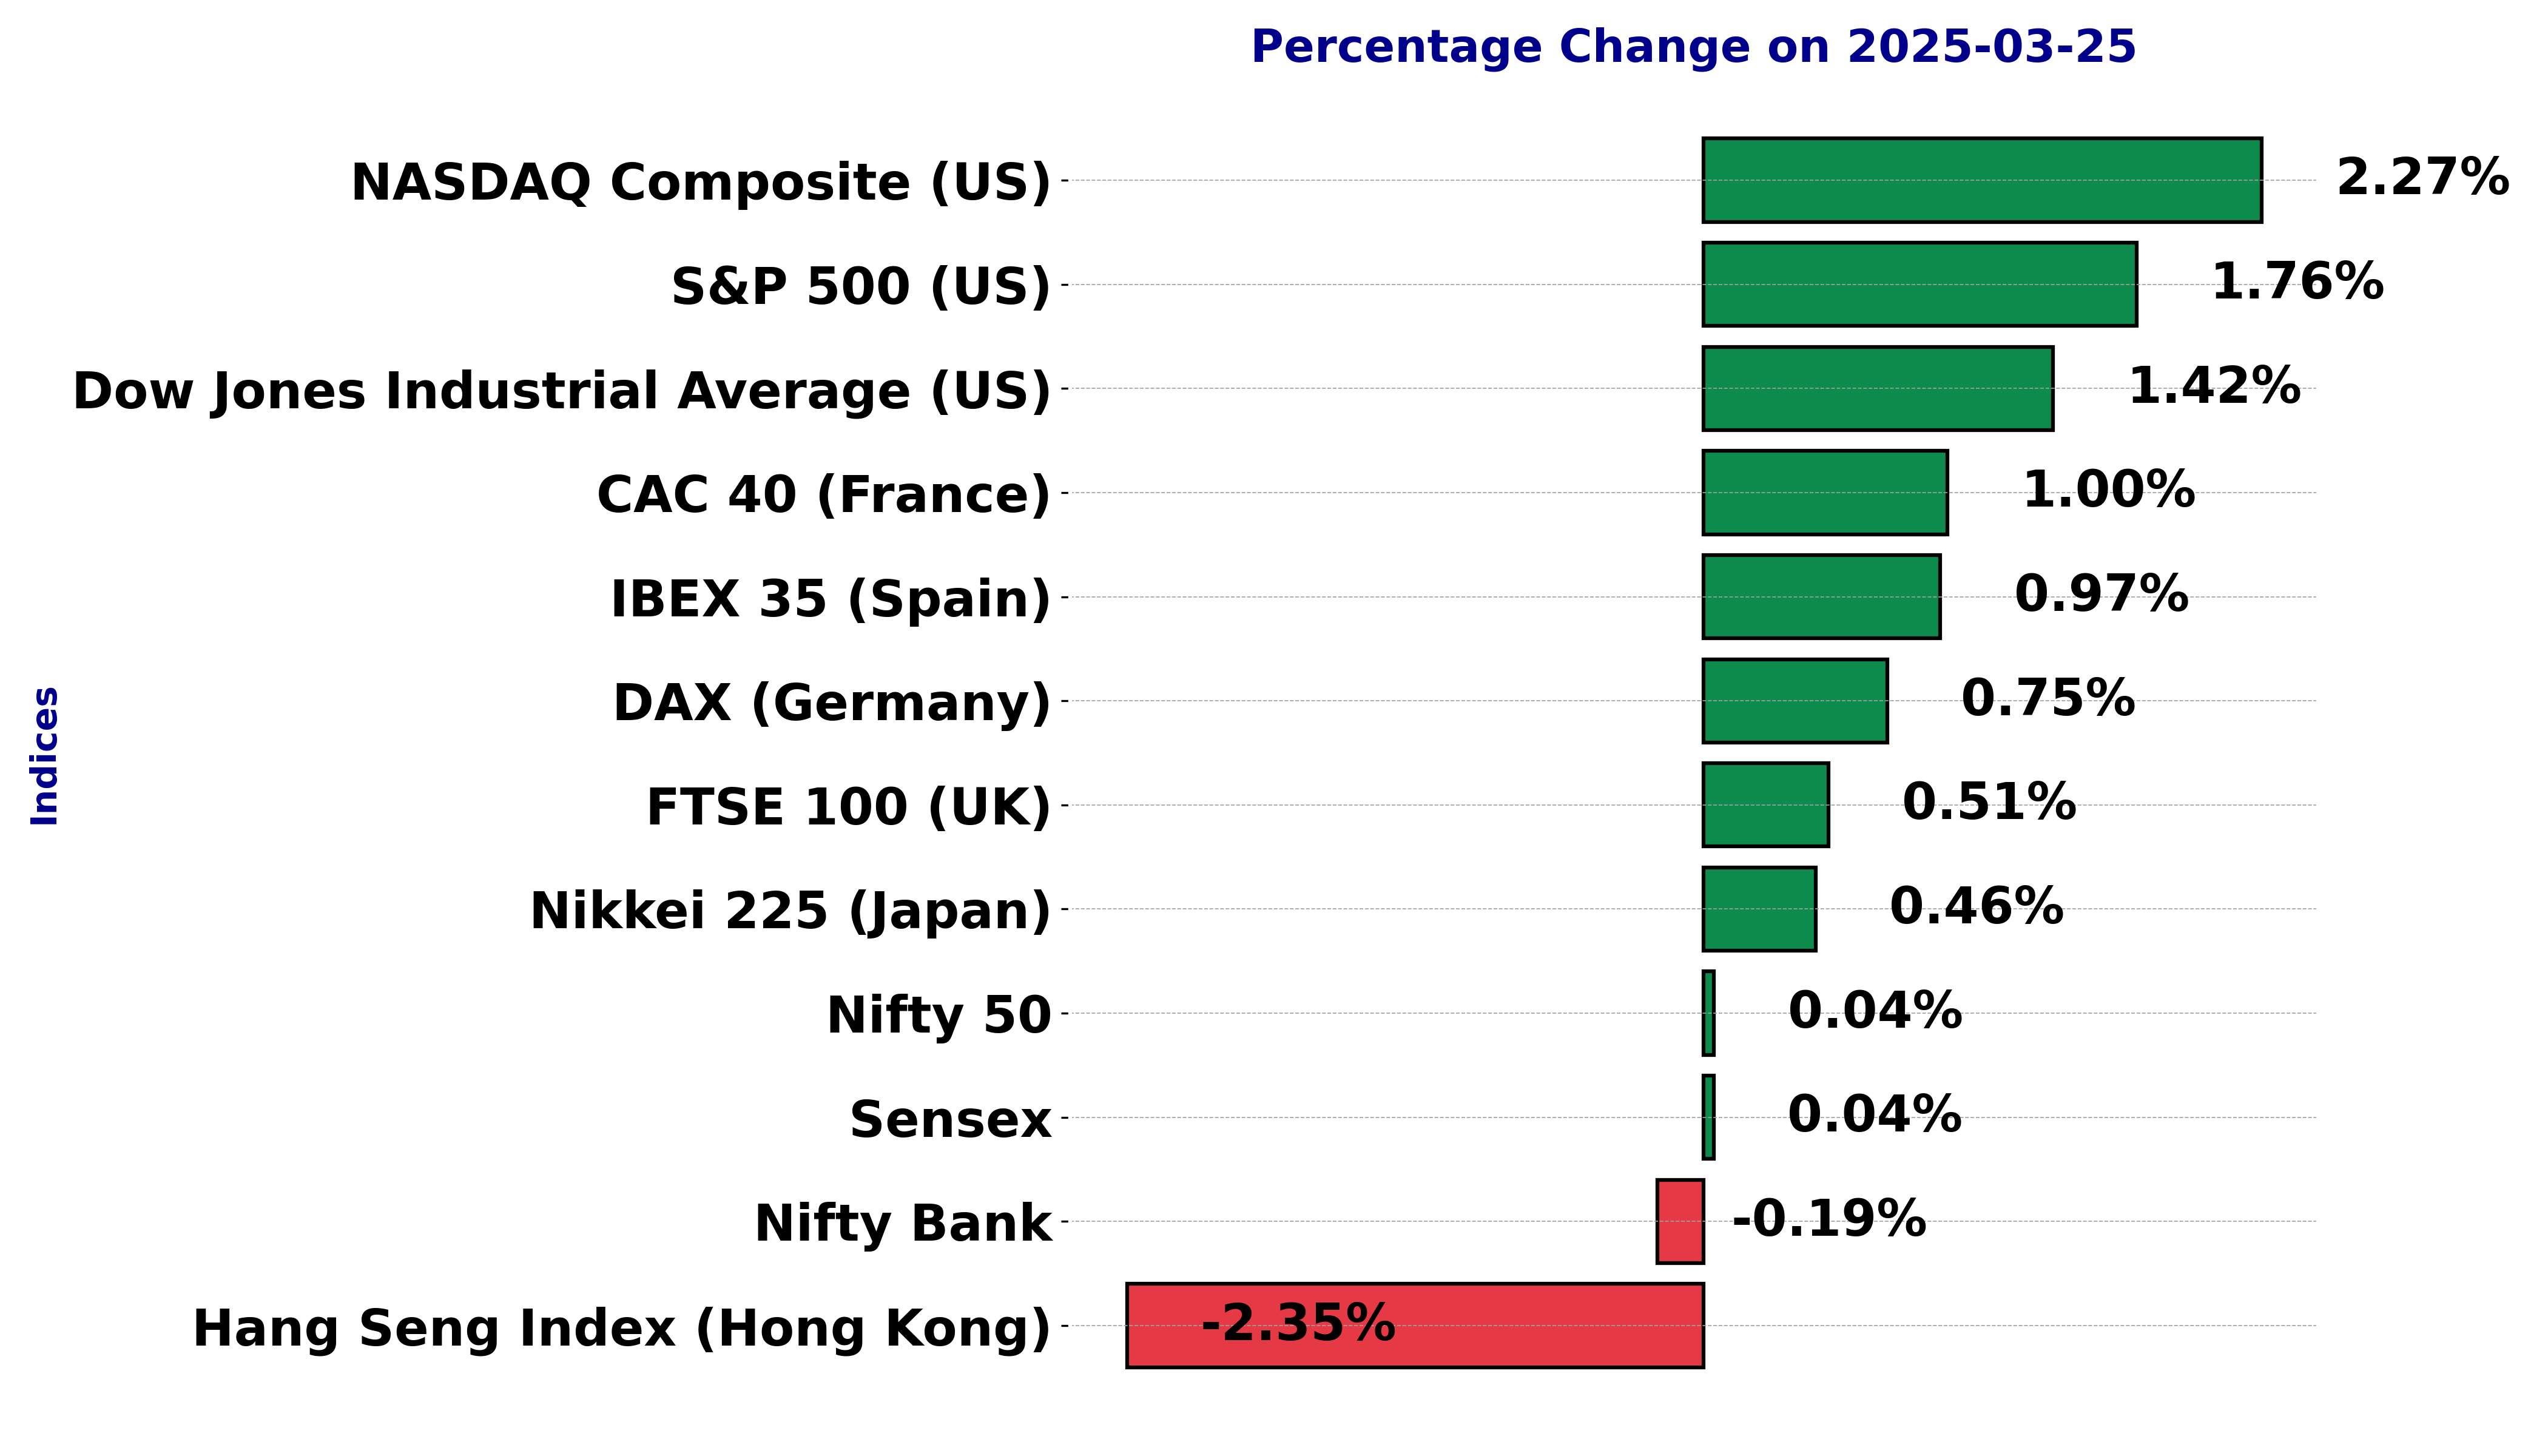
Highlights
- DAX closes at 23,024.08, maintaining bullish momentum
- Dow Jones gains 1.42%, showing short-term strength
- Hang Seng drops 2.35%, indicating bearish sentiment
Latest news

Opposition unites with government after Pahalgam massacre

Politics shadows cricket, PSL faces hurdles

Karnataka bids goodbye to Pahalgam terror martyrs

Manipur youth Congress slams BJP over Pahalgam attack

Blood, water can’t flow together: Pushkar Singh Dhami

India marks a final day of mourning for Pope Francis

New book explores 150 years of test cricket

Pakistan declares Indian water diversion war act
Global stock market indices: How the world markets performed today - 25 March 2025


The international stock market indices showed varied performances on March 25, 2025, reflecting the economic sentiment across different regions.
In this article, we analyze the performance of key global indices including the S&P 500, Dow Jones Industrial Average, NASDAQ Composite, FTSE 100, DAX, CAC 40, IBEX 35, Nikkei 225, Hang Seng, Nifty 50, and BSE Sensex.
Analysis for Sensex - March 25, 2025

The Sensex opened at 78,296.28 and closed slightly higher at 78,017.19, marking a modest gain with a points change of 32.80 and a percentage change of 0.042%. The RSI is at 71.30, indicating the index might be in overbought territory, while the MACD value of 345.83 suggests a bullish momentum.

Relationship with Key Moving Averages
The Sensex closed at 78017.19, which is above its 50 EMA (76118.94), 10 EMA (76153.66), 20 EMA (75614.19), and 200 EMA (77166.53). This indicates a bullish trend as the current price exceeds all key moving averages.
Moving Averages Trend (MACD)
MACD Analysis for Sensex The MACD for Sensex stands at 345.83, with a signal line of -216.87. This positive MACD value and the separation from the signal line suggest a strong bullish momentum in the current market trend.

RSI Analysis
The Relative Strength Index (RSI) for Sensex is 71.30, indicating that the market is currently in overbought territory. Typically, an RSI above 70 suggests that the stock may be overvalued, potentially signaling a reversal or pullback in the near future.

Analysis for Dow Jones Industrial Average (US) - March 25, 2025
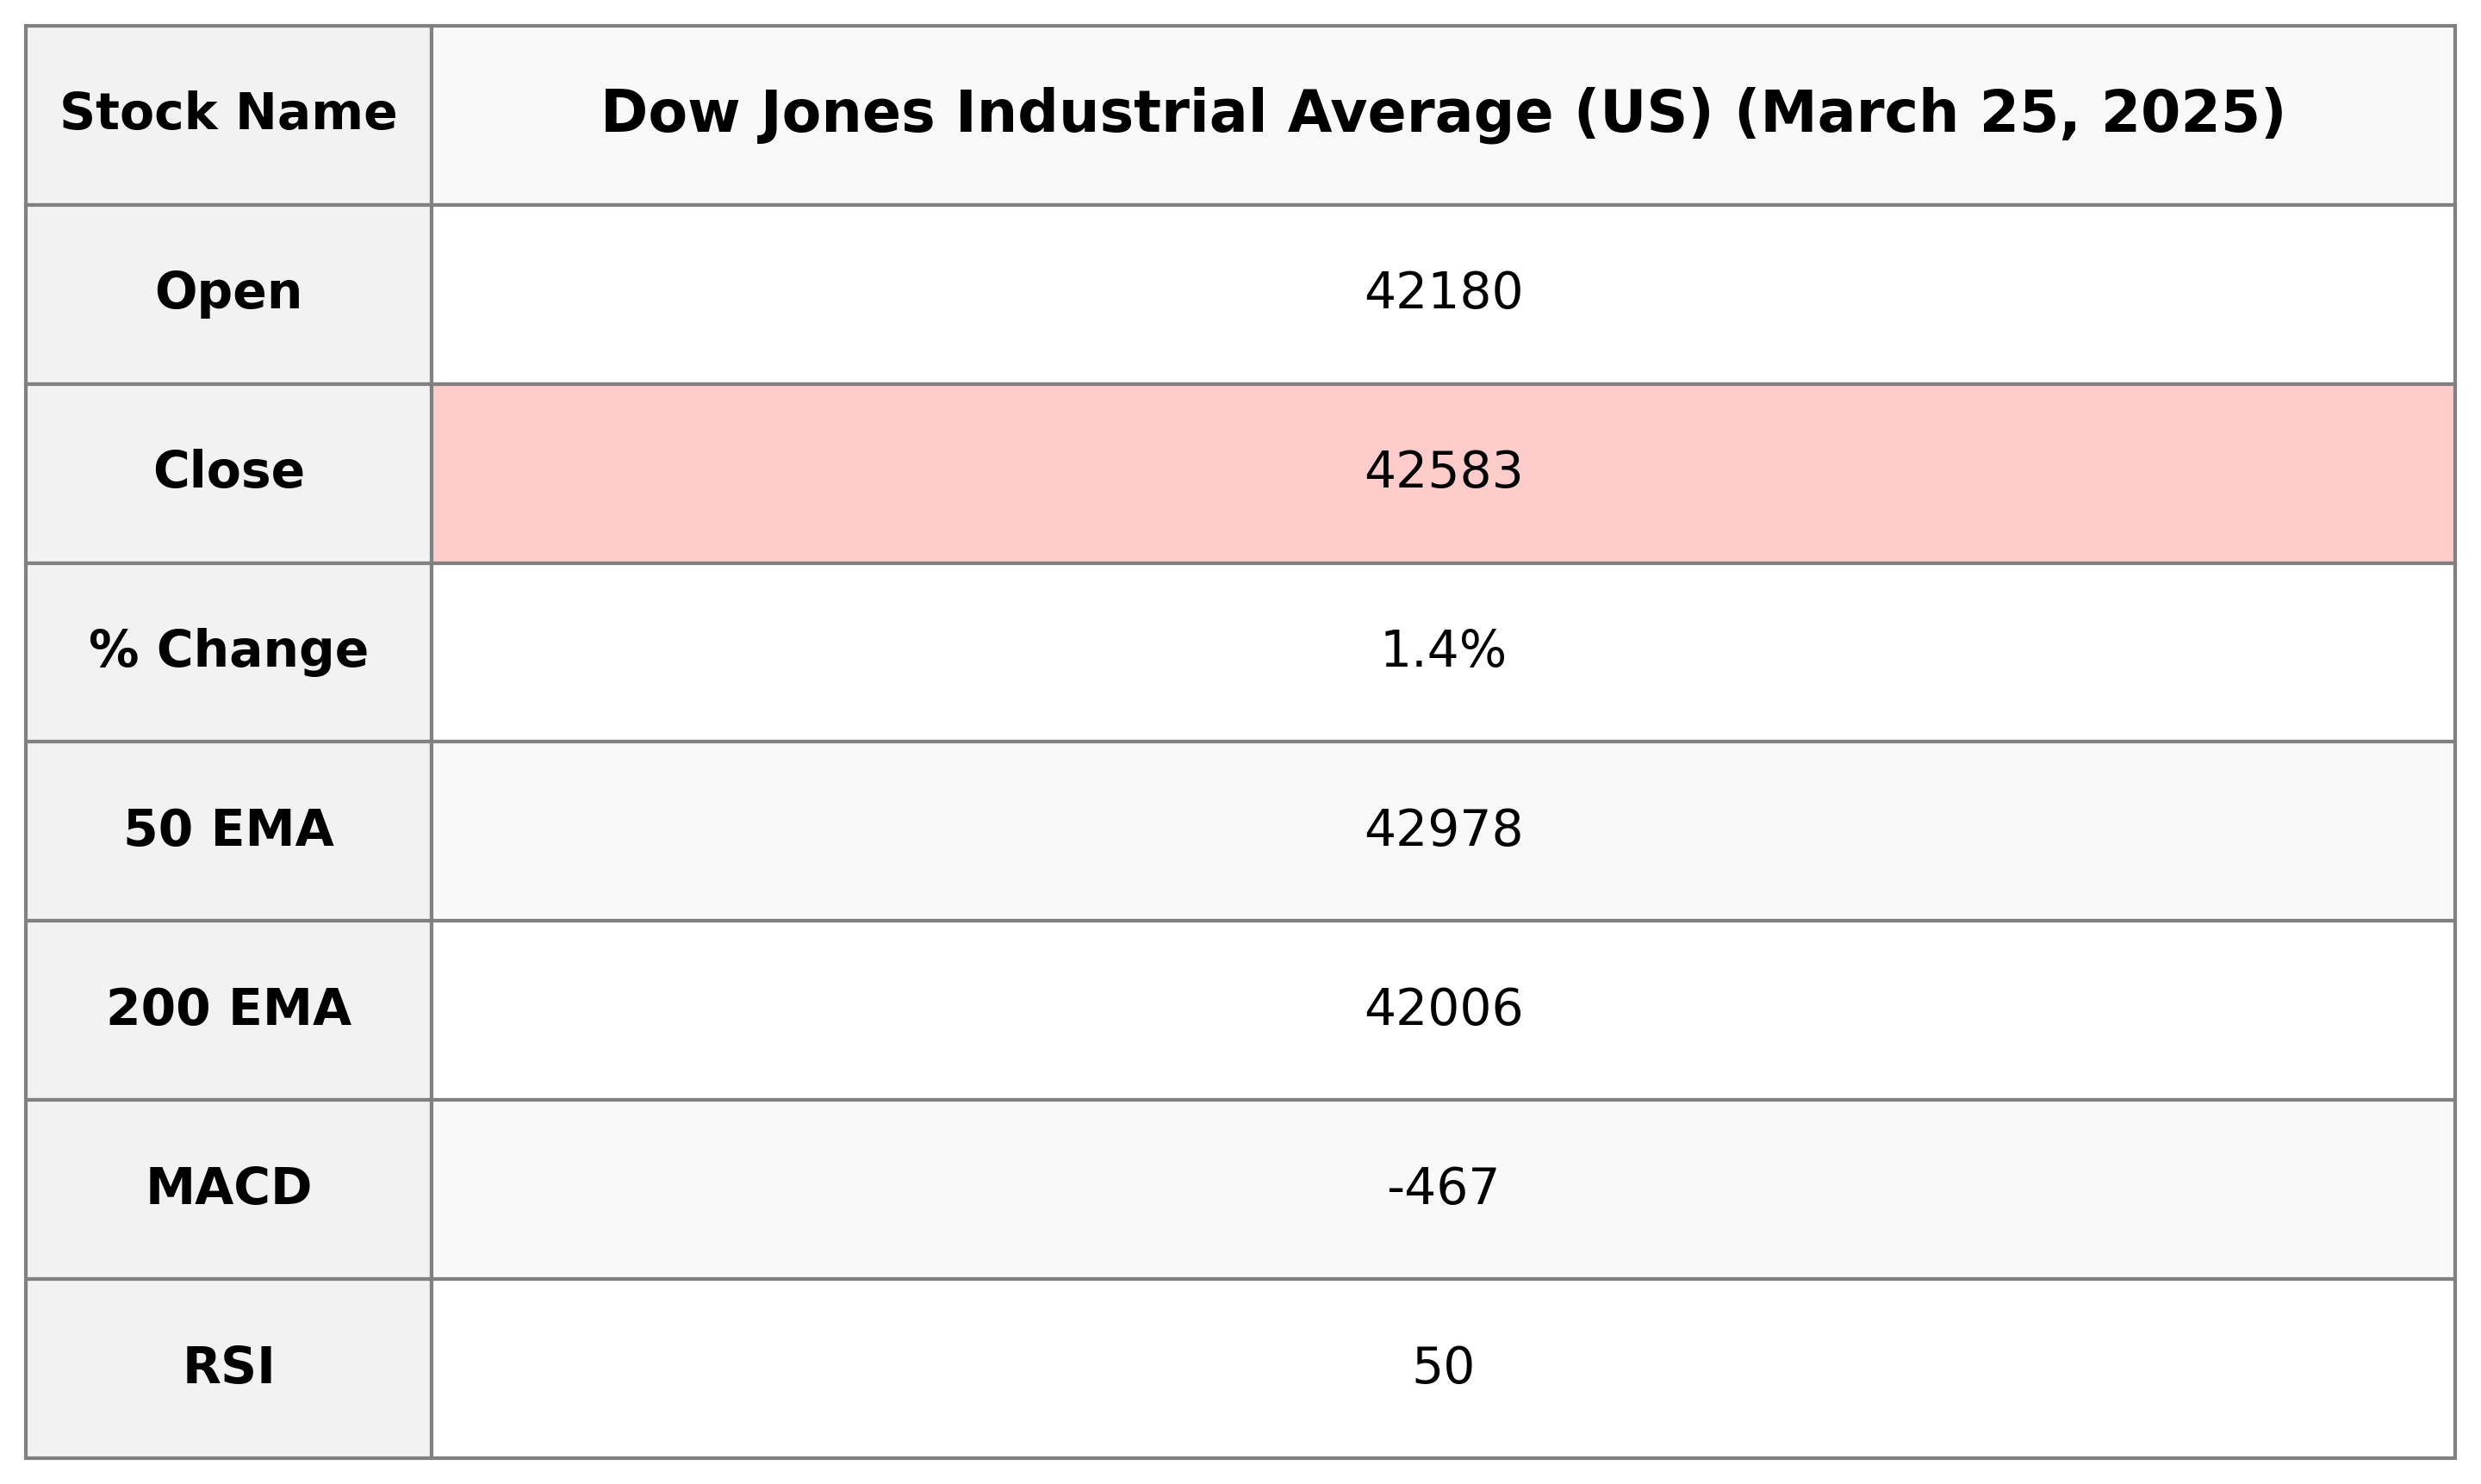
The Dow Jones Industrial Average (US) opened at 42,180.14, experienced a high of 42,638.85, and closed at 42,583.32, marking a 1.42% increase from its previous close. The RSI stands at 49.84, indicating a neutral momentum, while the MACD suggests a bearish trend. The volume of 548,840,000 shares reflects significant trading activity.

Relationship with Key Moving Averages
The Dow Jones Industrial Average opened at 42,180.14 and closed at 42,583.32, which is below its 50-day EMA of 42,977.67 but above its 10-day and 20-day EMAs, indicating a potential short-term bullish trend. However, it is also above the 200-day EMA of 42,005.75, suggesting a long-term positive outlook despite the below-average RSI of 49.84 indicating neutral momentum.
Moving Averages Trend (MACD)
The MACD for the Dow Jones Industrial Average stands at -467.20, with a MACD Signal of -549.25. This indicates a potential bullish trend as the MACD is above its signal line. However, the MACD is still in negative territory, suggesting that bearish momentum is not completely exhausted.

RSI Analysis
The RSI for the Dow Jones Industrial Average is 49.84. This value suggests that the index is currently in a neutral zone, indicating neither overbought nor oversold conditions. Investors might look for further signals before making decisions on this index.

Analysis for CAC 40 (France) - March 25, 2025
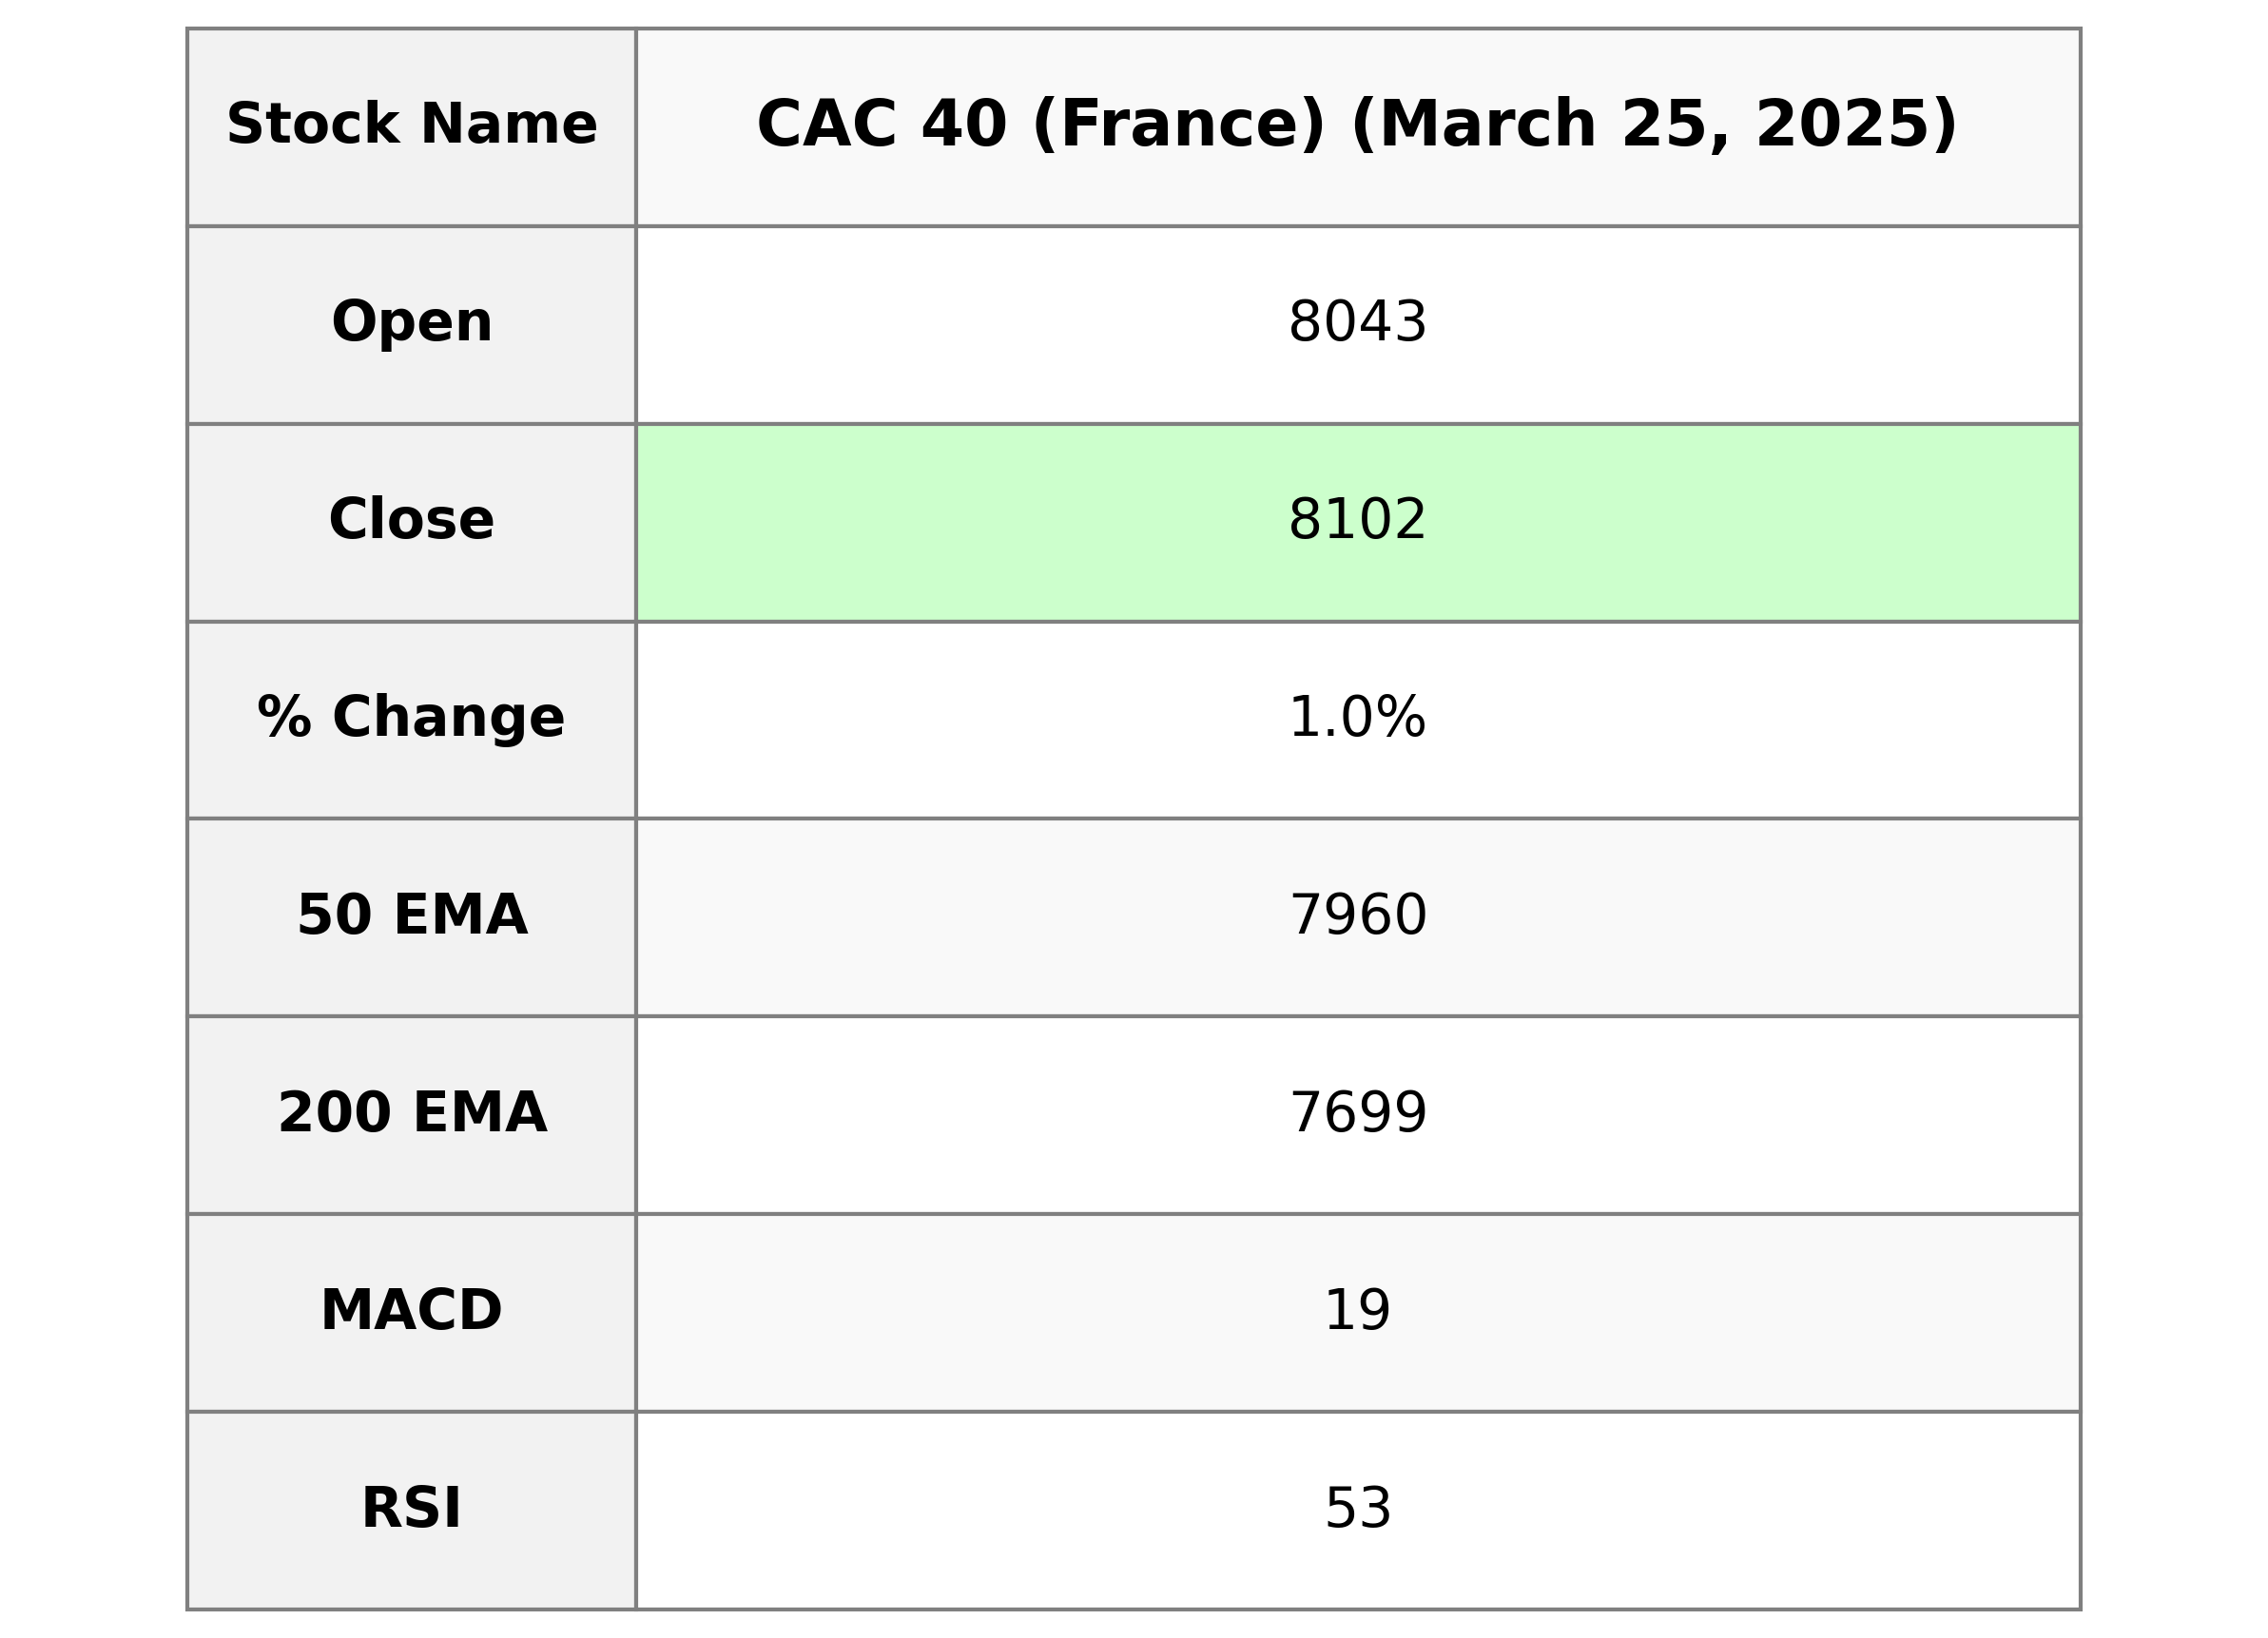
CAC 40 (France) Performance: On the given day, the CAC 40 opened at 8042.73 and closed higher at 8102.21, resulting in a positive change of approximately 0.996%. The index saw a high of 8102.73 and with a closing price that increased by 79.88 points from the previous close of 8022.33. The RSI indicates a neutral momentum at 53.36, while the MACD trend suggests a slightly bearish outlook with the MACD below the signal line.

Relationship with Key Moving Averages
For the CAC 40 index (France), the closing price of 8102.21 is above its 10 EMA of 8072.24 and 20 EMA of 8067.01, indicating a short-term bullish trend. Additionally, the price is also above the 50 EMA of 7959.69 and the 200 EMA of 7699.15, which suggests a sustained upward momentum.
Moving Averages Trend (MACD)
The MACD for CAC 40 (France) is 19.12, which is below the MACD Signal of 28.47, indicating a potential bearish signal. This suggests that the current momentum may be slowing down, and traders might consider being cautious in their bullish expectations.

RSI Analysis
The RSI (Relative Strength Index) for the CAC 40 (France) is 53.36, indicating a neutral market condition. This suggests that the market is neither in an overbought nor oversold state, allowing for potential upward or downward movement depending on market forces.

Analysis for FTSE 100 (UK) - March 25, 2025

FTSE 100 (UK) opened at 8638.01 and closed at 8682.06, marking a 0.51% gain with a points change of 44.06. The index has a 10-day EMA of 8663.30 and a 20-day EMA of 8664.86, indicating bullish momentum with an RSI of 52.36.

Relationship with Key Moving Averages
FTSE 100 (UK) closed above its 50 EMA and significantly above its 200 EMA, indicating a potential bullish trend in the medium to long term. However, it remains close to its 10 EMA and 20 EMA, suggesting that the recent price action has been relatively stable.
Moving Averages Trend (MACD)
FTSE 100 (UK) MACD Analysis: The MACD for FTSE 100 is at 4.16, which is below the MACD Signal line at 7.07. This suggests a bearish trend or possible selling pressure.

RSI Analysis
Relative Strength Index (RSI) Analysis for FTSE 100 (UK): The FTSE 100's RSI value is 52.36, indicating a neither overbought nor oversold condition, suggesting a relatively neutral market momentum. This positioning implies that the market may not experience significant price changes soon unless other indicators suggest otherwise.

Analysis for DAX (Germany) - March 25, 2025

The DAX (Germany) index opened at 22,913.42, reached a high of 23,031.34, and a low of 22,845.52, closing at 23,024.08. It experienced a percentage change of approximately 0.75% from the previous close, with a point change of 171.42. The 10-day EMA is at 22,960.64, indicating a slightly bullish trend, while the RSI stands at 55.51, suggesting neutral momentum.

Relationship with Key Moving Averages
The DAX (Germany) index is trading above its 10 EMA and 20 EMA, indicating a short-term bullish trend. However, the index is significantly above its 50 EMA and 200 EMA, suggesting a strong overall upward momentum in the medium to long term. The RSI of 55.51 suggests that the index is neither overbought nor oversold.
Moving Averages Trend (MACD)
The MACD for DAX (Germany) shows a value of 233.48, which is below its MACD Signal of 278.67. This indicates a bearish trend, suggesting potential downward momentum in the short term.

RSI Analysis
DAX RSI Analysis: The Relative Strength Index (RSI) for the DAX is 55.51, suggesting a neutral-leaning market stance. This value indicates that the DAX is neither overbought nor oversold, providing a balanced outlook for potential future movements.

Analysis for S&P 500 (US) - March 25, 2025

S&P 500 (US) opened at 5718.08 and closed higher at 5767.57, marking a percentage change of 1.76% with a point increase of 100.01. Despite a relatively high volume of 4.52 billion, the index's RSI at 49.10 suggests neutral momentum, while the MACD indicates a short-term bearish trend.

Relationship with Key Moving Averages
The S&P 500 (US) closed at 5767.57, which is below its 50-day EMA of 5848.998 but above its 200-day EMA of 5704.551. This indicates a short-term bearish trend, though it remains above the longer-term moving average, suggesting potential support around the 200-day EMA.
Moving Averages Trend (MACD)
The MACD for S&P 500 (US) is -78.78, which is below the MACD Signal line of -91.57, indicating a potential bullish crossover soon. The negative MACD suggests bearish momentum is slowing.

RSI Analysis
RSI Analysis for S&P 500 (US): The Relative Strength Index (RSI) value is 49.10, indicating that the market is neither overbought nor oversold. Typically, an RSI below 30 suggests oversold conditions, while an RSI above 70 indicates overbought conditions. With the RSI near the midpoint, the S&P 500 is in a neutral state.

Analysis for Hang Seng Index (Hong Kong) - March 25, 2025

The Hang Seng Index (Hong Kong) opened at 23,643.32 and closed at 23,344.25, experiencing a decline of 561.31 points, which corresponds to a percentage change of -2.35%. The moving averages indicate a short-term bearish trend, with the 10-day EMA above the current closing price, while the RSI suggests a balanced momentum at around 49.87.

Relationship with Key Moving Averages
The Hang Seng Index closed at 23,344.25, below its 10-day EMA of 23,882.58, indicating short-term bearish sentiment. It is trading above its 50-day EMA of 22,540.35 and significantly above its 200-day EMA of 20,246.73, which suggests a positive long-term trend. However, the close below the 20-day EMA of 23,626.92 reflects potential weakness in the medium term.
Moving Averages Trend (MACD)
MACD Analysis for Hang Seng Index (Hong Kong): The Moving Average Convergence Divergence (MACD) value for Hang Seng Index is 462.03, which is below the MACD Signal value of 615.77. This indicates a bearish momentum as the MACD line is below the signal line, suggesting potential downside movement in the near term.

RSI Analysis
RSI Analysis: The Relative Strength Index (RSI) for the Hang Seng Index is at 49.87, indicating a neutral momentum. This value suggests neither overbought nor oversold conditions, implying that the market is relatively balanced and could move in either direction based on new information or external factors.

Analysis for IBEX 35 (Spain) - March 25, 2025

The IBEX 35 opened at 13,370.5 and closed at 13,452.0, showing a positive change of approximately 0.97% from its previous close of 13,323.30. The index experienced a range with a high of 13,455.70 and a low of 13,368.80 during the session. Significant indicators include an RSI of 63.78, suggesting moderate strength, and a MACD over its signal line, indicating potential upward momentum.

Relationship with Key Moving Averages
The IBEX 35 closed significantly above its 10 EMA and 20 EMA, indicating positive short-term momentum. Additionally, it is trading well above its 50 EMA and 200 EMA, suggesting a strong upward trend in longer-term momentum and potential bullish outlook.
Moving Averages Trend (MACD)
The MACD value of 152.90, which is above the signal line at 147.72, suggests a bullish momentum for the IBEX 35 index. This implies that the recent upwards trend in the index might continue in the short term.

RSI Analysis
The RSI for the IBEX 35 (Spain) is 63.78, indicating a moderately strong upward momentum. It is approaching the overbought threshold of 70, suggesting potential caution if the trend continues upward without significant pullbacks.

Analysis for NASDAQ Composite (US) - March 25, 2025

NASDAQ Composite (US) showed a positive performance with a closing value of 18188.59, reflecting a 2.27% increase or a gain of 404.54 points compared to the previous close of 17784.05. The trading volume was approximately 6,787,790,000. The index exhibited a neutral RSI of 47.80 with MACD indicating short-term bearish momentum.

Relationship with Key Moving Averages
The Nasdaq Composite's current close of 18188.59 is below its 50 EMA of 18693.69 and 200 EMA of 18257.17, indicating a bearish trend in the longer term. However, it is above the 10 EMA of 17868.08 and close to the 20 EMA of 18138.87, suggesting near-term recovery potential.
Moving Averages Trend (MACD)
The MACD for the NASDAQ Composite is at -392.25, with a signal line at -453.32. This suggests a potential bullish crossover as the MACD has moved closer to the signal line, indicating possible upward momentum.

RSI Analysis
Stock Name: NASDAQ Composite RSI Analysis: The Relative Strength Index (RSI) for the NASDAQ Composite is currently 47.80, which suggests a neutral trend as it is close to 50. This level indicates that the index is neither overbought nor oversold.

Analysis for Nikkei 225 (Japan) - March 25, 2025

Nikkei 225 (Japan) Performance Summary: On the latest trading day, Nikkei 225 opened at 37,953.15, reached a high of 38,115.65, and closed at 37,780.54, marking a positive change of 0.46% (172.05 points) from the previous close. Despite the gain, the index remains below the 50 and 200 EMA, with an RSI of 49.29 suggesting a neutral momentum. The MACD indicates a bearish trend being below the signal line.

Relationship with Key Moving Averages
The Nikkei 225 is currently closing below both its 50-EMA (38184.01) and 200-EMA (38172.03), indicating a potential bearish trend or consolidation phase. However, it is closing above the 10-EMA (37547.52) and 20-EMA (37679.61), suggesting some short-term bullish momentum or support.
Moving Averages Trend (MACD)
MACD Analysis for Nikkei 225 (Japan): The MACD is currently at -255.26, indicating a bearish sentiment as it is below the MACD Signal line at -379.10. This suggests a potential downward momentum, though the MACD line moving closer to the signal line might indicate a possible reversal or weakening of the bearish trend.

RSI Analysis
RSI Analysis for Nikkei 225 (Japan): The Relative Strength Index (RSI) is currently at 49.29, which indicates that the index is in a neutral zone. It is neither oversold nor overbought, suggesting there is no strong momentum in either direction at the moment.

Analysis for Nifty Bank - March 25, 2025

Nifty Bank opened at 51874.20 and closed at 51607.95, indicating a slight decrease with a points change of -97. The stock experienced a mild decline of -0.19% on the given day, with a higher RSI value of 73.37, which may suggest an overbought condition. The MACD stands at 454.63, showing a positive divergence from the signal line.

Relationship with Key Moving Averages
The closing price of Nifty Bank at 51,607.95 is above the 50-day EMA of 49,525.26 and the 200-day EMA of 49,941.33, indicating an overall bullish trend. However, it is lower than the 10-day EMA of 50,046.81, but still above the 20-day EMA of 49,506.66, suggesting a slight pullback in a broader upward movement.
Moving Averages Trend (MACD)
MACD Analysis for Nifty Bank: The MACD value is 454.63, significantly above the MACD Signal of 37.65, indicating a strong bullish momentum. This divergence suggests that the stock is in an upward trend.

RSI Analysis
The RSI value for Nifty Bank is 73.37, which indicates that the stock is in the overbought territory, suggesting that a price correction might occur in the short term. This level implies strong bullish momentum, but caution is advised as it may lead to potential selling pressure.

Analysis for Nifty 50 - March 25, 2025

Nifty 50 opened at 23,751.5 and closed slightly higher at 23,668.65, gaining 10.30 points or 0.04% compared to its previous close of 23,658.35. The index recorded a high of 23,869.60 and a low of 23,601.40, with a strong RSI of 71.52 suggesting it is in the overbought zone. The MACD at 123.50 and its signal at -48.48 indicate bullish momentum.

Relationship with Key Moving Averages
Nifty 50, with a closing of 23668.65, is trading above its 50 EMA at 23062.75 and 200 EMA at 23406.87, indicating a bullish trend. The current level is also above the 10 EMA at 23105.12 and the 20 EMA at 22926.39, reinforcing short-term bullish momentum.
Moving Averages Trend (MACD)
The MACD value is 123.50 and the MACD Signal is -48.48, indicating a strong bullish trend for Nifty 50. The positive MACD line above the signal line suggests upward momentum in the market.

RSI Analysis
Nifty 50 RSI Analysis: The Relative Strength Index (RSI) for Nifty 50 is at a level of 71.52, indicating that the index is in overbought territory. This suggests that the market could be overvalued, and a correction might be expected if the trend continues.

Up Next

Global stock market indices: How the world markets performed today - 25 March 2025

Indian stock market sector-wise performance today - April 24 2025

Top 5 Nifty 50 gainers today – April 24, 2025: Biggest stock moves
NSE Nifty 50: Top 5 stock losers of April 24, 2025

Global stock market indices: How the world markets performed today - 23 April 2025

Indian stock market sector-wise performance today - April 23, 2025

More videos

Top 5 Nifty 50 gainers today – April 23, 2025: Biggest stock moves

NSE Nifty 50: Top 5 stock losers of April 23, 2025

Sensex, Nifty rise for 6th day on foreign fund inflows, buying in banking shares

Global stock market indices: How the world markets performed today - 22 April 2025

Indian stock market sector-wise performance today - April 22, 2025

NSE Nifty 50: Top 5 stock losers of April 22, 2025

Top 5 Nifty 50 gainers today – April 22, 2025: Biggest stock moves

Stock markets rally for 5th day; Sensex jumps 855 pts on buying in banking, IT shares

Global stock market indices: How the world markets performed today - 21 April 2025

Indian stock market sector-wise performance today - April 21, 2025