


Highlights
- Global stock indices show mixed performance amid volatility
- Dow Jones neutral, MACD bearish, cautious outlook ahead
- Nikkei 225 gains 0.65%, RSI at 52.80 signals stability
Latest news

Samsung Galaxy M17 5G Review: Best Budget Samsung Phone Under ₹15,000?

OnePlus 15R first look: OnePlus changes the R-series playbook

India's retail inflation rises to 0.71% in November

Cabinet approves CoalSETU window for auction of coal to boost industrial use and export

Cabinet approves Minimum Support Price for Copra for 2026 season

Fire never left: Vinesh Phogat comes out of retirement, targets LA Olympics

Flexible office segment in India set to grow faster, over 25% annually by 2027: Report

Rahul Gandhi flags issue of air pollution, seeks discussion in Lok Sabha
Global stock market indices: How the world markets performed today - 26 March 2025


The international stock market indices showed varied performances on March 26, 2025, reflecting the economic sentiment across different regions.
In this article, we analyze the performance of key global indices including the S&P 500, Dow Jones Industrial Average, NASDAQ Composite, FTSE 100, DAX, CAC 40, IBEX 35, Nikkei 225, Hang Seng, Nifty 50, and BSE Sensex.
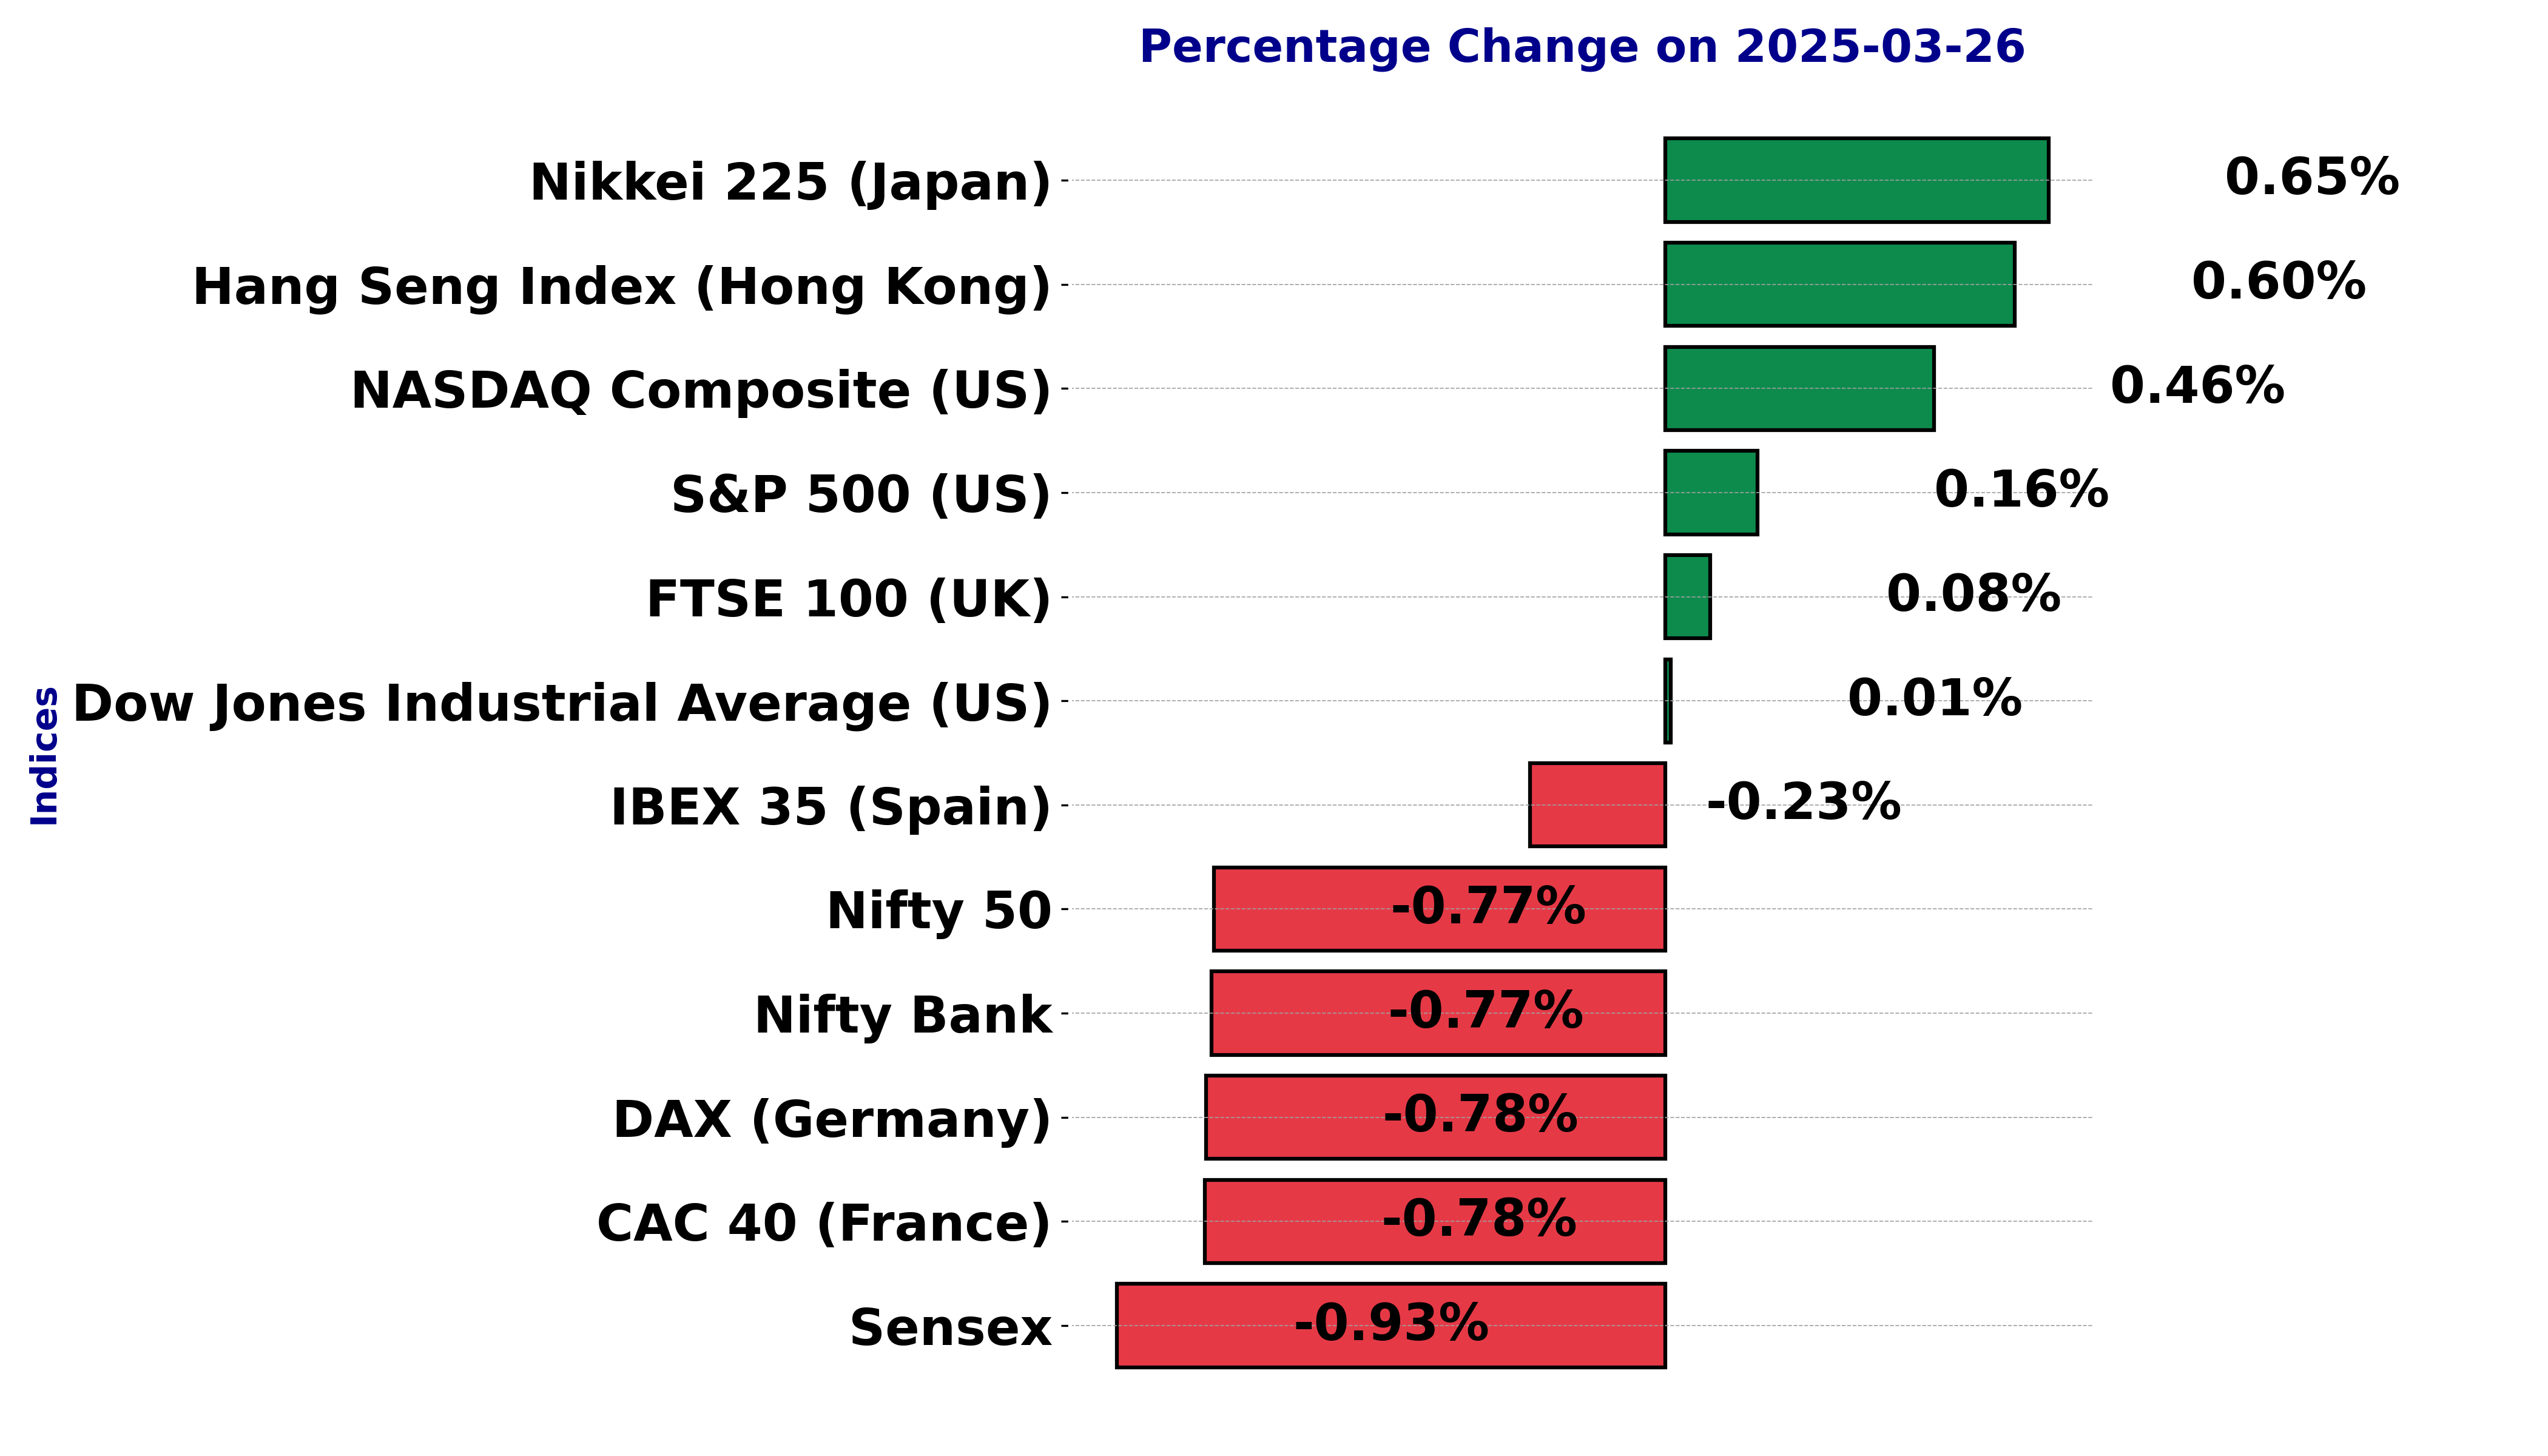
Analysis for Sensex - March 26, 2025

The Sensex opened at 78,021.45 and experienced volatility throughout the session, reaching a high of 78,167.87 and a low of 77,194.22, before closing at 77,288.50. It saw a decline in value compared to the previous close of 78,017.19, showing a percentage change of -0.93% and a points change of -728.69. The technical indicators, such as a Relative Strength Index (RSI) of 63.14 and MACD of 426.82 signifying bullish momentum, point to currently mixed signals in the market. The exponential moving averages show varied support levels with the 50-day EMA at 76,164.80 and the 200-day EMA at 77,168.03.

Relationship with Key Moving Averages
Sensex is currently trading below its 50 EMA of 76164.80 and 200 EMA of 77168.03, indicating a bearish trend in the short to long term. It is, however, above its 10 EMA of 76359.99 and 20 EMA of 75773.65, which might suggest some potential for a short-term recovery or volatility.
Moving Averages Trend (MACD)
The MACD for Sensex is 426.82, which is above the MACD Signal line of -88.13, indicating a bullish momentum. The positive MACD suggests that the Sensex may experience upward price movement in the near term.

RSI Analysis
The Relative Strength Index (RSI) for Sensex is currently at 63.14, indicating that the market is closer to being overbought. Typically, an RSI above 70 suggests overbought conditions, while below 30 indicates oversold conditions.

Analysis for Dow Jones Industrial Average (US) - March 26, 2025

The Dow Jones Industrial Average opened at 42,635.54 and closed at 42,587.50, showing a slight positive change with a points change of 4.18. The daily range had a high of 42,696.61 and a low of 42,441.83. The Relative Strength Index (RSI) is near neutral at 49.88, suggesting non-aggressive market sentiment, while the MACD indicates a bearish trend in momentum.

Relationship with Key Moving Averages
The closing price of the Dow Jones Industrial Average is below the 50-EMA, suggesting a bearish trend in the short to medium term. However, it is above the 10-EMA and 20-EMA, indicating some recent bullish momentum. The MACD is negative but less than the signal line, which may signal a potential reversal.
Moving Averages Trend (MACD)
The MACD for the Dow Jones Industrial Average is negative at -393.96, indicating a bearish trend, as it is below the MACD Signal line of -518.19. This suggests that the recent momentum is not favorable for bullish positions, and a cautious approach is warranted.

RSI Analysis
The RSI for the Dow Jones Industrial Average is currently at 49.88, indicating a neutral momentum as it is close to the midpoint of the standard RSI range (30-70). This suggests that the index is neither in an overbought nor oversold condition at this time.

Analysis for CAC 40 (France) - March 26, 2025

CAC 40 (France) Performance: The CAC 40 index opened at 8122, reaching a high of 8128 and a low of 8033, before closing at 8045. This represents a decline of 0.78%, with a points change of -63.55 from the previous close of 8108. The RSI stands at 49.66, indicating near-neutral momentum, while the MACD suggests a potential slowing in the upward momentum with a reading below the signal line.
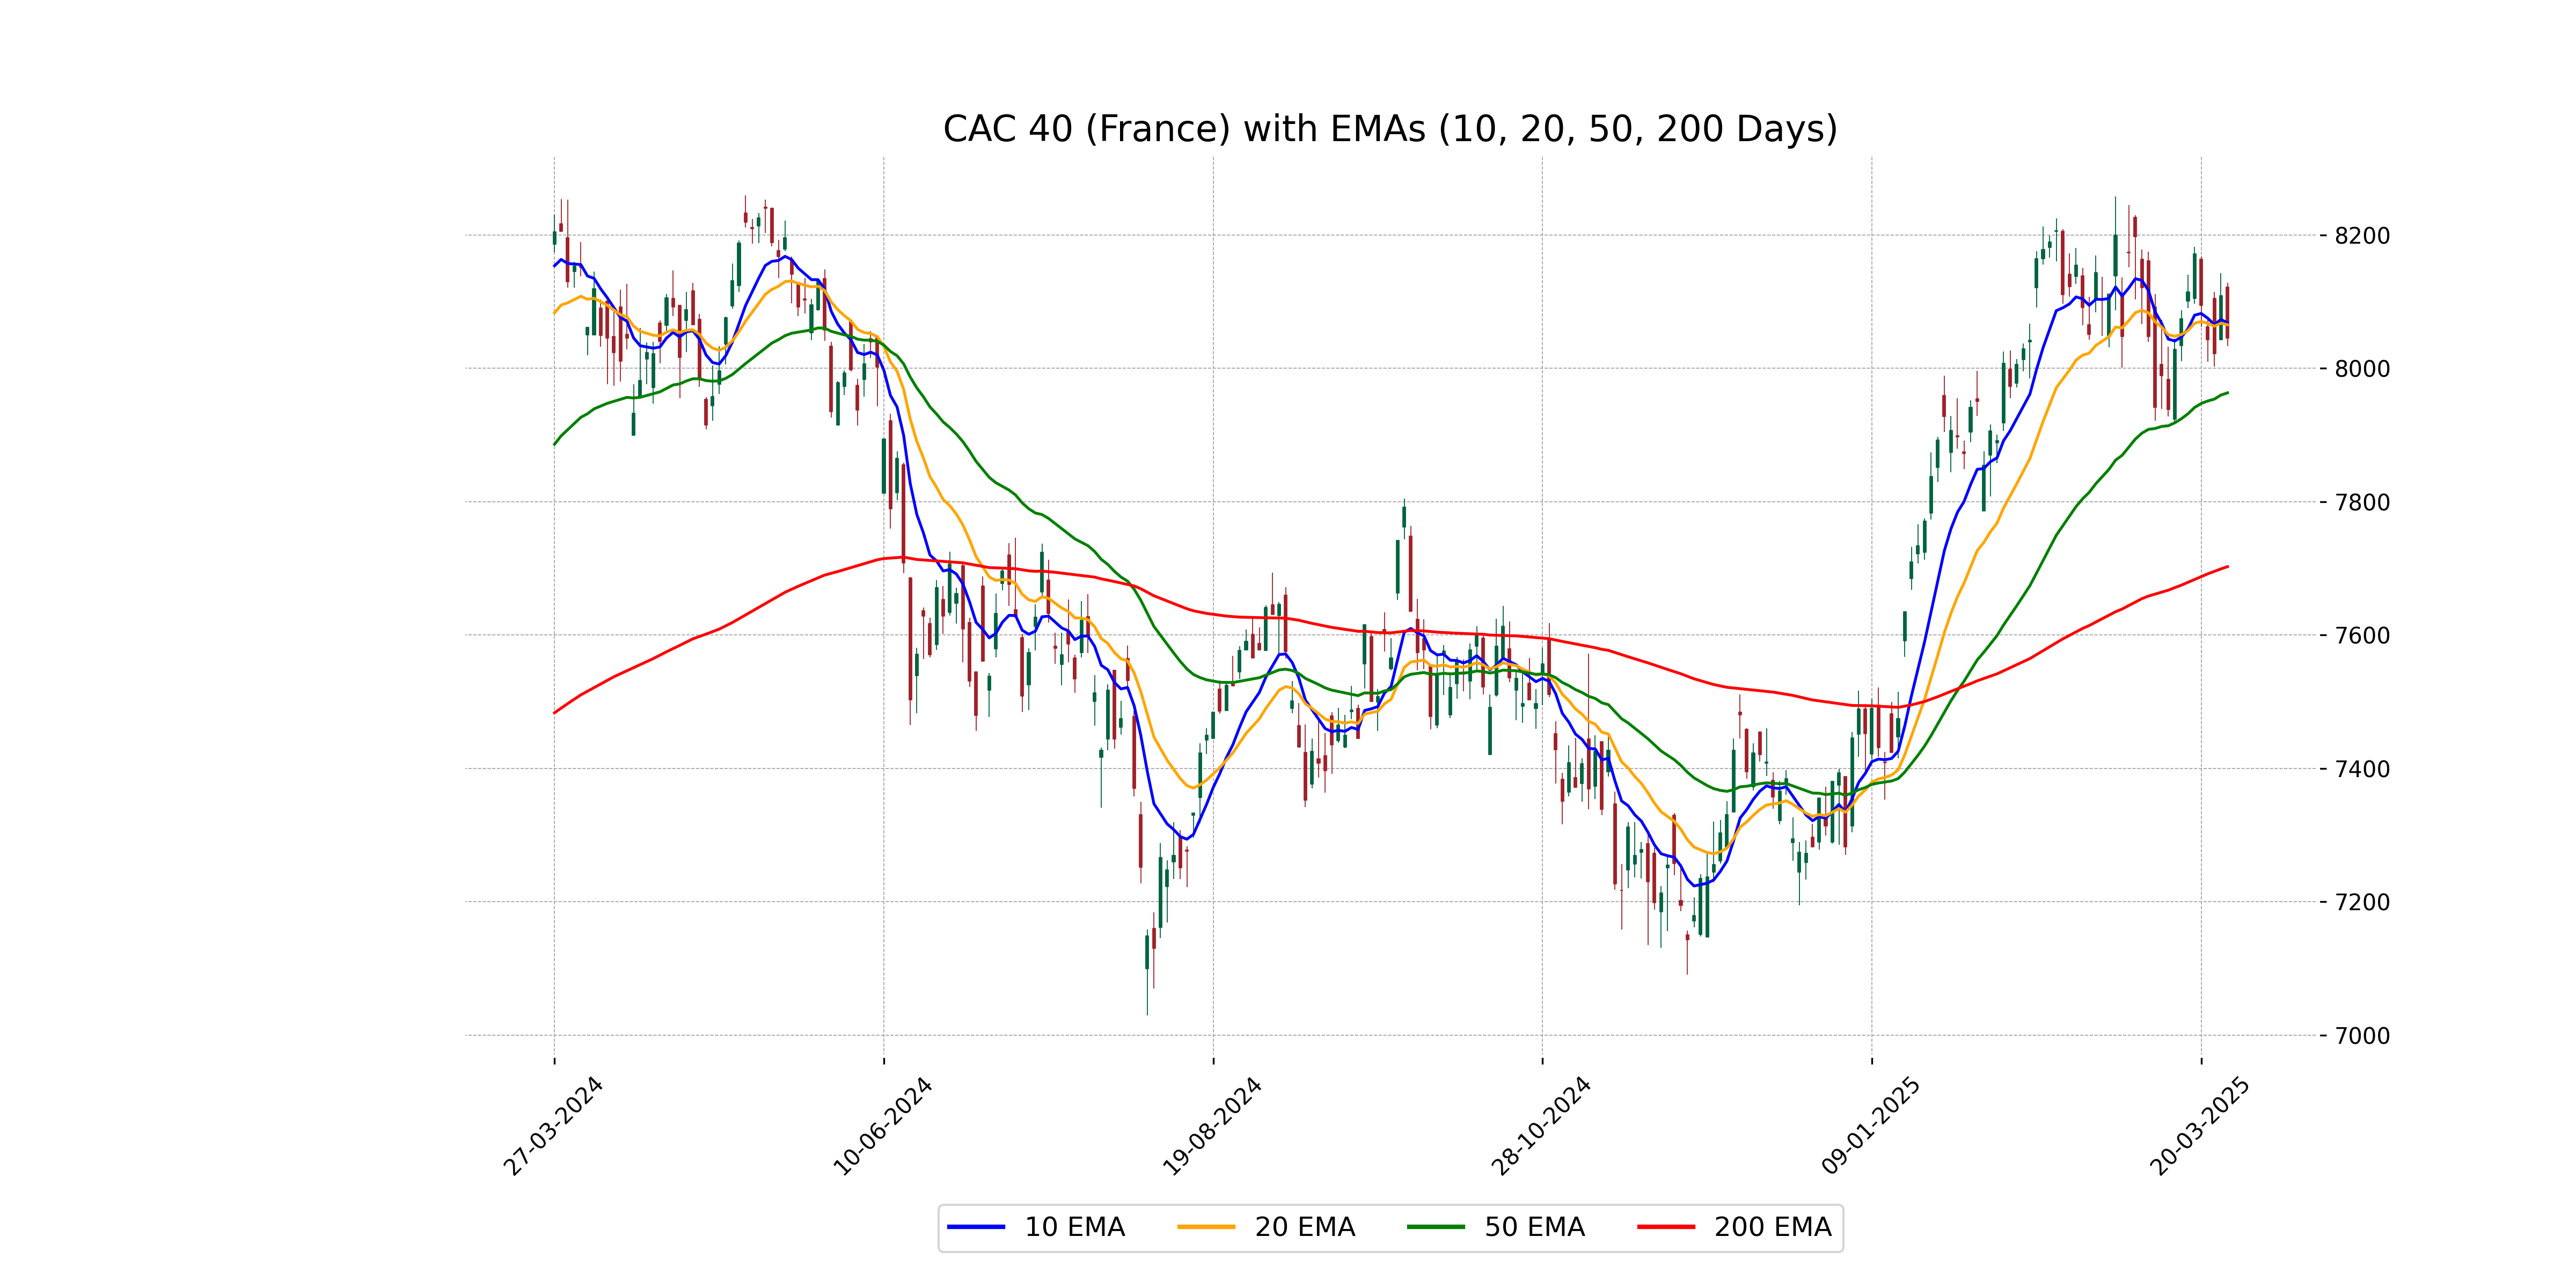
Relationship with Key Moving Averages
The CAC 40 index closed below the 10-day (8068.25) and 20-day (8065.47) EMAs, indicating a short-term bearish trend. However, it remains above the 50-day (7963.28) and 200-day (7702.67) EMAs, suggesting longer-term bullish momentum.
Moving Averages Trend (MACD)
The MACD for CAC 40 (France) is 15.91, which is below the MACD Signal of 26.04, indicating a potential bearish trend as the MACD line is below the signal line. This could suggest that the market momentum is weak.

RSI Analysis
The RSI for CAC 40 (France) is 49.66, which is close to the neutral level of 50. This indicates a balanced condition, suggesting neither overbought nor oversold pressure in the market.

Analysis for FTSE 100 (UK) - March 26, 2025

FTSE 100 (UK) opened at 8663.80 and closed at 8670.44, marking a slight increase with a percentage change of 0.08%. The index showcased mild volatility with a high of 8699.95 and a low of 8656.39, amid neutral sentiment indicated by an RSI of 51.36.

Relationship with Key Moving Averages
The FTSE 100's current close at 8670.44 is above its 50-day EMA of 8608.29, indicating a positive short-term trend. It is also above its 10-day and 20-day EMAs, suggesting bullish momentum. However, trading above the 200-day EMA of 8347.12 implies long-term strength.
Moving Averages Trend (MACD)
The MACD for FTSE 100 is at 3.26 with a Signal line at 6.07, indicating a bearish trend as the MACD is below the Signal line. This suggests potential selling pressure in the market.

RSI Analysis
For the FTSE 100 (UK), the RSI is at 51.36, which suggests a neutral market sentiment with no clear overbought or oversold conditions. This implies relative stability in price movements and potential for market direction to develop further.

Analysis for DAX (Germany) - March 26, 2025

The DAX (Germany) opened at 23,202.25 and closed at 22,929.14, registering a negative change of approximately -0.78%. Although the current price is above both the 50 EMA and 200 EMA, indicating a potential bullish long-term trend, the MACD suggests weak momentum as it is below the MACD Signal. The RSI of 53.56 implies neither overbought nor oversold conditions.

Relationship with Key Moving Averages
The DAX index closed below its 10-day EMA, indicating potential short-term bearishness, but remains above both its 50-day and 200-day EMAs, suggesting an overall longer-term uptrend. The RSI is neutral at 53.56, hinting at neither overbought nor oversold conditions. The MACD is below its signal line, which may indicate a potential downward momentum in the short term.
Moving Averages Trend (MACD)
The MACD for DAX (Germany) is at 220.61, while the MACD Signal is higher at 268.15. This indicates a bearish crossover, suggesting potential downward momentum in the stock's price movement. The Relative Strength Index (RSI) of 53.56 suggests a neutral position, not indicating overbought or oversold conditions.

RSI Analysis
The RSI for DAX (Germany) is 53.56, indicating a neutral to slightly bullish sentiment. An RSI around the midpoint (50) suggests that the index is neither overbought nor oversold, reflecting a balanced momentum in the current market conditions.

Analysis for S&P 500 (US) - March 26, 2025

The S&P 500 (US) opened at 5775.96 and closed slightly higher at 5776.65, marking a 0.16% increase from the previous close. The trading volume was substantial at 4.47 billion. Despite the minor upward movement, the index's MACD indicator suggests a bearish sentiment, with a negative value of -66.61 and an RSI close to the neutral level at 49.72.

Relationship with Key Moving Averages
The closing price of S&P 500 is below the 50 EMA, indicating a potential bearish trend currently. However, it is above the 200 EMA, suggesting a longer-term bullish trend. The 10 EMA is also below the 20 EMA, reflecting a recent negative trend compared to the past 20 periods.
Moving Averages Trend (MACD)
S&P 500 (US) MACD Analysis: The MACD of -66.61 compared to the MACD Signal of -86.58 suggests a potential bullish crossover, as the MACD is trending upward towards the signal line. This may indicate a possible reversal or upward momentum in the near term, despite the overall negative MACD value indicating a prior bearish trend.

RSI Analysis
RSI Analysis for S&P 500 (US): The Relative Strength Index (RSI) for the S&P 500 stands at 49.72, indicating a neutral position. This suggests that the index is neither overbought nor oversold, providing no strong signals for immediate price reversals.

Analysis for Hang Seng Index (Hong Kong) - March 26, 2025

The Hang Seng Index (Hong Kong) opened at 23,460.31 and closed at 23,483.32, marking a positive change of approximately 0.60% or 139.07 points from the previous close of 23,344.25. The index saw a high of 23,596.85 and a low of 23,350.73, with the RSI standing at 51.37, indicating a neutral market sentiment.

Relationship with Key Moving Averages
The Hang Seng Index is trading above its 50-day EMA (22,577.32) and 200-day EMA (20,278.95), indicating a potential upward trend relative to these key averages. However, it is trading below its 10-day EMA (23,809.99) and 20-day EMA (23,613.25), suggesting recent short-term weakness.
Moving Averages Trend (MACD)
The MACD for Hang Seng Index (Hong Kong) is currently 397.95, which is below its MACD Signal of 572.20, indicating a possible bearish momentum. The RSI is at 51.37, suggesting that the index is neither overbought nor oversold.

RSI Analysis
The RSI for the Hang Seng Index is 51.37, indicating a neutral position as it is neither in the overbought nor oversold condition. Generally, RSI values between 30 and 70 suggest a stable market trend without signals of a strong reversal.

Analysis for IBEX 35 (Spain) - March 26, 2025

The IBEX 35 (Spain) index opened at 13,484.5 and closed slightly lower at 13,453.2, marking a decrease of 31.1 points or -0.23%. The trading volume for the day was 29,929,721. The index appears to be trending above both its 50-day and 200-day exponential moving averages, suggesting a potential bullish trend, supported by a relatively strong RSI of 63.13.

Relationship with Key Moving Averages
The IBEX 35 is currently trading above its 10-day EMA (13309.20) and 20-day EMA (13194.90), indicating a short-term bullish trend. However, it is also above the longer-term 50-day EMA (12846.46) and 200-day EMA (11908.14), suggesting a sustained upward momentum.
Moving Averages Trend (MACD)
The MACD line for IBEX 35 is 159.87 and the MACD Signal line is 150.56. Since the MACD is above the Signal line, it indicates a bullish momentum in the market.

RSI Analysis
The IBEX 35 in Spain has an RSI of 63.13, suggesting that the index is in a moderately overbought condition. This level indicates potential strength, but investors should be cautious of a possible price correction if the RSI approaches or exceeds the 70 level.

Analysis for NASDAQ Composite (US) - March 26, 2025

The NASDAQ Composite opened at 18,207.97, closed at 18,271.86, and saw a gain of 0.46% from the previous close, reflecting an increase of 83.27 points. The volume for the session was 6.475 billion, while the index currently has a Relative Strength Index (RSI) of 49.15, indicating neutral momentum. The 50-EMA stands at 18,677.15, which is higher than the 20-EMA and 10-EMA, suggesting a longer-term uptrend. The MACD is below the signal line, implying a potential bearish signal.

Relationship with Key Moving Averages
The NASDAQ Composite closed at 18271.86, which is above its 200-day EMA of 18257.39 but below its 50-day EMA of 18677.15, indicating mixed signals concerning its longer-term and more immediate trends. The 10-day EMA at 17941.49 and 20-day EMA at 18151.54 suggest short-term upward momentum, as the close is above both.
Moving Averages Trend (MACD)
The NASDAQ Composite's MACD is currently at -334.33, with a MACD Signal of -429.52, indicating a recent crossover in a bullish direction. The negative MACD values suggest that the index is in a bearish phase, but the recent crossover could imply a potential trend reversal.

RSI Analysis
The RSI of NASDAQ Composite is 49.15, which is close to the neutral level of 50. This suggests that the index is neither in an overbought nor oversold condition, indicating balanced sentiment in the market.

Analysis for Nikkei 225 (Japan) - March 26, 2025

The Nikkei 225 (Japan) opened at 38,106.66 and closed at 38,027.29, experiencing a positive change of 0.65% with a points increase of 246.75. The Relative Strength Index (RSI) indicates moderate buying activity at 52.80, while the MACD suggests a bearish trend as it is below the signal line. The 50-day and 200-day EMAs are close to each other, centered around the same level, reflecting a stable trend over these periods.

Relationship with Key Moving Averages
The closing price of Nikkei 225 is positioned below its 50-day and 200-day EMAs, indicating potential bearish momentum; however, it is above the 10-day and 20-day EMAs. The RSI level suggests a neutral position, reflecting no strong momentum in either direction.
Moving Averages Trend (MACD)
MACD Analysis for Nikkei 225 (Japan): The MACD value of -198.41 is above the MACD Signal line value of -342.96, suggesting a potential bullish crossover. This indicates a possibility of upward momentum if this trend continues.

RSI Analysis
The RSI value of 52.80 for the Nikkei 225 indicates a neutral position, suggesting that the index is neither overbought nor oversold. This level implies that the market is relatively balanced, with no significant upward or downward momentum predominating at the moment.

Analysis for Nifty Bank - March 26, 2025

Nifty Bank opened at 51,640.05 and closed at 51,209, marking a decrease of 398.95 points or -0.77%. It recorded a high and low of 51,875.80 and 51,069.15 respectively. The RSI is at 67.63, indicating a relatively strong momentum, despite a decrease from the previous close.

Relationship with Key Moving Averages
The Nifty Bank closed at 51,209, below both its 50-day EMA (49,591.29) and 200-day EMA (49,954.16), suggesting a potential bearish trend as the current price is trading underneath these key moving averages. However, the index is above its 10-day EMA (50,258.11) and 20-day EMA (49,668.79), indicating some recent short-term strength.
Moving Averages Trend (MACD)
Nifty Bank's MACD is 527.79, significantly above the MACD Signal of 135.68, indicating strong bullish momentum. The substantial difference suggests that the recent trend is upward, although monitoring for potential overbought conditions would be prudent.

RSI Analysis
The RSI for Nifty Bank is 67.63, which indicates that the stock is approaching overbought conditions. Typically, an RSI above 70 suggests that a stock may be overbought, while an RSI below 30 suggests it may be oversold. Investors should monitor this level to assess potential reversal signals.

Analysis for Nifty 50 - March 26, 2025

Nifty 50 opened at 23,700.95, reaching a high of 23,736.5 and a low of 23,451.7, before closing at 23,486.85. There was a decrease from the previous close of 23,668.65, with a percentage change of -0.77% and a points change of -181.80. The current RSI is 64.76, indicating a moderately strong momentum. The MACD value of 149.93 compared to its signal line of -8.80 suggests a positive trend.

Relationship with Key Moving Averages
The Nifty 50 is currently trading below its 50 EMA of 23079.38 and also below its 200 EMA of 23407.75. This indicates a short-term bearish sentiment as the current close of 23486.85 is also lower than the previous close of 23668.65, with a percentage change of -0.77%.
Moving Averages Trend (MACD)
The MACD for Nifty 50 is indicating a positive trend, as the MACD line (149.93) is above the MACD Signal line (-8.80). This suggests potential bullish momentum in the market.

RSI Analysis
The Relative Strength Index (RSI) for Nifty 50 is 64.76, which suggests a mildly bullish sentiment as it is above 50. However, since it's below 70, it doesn't indicate an overbought condition. Traders might interpret this as a stable momentum with potential for further upward movement.

Up Next
Global stock market indices: How the world markets performed today - 26 March 2025

Microsoft commits USD 17.5 billion investment in India: CEO Satya Nadella

CBI books Anil Ambani's son, Reliance Home Finance Ltd. in Rs 228 crore bank fraud case

RBI raises FY26 GDP growth projection to 7.3 pc

RBI trims policy interest rate by 25bps to 5.25pc, loans to get cheaper

Rupee slumps to all-time low of 90.25 against US dollar in intra-day trade

More videos

Reliance completes merger of Star Television Productions with Jiostar

India to lead emerging market growth with 7pc GDP rise in 2025: Moody’s

Nifty hits record high after 14 months; Sensex nears all-time peak

Reliance stops Russian oil use at its only-for-export refinery to comply with EU sanctions

ED attaches fresh assets worth over Rs 1,400 cr in case against Anil Ambani's Reliance Group

India signs one-year deal to import 2.2 million tonnes of LPG from US

India International Trade Fair begins at Pragati Maidan amid tight security

Stock markets decline in initial trade on foreign fund outflows, weak Asian peers

Amazon to lay off 30,000 office workers amid AI-driven cost cuts

US sanctions on Russian firms to hit Reliance; PSUs likely to keep buying Russian oil via traders