


Highlights
- Nifty FMCG surged with the highest percentage change, +1.13%
- Nifty Bank experienced a strong uptick, increasing by 1.02%
- Nifty IT displayed notable volatility with a rise of 0.84%
Latest news

Pahalgam tragedy casts shadow on Indo-Pak cricket

MS Dhoni to play his 400th T20 match as CSK faces SRH

India stands tall amid tragedy: Piyush Goyal

ED raids Congress MLA Vinay Kulkarni's properties

VHP stages protest in Kolkata over Pahalgam attack

Kartarpur corridor stays open amid tensions

Hero and terrorist: The tale of two Adils in Pahalgam

Pahalgam survivor recalls horror, wife prays Shiva
Indian stock market sector-wise performance today - April 2, 2025


The Indian stock market on Wednesday (April 2, 2025) witnessed a day of mixed performance with several key sectors recording notable changes.
Among these, the Nifty FMCG Index stood out with a remarkable increase of 1.13%, reflecting a significant boost in investor confidence within the Fast-Moving Consumer Goods sector. This surge enabled FMCG stocks to lead the market gains for the day.
Following closely was the Nifty Bank, which appreciated by 1.02%. This increase underscores the bullish sentiment surrounding banking stocks, potentially driven by positive financial results or macroeconomic expectations.
Meanwhile, the Nifty IT sector displayed an upward movement as well, registering a 0.84% increase. This growth suggests a rebound in technology stocks, possibly due to favorable developments in the tech industry or a correction from prior declines.
The Nifty Metal index rose by 0.70%, indicating a stable performance among metal stocks. Investors might have been encouraged by global commodity trends or favorable market forecasts within the metal industry.
The S&P BSE Sensex and Nifty also recorded increases of 0.78% and 0.72%, respectively, highlighting a general upward trend across the broad market.
On the other hand, the Nifty Energy sector saw a modest rise of 0.52%, while the Nifty Infra index climbed by 0.54%. These increases suggest a mixed but positive outlook on infrastructure and energy stocks.
A closer look reveals that the market movements could be attributed to varied factors influencing each specific sector. The most significant change was within the FMCG sector, with a rise of 1.13%. This could potentially be linked to strong quarterly earnings or improved consumer spending trends, providing a solid foundation for increased investor interest in FMCG stocks.
Overall, the positive performances across multiple indices could reflect a more optimistic economic environment or specific sectoral drivers that have spurred investor enthusiasm.
External factors such as global market cues, changes in policy, and macroeconomic indicators may have also played a role in shaping the day's market dynamics.

Analysis for Sensex - April 02, 2025

The Sensex opened at 76,146.28, with a high of 76,680.35 and a low of 76,064.94, closing at 76,617.44. Compared to the previous close of 76,024.51, it has risen by approximately 0.78%, marking a points change of 592.93. The RSI is at 54.51, indicating a neutral market sentiment.

Relationship with Key Moving Averages
The Sensex closed above its 10 EMA (76,609.42) and 50 EMA (76,272.66), indicating a bullish momentum, as it also experienced a percentage increase of approximately 0.78%. However, it remained below the 200 EMA (77,159.30), suggesting longer-term resistance ahead.
Moving Averages Trend (MACD)
The Sensex MACD line is currently above the MACD Signal line, suggesting a bullish momentum. With a MACD value of 450.67 and a signal line at 253.15, the positive divergence indicates an upward trend possibility. Keep an eye on further movement to confirm sustained bullishness.

RSI Analysis
The current RSI for Sensex is 54.51, indicating a neutral position, as it is in the middle range of 30-70. This suggests that the market is neither overbought nor oversold, providing a balanced view without a strong bullish or bearish trend. Consider other indicators for a comprehensive analysis.

Analysis for Nifty Auto - April 02, 2025

Nifty Auto opened at 21250.85 and closed at 21408.85, marking a positive day with a percentage change of approximately 0.82% and a points change of 173.60. The RSI is at 48.78, indicating a relatively neutral momentum, while the MACD is below the signal line, suggesting a bearish trend in the short term. Despite the positive daily performance, the 50 and 200 EMA values are higher than the closing price, indicating a longer-term downward trend.

Relationship with Key Moving Averages
The closing price of Nifty Auto is slightly above the 10 EMA and 20 EMA, indicating a short-term bullish trend. However, it remains below the 50 EMA and 200 EMA, suggesting that the longer-term outlook might still be bearish.
Moving Averages Trend (MACD)
The MACD for Nifty Auto is negative at -61.23, indicating a potential bearish trend. However, since the MACD Signal is more negative at -132.37, it suggests a potential for a bullish crossover if the MACD value starts to increase relative to the Signal line. The current RSI of 48.78 shows a neutral market condition.

RSI Analysis
Based on the given data, the RSI for Nifty Auto is 48.78, which is in the neutral range. This suggests that the index is neither overbought nor oversold, indicating a balanced market momentum without significant bullish or bearish pressure.

Analysis for Nifty Energy - April 02, 2025

Nifty Energy Performance: Nifty Energy opened at 33,321.80 and closed higher at 33,463.70, reflecting a positive change of 0.52% or a point increase of 174.55. The RSI indicates a fairly strong momentum with a value of 59.73, and the MACD shows a positive trend with a value of 465.08 above the signal line, suggesting continued upward momentum.

Relationship with Key Moving Averages
The Nifty Energy index closed at 33,463.70, which is above its 50-day EMA of 32,864.43 and its 10-day EMA of 33,181.11, indicating a short-term bullish trend. However, it remains below the 200-day EMA of 35,838.50, which can suggest a longer-term bearish trend remains in place.
Moving Averages Trend (MACD)
The MACD value for Nifty Energy is 465.08 with a MACD Signal of 306.55. A MACD above its signal line generally suggests a bullish trend, indicating upward momentum in the ETF's price.

RSI Analysis
The RSI for Nifty Energy is 59.73, which suggests that the stock is nearing the overbought territory but is still in a neutral zone. An RSI under 70 generally indicates that the stock has room for growth before becoming overbought.

Analysis for Nifty FMCG - April 02, 2025

Nifty FMCG opened at 53,286.60 and closed at 53,702.60, experiencing a positive movement with a percentage change of 1.13%. The close price is higher than the previous close of 53,101.75, resulting in a points change of 600.85. The stock's short-term momentum, indicated by an RSI of 58.89, suggests a moderately optimistic sentiment.

Relationship with Key Moving Averages
The closing price of Nifty FMCG at 53,702.60 is above the 50 EMA of 53,593.60 and the 20 EMA of 52,868.73, indicating a bullish trend. However, it remains below the longer-term 200 EMA of 56,189.29, suggesting that while there is short-term upward momentum, the index has not yet confirmed a longer-term bullish reversal.
Moving Averages Trend (MACD)
The MACD for Nifty FMCG is positive at 89.91, indicating a bullish signal. Additionally, the MACD line is above the signal line, which suggests potential upward momentum.

RSI Analysis
The Relative Strength Index (RSI) for Nifty FMCG is 58.89, which suggests a neutral stance with a mild bullish tilt. Since RSI is below 70, the index is not in the overbought zone, indicating potential room for upward movement.

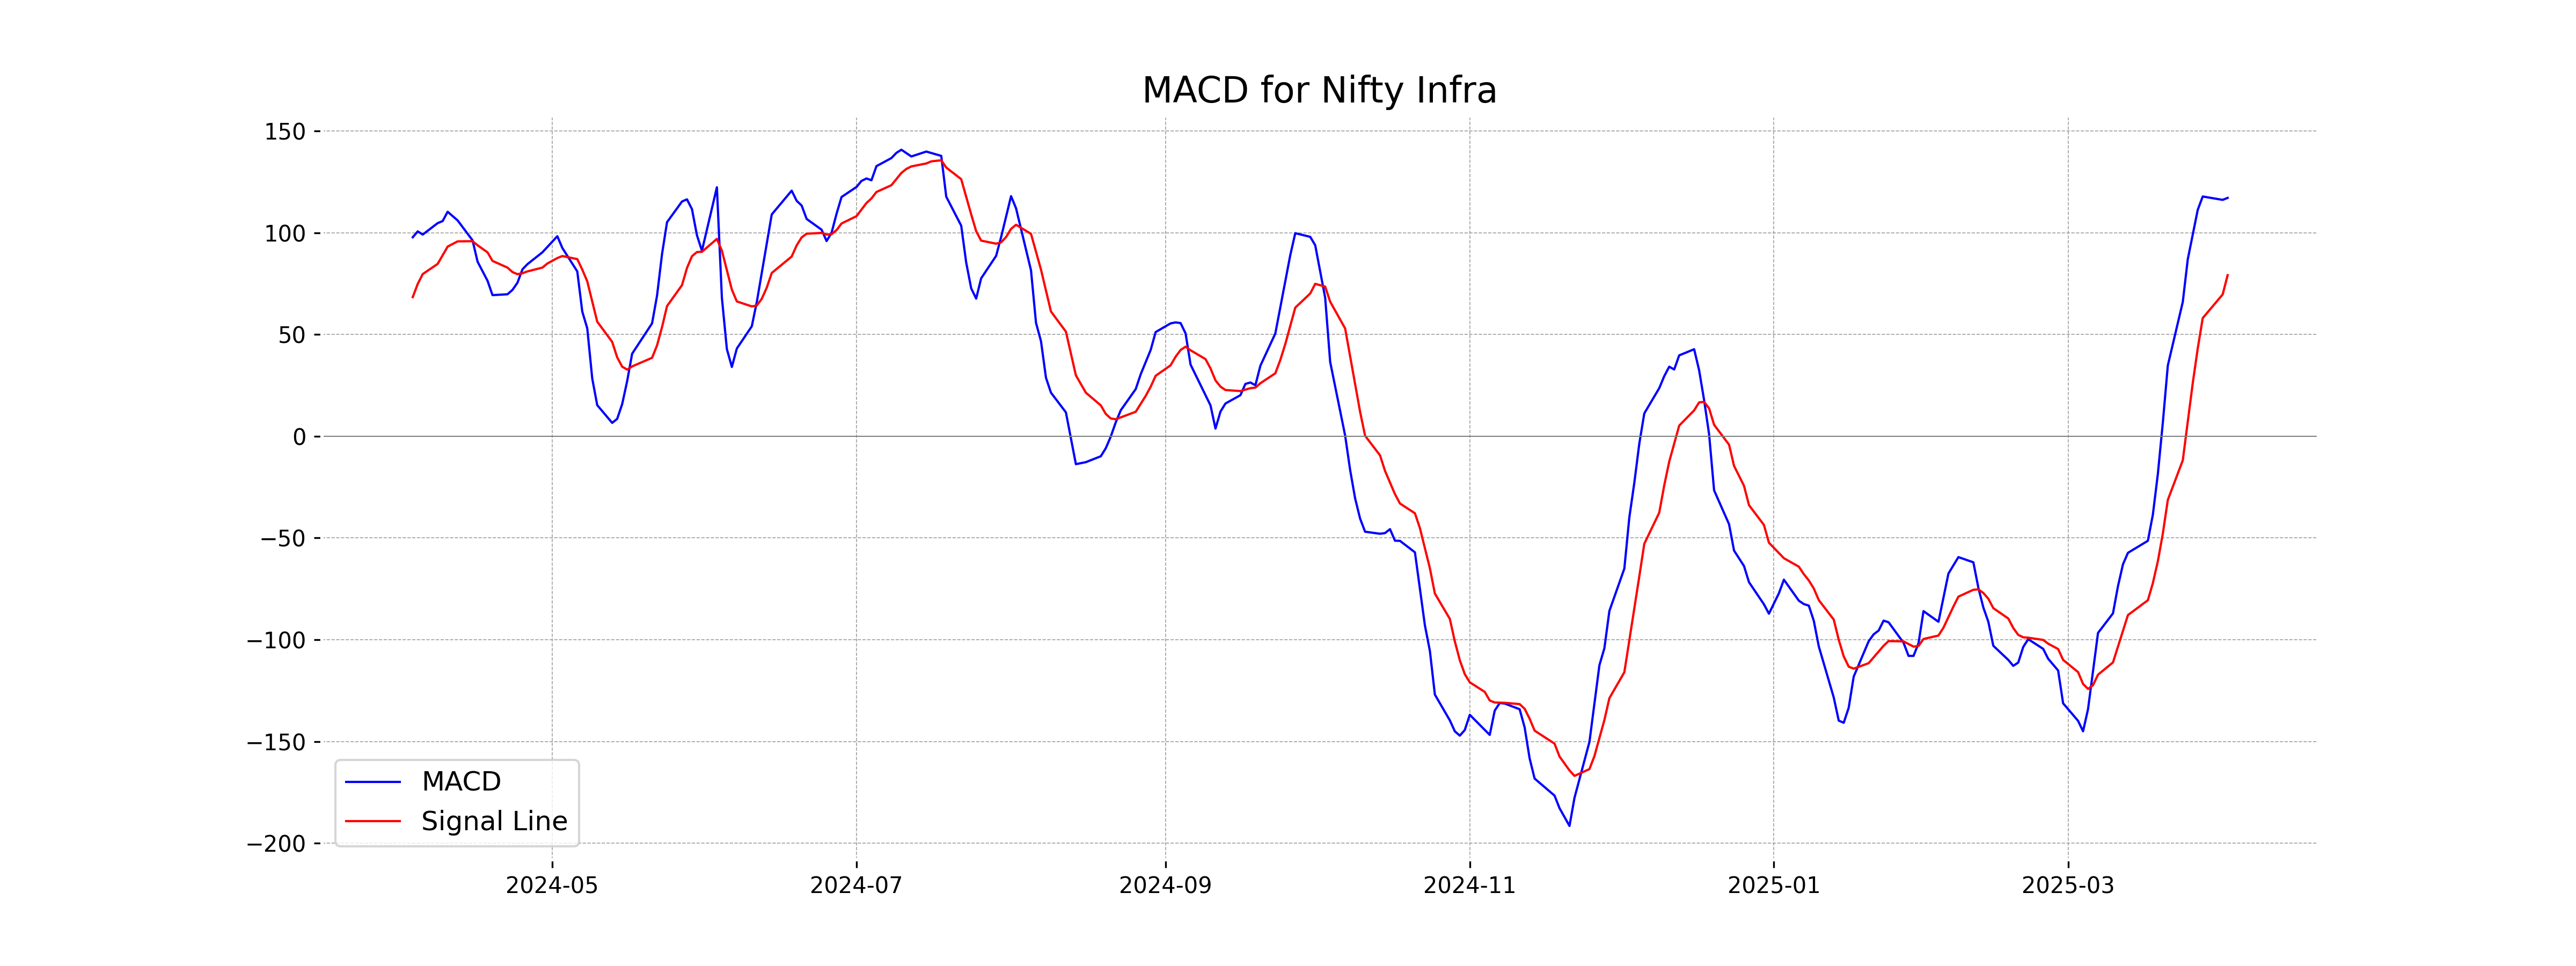
Analysis for Nifty Infra - April 02, 2025

Nifty Infra opened at 8378.35 and closed at 8434.5, resulting in a positive change of 0.54% with a 45-point increase from the previous close of 8389.5. The RSI stands at 63.22, indicating a moderately strong buying momentum. The MACD value of 117.15, above its signal line of 79.19, suggests a bullish trend.

Relationship with Key Moving Averages
Nifty Infrastructure closed at 8434.5, which is above its 50-day EMA of 8214.63 and its 20-day EMA of 8248.84, indicating a short-term bullish trend. Additionally, it also closed above its 200-day EMA of 8404.76, suggesting a long-term bullish momentum.
Moving Averages Trend (MACD)
The MACD value for Nifty Infra is 117.15, which is above the MACD Signal line value of 79.19. This suggests a bullish momentum, indicating a potential continued upward trend in the stock's price.
RSI Analysis
The current Relative Strength Index (RSI) of Nifty Infra is 63.22, which indicates that the stock is in a moderately strong zone. An RSI above 50 generally suggests upward momentum, but being below 70, it indicates that the stock is not yet considered overbought. Therefore, Nifty Infra may have room for further upward movement.

Analysis for Nifty IT - April 02, 2025

Nifty IT Performance Description: Nifty IT opened at 36,024.45 and closed higher at 36,283.5, with a percentage change of 0.84% and a points change of 302.85. The RSI is at 36.45, indicating a possible oversold condition. The MACD value is -849.19, suggesting a bearish trend, although it’s slightly above the MACD signal of -982.98.

Relationship with Key Moving Averages
The Nifty IT index closed at 36283.5, which is below the 10 EMA of 36819.54, the 50 EMA of 39110.93, and the 200 EMA of 39979.98. This indicates a bearish trend as the current price is trading below these key moving averages.
Moving Averages Trend (MACD)
MACD Analysis for Nifty IT: The MACD value of -849.19, which is above its signal line at -982.98, indicates that the bearish momentum is potentially weakening. Although it is still in negative territory, suggesting prevailing downward pressure, the crossover pattern suggests the possibility of a trend reversal.

RSI Analysis
Nifty IT's RSI is at 36.45, indicating a possible oversold condition. This suggests that the index might be undervalued, potentially leading to a buying opportunity if other indicators align.

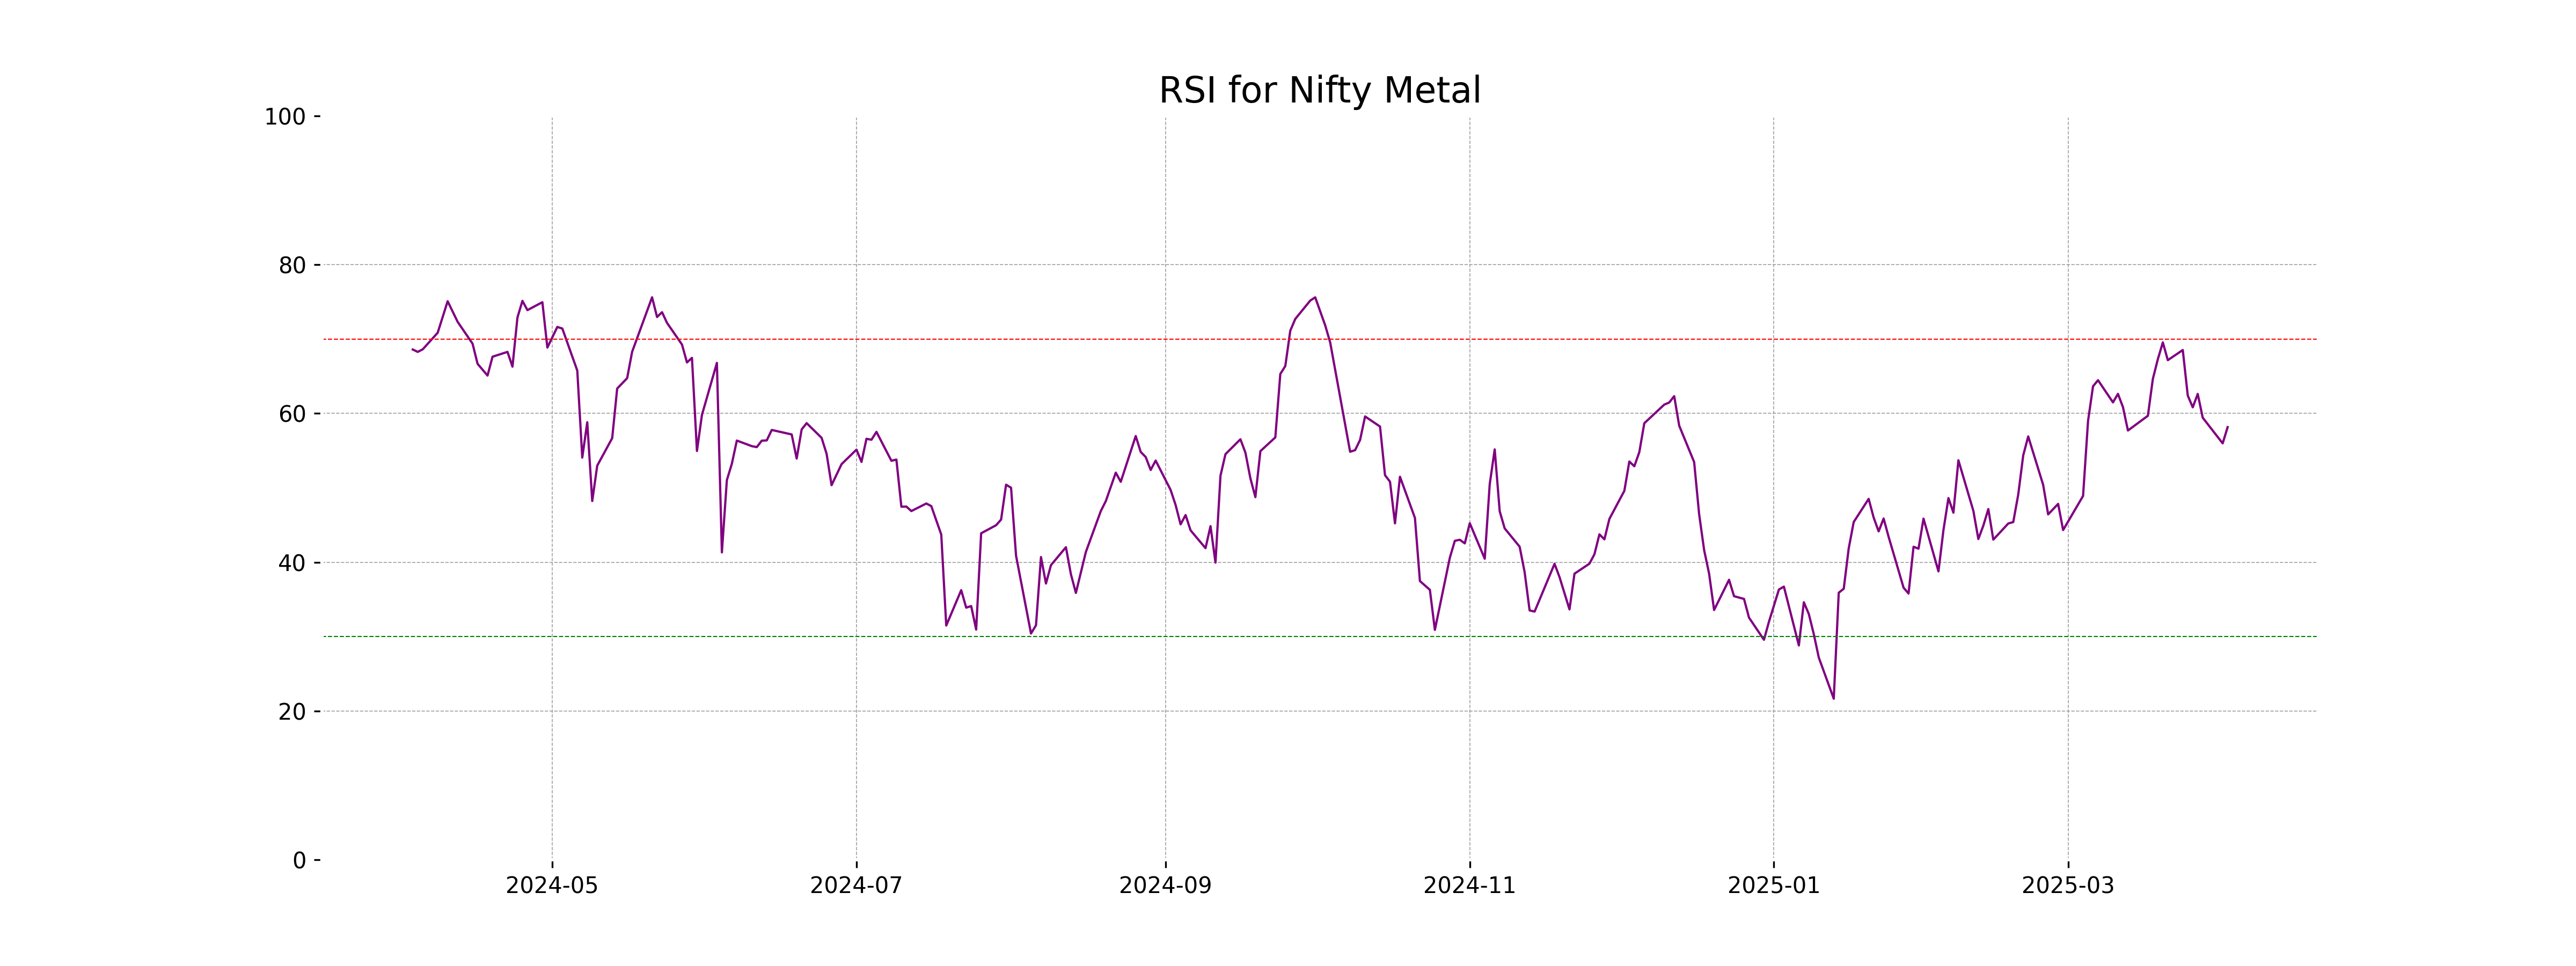
Analysis for Nifty Metal - April 02, 2025

Nifty Metal opened at 9038.75 and closed at 9080.05, reflecting a positive change of 0.70% with an increase of 63.20 points. The Relative Strength Index (RSI) is at 58.17, indicating moderate momentum. The index shows overall strength, trading above both its 50-day and 200-day Exponential Moving Averages (EMA).

Relationship with Key Moving Averages
The close price of Nifty Metal at 9080.05 is above the 50 EMA (8784.62) and 200 EMA (8825.85), indicating a bullish trend in the medium to long term, but slightly below the 10 EMA (9070.53). This suggests positive momentum with a minor potential pullback from recent highs.
Moving Averages Trend (MACD)
Based on the provided data for Nifty Metal, the MACD line (155.00) is below the MACD Signal line (167.94), which indicates a potential bearish trend or a weakening momentum. Traders might consider this a signal to be cautious with bullish positions or watch for further confirmation of trend direction.

RSI Analysis
The RSI for Nifty Metal is 58.17, which is in the neutral zone, suggesting neither overbought nor oversold conditions. It indicates a balanced momentum without any extreme trading signals at this point.
Analysis for Nifty Bank - April 02, 2025

Nifty Bank opened at 50,966.90 and closed at 51,348.05, registering a gain of approximately 1.02%. The day's high was 51,404.20 and the low was 50,908.35. The 10 EMA is at 50,831.26, and the RSI indicates a moderately strong market sentiment at 63.75. The MACD is above the signal line, suggesting a bullish momentum.

Relationship with Key Moving Averages
Nifty Bank closed at 51348.05, above its 50 EMA of 49847.23 and 200 EMA of 50009.03, indicating a bullish trend. The closing price is also higher than its 10 EMA of 50831.26 and 20 EMA of 50210.90, suggesting short-term strength above recent averages.
Moving Averages Trend (MACD)
The MACD for Nifty Bank is at 656.79 while the MACD Signal is at 436.68, indicating a bullish momentum as the MACD is above the signal line. This suggests potential upward movement in the short term.

RSI Analysis
Based on the given RSI value of 63.75 for Nifty Bank, the stock is exhibiting strong momentum and is in mildly overbought territory. This suggests that while the stock is currently on an upward trend, investors should be cautious of potential pullbacks or corrections.

Analysis for Nifty 50 - April 02, 2025

The Nifty 50 opened at 23,192.60 and closed at 23,332.35, marking a 0.72% increase from its previous close of 23,165.70, reflecting a gain of 166.65 points. The index achieved a high of 23,350.00 and a low of 23,158.45 during the trading session. The current RSI is 56.80, suggesting a relatively moderate momentum, while the MACD indicates a positive signal above the MACD Signal line.

Relationship with Key Moving Averages
The closing price of Nifty 50 at 23,332.35 is above the 50-day EMA at 23,126.31 and the 10-day EMA at 23,285.45, indicating a short-term upward momentum. However, it is still below the 200-day EMA at 23,407.92, suggesting that the longer-term trend may still have bearish elements.
Moving Averages Trend (MACD)
The MACD value for Nifty 50 is 167.16, which is higher than the MACD Signal at 99.83. This indicates a bullish signal as the MACD line is above the signal line, suggesting upward momentum. The RSI at 56.80 further supports a bullish trend, as it is above 50 but not in overbought territory.

RSI Analysis
The Relative Strength Index (RSI) of Nifty 50 is 56.80, which suggests that the stock is in a neutral zone and not currently overbought or oversold. Typically, an RSI above 70 is considered overbought, and below 30 is considered oversold, so Nifty 50 is relatively stable at the moment.

Up Next

Indian stock market sector-wise performance today - April 2, 2025

Global stock market indices: How the world markets performed today - 25 April 2025

Indian stock market sector-wise performance today - April 25 2025

Top 5 Nifty 50 gainers today – April 25, 2025: Biggest stock moves

NSE Nifty 50: Top 5 stock losers of April 25, 2025

Global stock market indices: How the world markets performed today - 24 April 2025

More videos

Indian stock market sector-wise performance today - April 24 2025

Top 5 Nifty 50 gainers today – April 24, 2025: Biggest stock moves
NSE Nifty 50: Top 5 stock losers of April 24, 2025

Global stock market indices: How the world markets performed today - 23 April 2025

Indian stock market sector-wise performance today - April 23, 2025
Top 5 Nifty 50 gainers today – April 23, 2025: Biggest stock moves

NSE Nifty 50: Top 5 stock losers of April 23, 2025

Sensex, Nifty rise for 6th day on foreign fund inflows, buying in banking shares

Global stock market indices: How the world markets performed today - 22 April 2025

Indian stock market sector-wise performance today - April 22, 2025