


Highlights
- Sensex down by 2.95%, closing at 73137.90
- Nifty Metal experienced the largest drop, losing 6.75%
- Nifty IT dropped by 2.51%, closing at 32668.80
Latest news

Pahalgam tragedy casts shadow on Indo-Pak cricket

MS Dhoni to play his 400th T20 match as CSK faces SRH

India stands tall amid tragedy: Piyush Goyal

ED raids Congress MLA Vinay Kulkarni's properties

VHP stages protest in Kolkata over Pahalgam attack

Kartarpur corridor stays open amid tensions

Hero and terrorist: The tale of two Adils in Pahalgam

Pahalgam survivor recalls horror, wife prays Shiva
Indian stock market sector-wise performance today - April 7, 2025


The stock market on Monday (April 7, 2025) witnessed a significant downturn with most indices closing in the red.
The Nifty Metal index emerged as the most affected sector, experiencing a steep decline of 6.75%. This sharp decrease was driven by prevalent concerns in the metals market, possibly influenced by fluctuations in commodity prices and global trade dynamics, which have been putting pressure on metal stocks.
Other key indices also saw noteworthy changes, contributing to the overall negative sentiment in the market.
The benchmark Sensex fell by 2.95%, reflecting widespread selling across the board.
Similarly, the Nifty Auto index declined by 3.78%, indicating challenges within the automotive sector, potentially due to subdued demand expectations or supply chain disruptions.
The Nifty Bank index recorded a drop of 3.19%, highlighting underlying concerns within the financial sector, possibly fueled by interest rate decisions and banking sector reforms.
The Nifty Energy index also fell by 2.77%, driven by a combination of factors including fluctuating oil prices and energy demand uncertainties.
The IT sector represented by the Nifty IT index contracted by 2.51%, as the sector grapples with global tech market volatility and potential regulatory changes.
Meanwhile, the Nifty Infra index declined by 3.30%, suggesting potential slowdowns in infrastructure projects or funding challenges.
Despite these downturns, the Nifty FMCG index witnessed a relatively lower decline of 1.10%, possibly indicating some resilience due to the defensive nature of consumer goods in economic uncertainties.
The overall market sentiment was affected by a mix of domestic and global cues, ranging from inflationary pressures to geopolitical tensions, impacting investor confidence and leading to a broad-based sell-off across sectors.
Such extensive market corrections reflect growing concerns amongst investors about the future economic outlook and the sectors most susceptible to current financial and geopolitical climates.

Analysis for Sensex - April 07, 2025

The Sensex opened at 71,449.94 and closed lower at 73,137.90, marking a decline of 2.95% with a points change of -2,226.79. The Relative Strength Index (RSI) stands at 34.12, indicating potential oversold conditions. The 50-day and 200-day Exponential Moving Averages (EMA) are 76,116.34 and 77,093.90, respectively, both higher than the current close, suggesting a bearish trend.
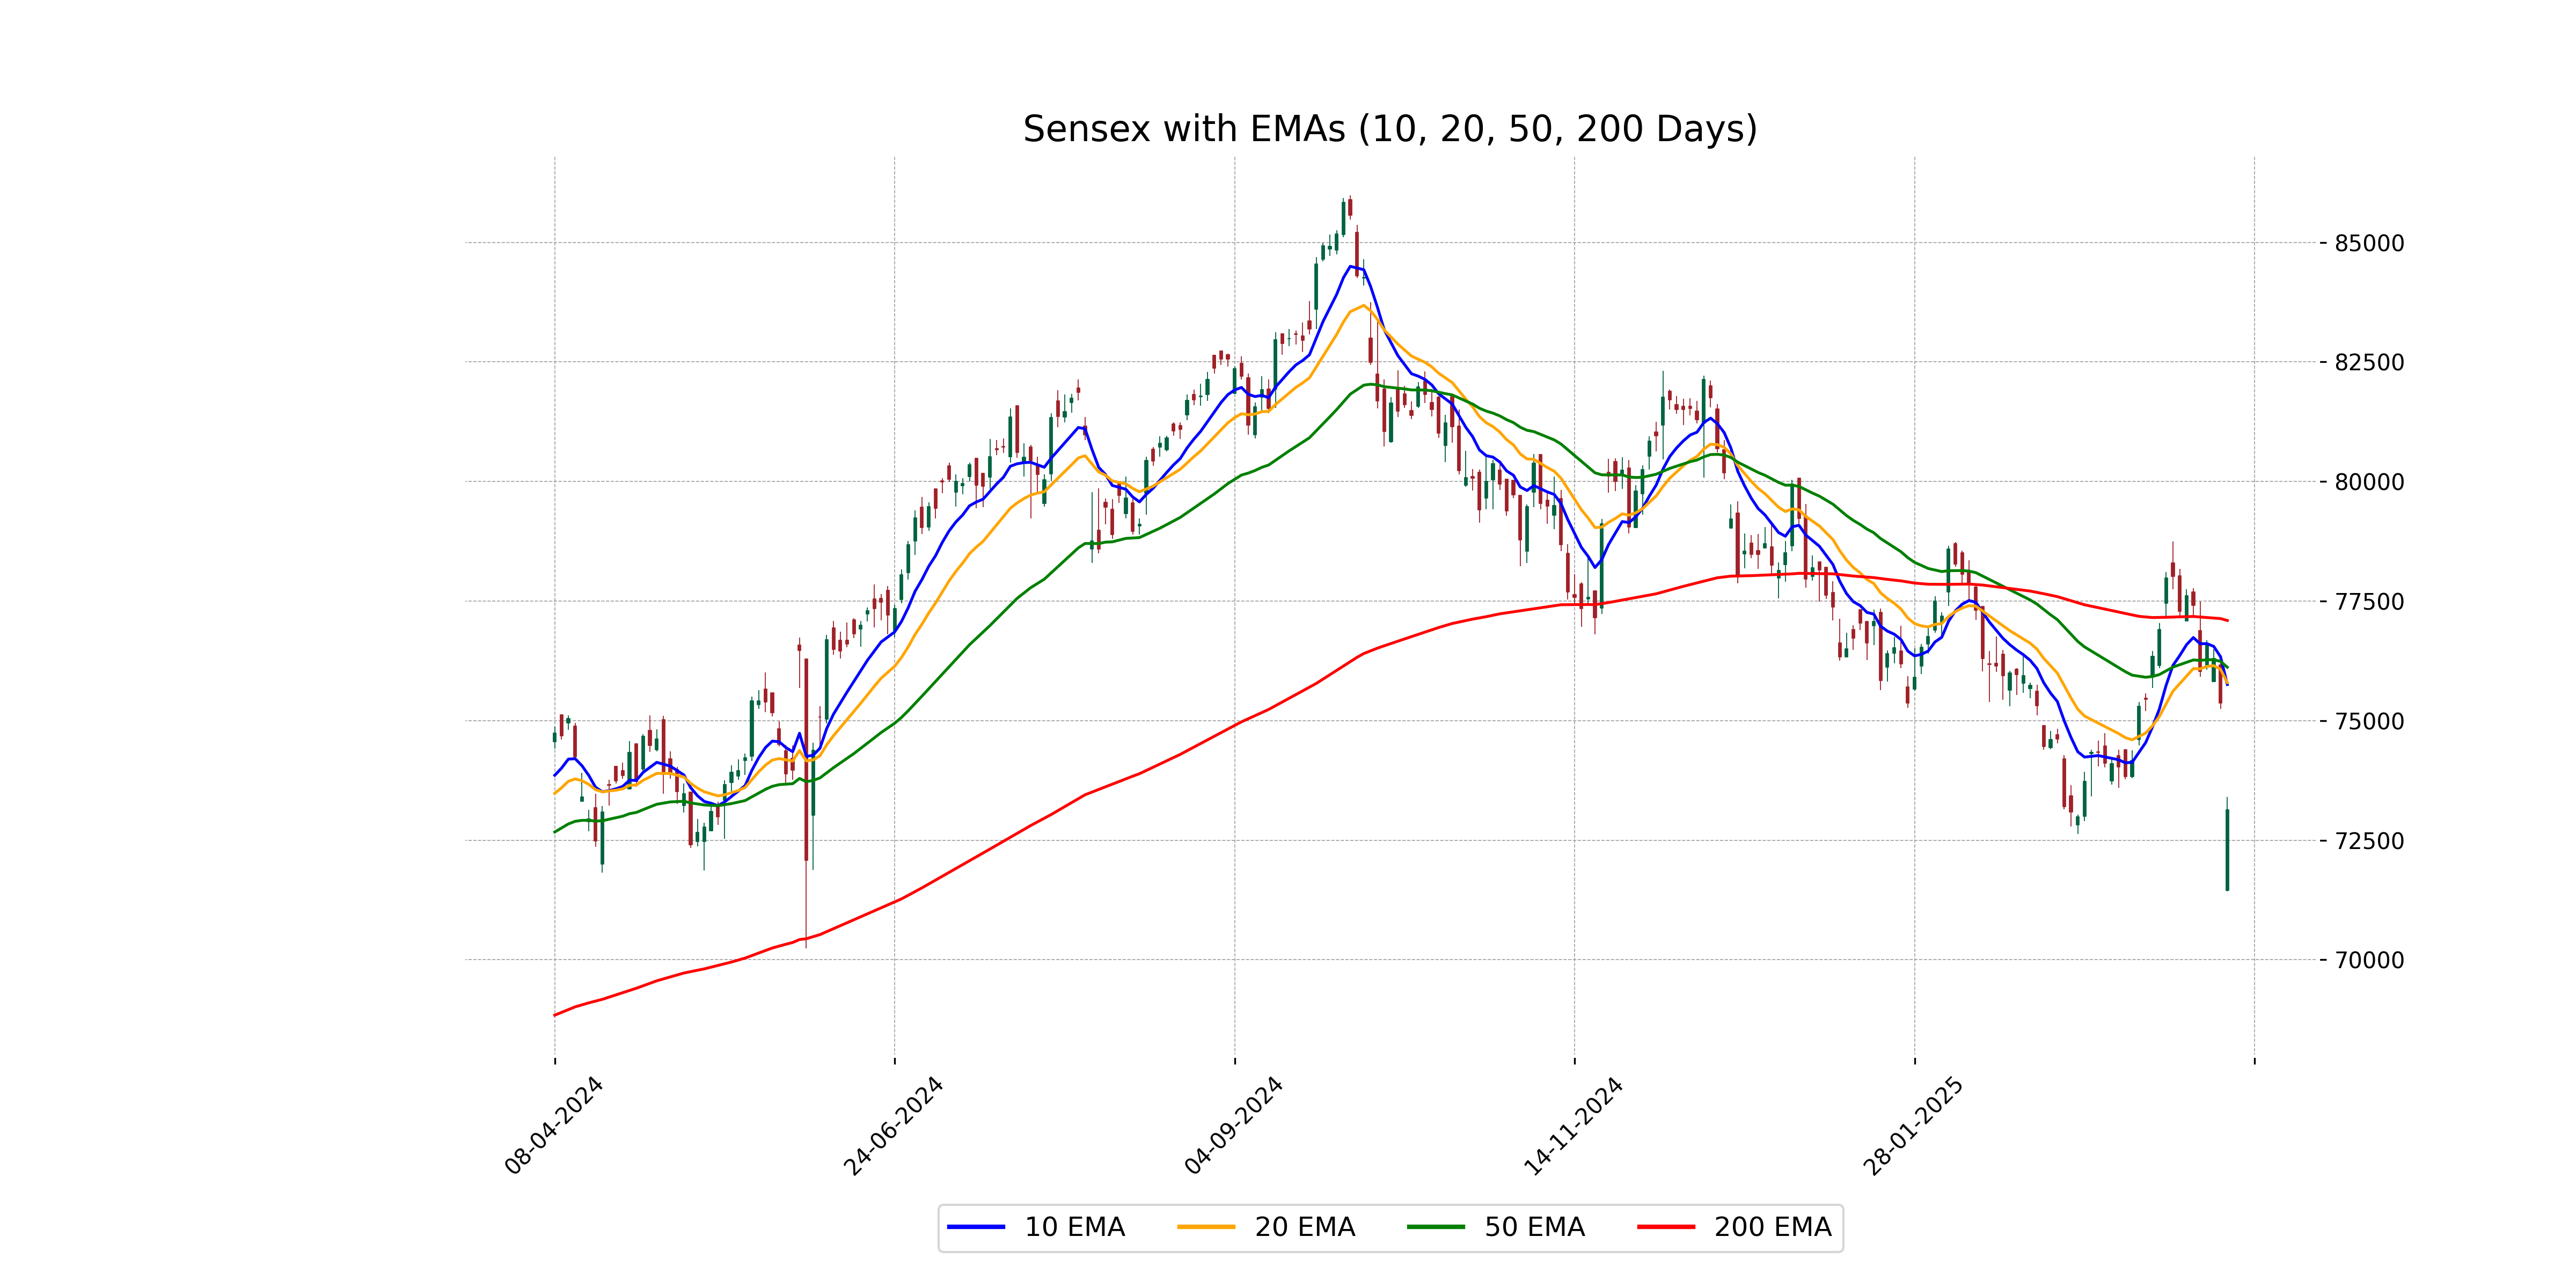
Relationship with Key Moving Averages
Sensex Relationship with Key Moving Averages: The closing price of Sensex is 73,137.90, which is below its 50-EMA (76,116.34), 200-EMA (77,093.89), 10-EMA (75,754.84), and 20-EMA (75,794.10), indicating a bearish trend in the near to medium term. The significant drop in its price compared to these moving averages suggests potential continued downward momentum.
Moving Averages Trend (MACD)
The MACD value of 12.98 is significantly below the MACD Signal of 229.35, indicating a bearish momentum for Sensex. Coupled with an RSI of 34.12, the index appears to be in a downtrend, suggesting caution for investors.

RSI Analysis
The Relative Strength Index (RSI) for Sensex stands at 34.12, which suggests a bearish sentiment as it is below the typical oversold threshold of 30. This indicates that the index might be nearing oversold conditions, potentially signaling a buying opportunity if it rebounds.

Analysis for Nifty Auto - April 07, 2025

Nifty Auto witnessed a decline with a closing value of 19,815.55, down from a previous close of 20,593.15, indicating a percentage change of -3.78% and a points decrease of 777.60. The RSI is at 29.01, suggesting oversold conditions, while both MACD and MACD Signal are negative, signaling bearish momentum.

Relationship with Key Moving Averages
The Nifty Auto index closed at 19,815.55, which is significantly below its 50-day EMA of 21,669.85 and 200-day EMA of 22,657.32, indicating a bearish trend. Additionally, the close is below the 10-day EMA of 20,969.50 and 20-day EMA of 21,164.46, suggesting recent downward momentum.
Moving Averages Trend (MACD)
MACD Analysis for Nifty Auto: The MACD of -235.50, compared to a signal line of -145.53, indicates a bearish trend for Nifty Auto, as the MACD is significantly below the signal line. This suggests that the momentum may continue to be negative.

RSI Analysis
The RSI value of 29.01 for Nifty Auto indicates that the index is in the oversold territory. This suggests that the market sentiment is bearish, and there may be a potential for a price reversal or a short-term rally if buying interest increases.

Analysis for Nifty Energy - April 07, 2025

Nifty Energy experienced a decline with a closing price of 31,414.55, showing a decrease of 2.77% or 894.35 points from the previous close. The technical indicators point towards bearish momentum, with the RSI at 39.82 suggesting oversold conditions. The MACD is below its signal line, indicating a potential for continued downward pressure.

Relationship with Key Moving Averages
The Nifty Energy index closed at 31,414.55, which is below its 50 EMA of 32,811.81 and 200 EMA of 35,737.78, indicating a bearish trend. Additionally, the close is below both the 10 EMA of 32,776.26 and 20 EMA of 32,625.48, suggesting continued downward pressure.
Moving Averages Trend (MACD)
MACD Analysis for Nifty Energy: The MACD line is currently below the MACD Signal line, which is typically a bearish signal. With the MACD standing at 213.73 compared to the Signal line at 318.84, this indicates potential continued downward pressure on the index.

RSI Analysis
The RSI for Nifty Energy is at 39.82, indicating that the index is nearing the oversold territory, as RSI values below 30 typically suggest this condition. It suggests that the index has experienced significant selling pressure and may be due for a reversal if it enters the oversold zone.

Analysis for Nifty FMCG - April 07, 2025

Nifty FMCG saw a decline with a closing value of 53241.15, down by -1.10% from the previous close, indicating a drop of approximately 589.55 points. The stock opened at 51201.90, reaching a high of 53395.45 during the session. Despite the drop, the RSI stands at 52.08, suggesting the index is relatively neutral in terms of momentum.

Relationship with Key Moving Averages
Stock Name: Nifty FMCG Closing Price: 53241.15 Relationship with Key Moving Averages: The closing price of Nifty FMCG is below the 50 EMA of 53596.43, indicating a possible short-term downtrend, but it is above the 10 EMA of 53316.42 and the 20 EMA of 53060.22, suggesting potential minor upward momentum.
Moving Averages Trend (MACD)
The MACD for Nifty FMCG stands at 177.72, significantly above the MACD Signal of 3.93, suggesting a bullish momentum in the stock. The gap between the MACD line and the Signal line indicates that the recent upward trend may continue in the short term.

RSI Analysis
The current RSI for Nifty FMCG is 52.08, indicating a neutral market status, as it is neither in the overbought nor oversold territory. This suggests relatively balanced momentum, with no strong upward or downward trend pressure.

Analysis for Nifty Infra - April 07, 2025

Nifty Infra had a significant drop in performance, closing at 7959.95, which is a 3.30% decrease from its previous close of 8231.65, marking a points change of -271.70. The relative strength index (RSI) at 38.96 suggests that the index is nearing oversold territory. The moving averages indicate a bearish trend with the current price below key EMA levels.

Relationship with Key Moving Averages
Nifty Infra closed at 7959.95, which is below its 10-day EMA of 8280.28, 20-day EMA of 8235.93, 50-day EMA of 8213.99, and 200-day EMA of 8399.25. This indicates a bearish trend as the current price is lower than all key moving averages.
Moving Averages Trend (MACD)
Based on the provided data for Nifty Infra, the MACD (62.71) is below the MACD Signal (84.20), indicating a bearish signal. This suggests that the momentum for Nifty Infra is currently weakening, and investors might consider this a signal to exercise caution.

RSI Analysis
The RSI value for Nifty Infra is 38.96, indicating it is in the oversold territory. This suggests a potential buying opportunity, as the index may be undervalued. However, further analysis and confirmation from other indicators are advisable before making any decisions.

Analysis for Nifty IT - April 07, 2025

Nifty IT opened at 31,307.95 and closed at 32,668.80, showing a decrease of 842.65 points or -2.51% from the previous close of 33,511.45. The index experienced a high of 32,835.10 and a low of 30,918.95. The current RSI is 21.72, indicating that the index is in the oversold territory, while the MACD shows a bearish trend.

Relationship with Key Moving Averages
The Nifty IT index closed at 32668.80, which is below its 50 EMA at 38489.72, 20 EMA at 36375.40, and 10 EMA at 35321.74, indicating a bearish trend in the short to medium term. With the RSI at 21.72, the index is in the oversold territory, further emphasizing downward momentum.
Moving Averages Trend (MACD)
The Nifty IT index shows a negative MACD value of -1320.86, which is below its MACD Signal of -1070.93, indicating a bearish momentum in the short term. This suggests that the index may continue to face downward pressure, with a recent drop in price supporting this trend.

RSI Analysis
The RSI value for Nifty IT stands at 21.72, which suggests that the index might be in an oversold condition. This typically indicates that the index could be undervalued and might be poised for a potential price correction or rebound in the near term.

Analysis for Nifty Metal - April 07, 2025

The Nifty Metal index opened at 7691.0 and closed at 7846.35, experiencing a decline of 6.75% from the previous close. The index faced significant downward pressure, marked by a negative change of 568.10 points. With an RSI of 26.93, the index indicates oversold conditions, suggesting potential investor caution in the metal sector.

Relationship with Key Moving Averages
The Nifty Metal index closed at 7846.35, which is below its 50 EMA (8741.86), 200 EMA (8813.93), 10 EMA (8742.39), and 20 EMA (8808.44), indicating a bearish sentiment as it trades below these key moving averages. This may suggest a potential downtrend or weakness in the near term.
Moving Averages Trend (MACD)
Nifty Metal MACD Analysis: The MACD value of -14.40 suggests bearish momentum, as it is below the MACD Signal line of 113.69. This indicates a potential continuation of the recent downtrend, requiring careful monitoring for any further negative signals.

RSI Analysis
The RSI value for Nifty Metal is 26.93, indicating that the index is currently in the oversold territory. This suggests that there may be a potential for a price correction or rebound. Traders often view an RSI below 30 as a signal that the stock might be undervalued or experiencing excessive bearish pressure.

Analysis for Nifty Bank - April 07, 2025

Nifty Bank opened at 49,336.10 and closed at 49,860.10, marking a decrease of approximately 3.19% from the previous close of 51,502.70. The index saw a price movement between 49,156.95 and 50,426.25. The current RSI is 47.20, indicating a slightly bearish trend as it falls below the neutral mark of 50. The MACD line is above the signal line, suggesting some potential for upward momentum despite the recent decline.

Relationship with Key Moving Averages
Nifty Bank closed at 49860.10, which is slightly below its 50-day EMA of 49973.46 and 200-day EMA of 50038.32, suggesting a short-term bearish trend. Additionally, the close is significantly below the 10-day EMA of 50847.81 and the 20-day EMA of 50396.89, indicating further downward pressure.
Moving Averages Trend (MACD)
Based on the data for Nifty Bank, the MACD line is above the MACD Signal line, indicating a bullish signal in the current trend despite a recent decrease in the stock price. However, the RSI is below 50, suggesting that the upward momentum might not be very strong.

RSI Analysis
The RSI for Nifty Bank stands at approximately 47.20, indicating that the index is close to the neutral zone. An RSI below 30 typically suggests that an asset is oversold, while an RSI above 70 indicates it is overbought. Nifty Bank's current RSI suggests a balanced condition without extreme buying or selling pressure.

Analysis for Nifty 50 - April 07, 2025

Nifty 50 Performance: Nifty 50 opened at 21,758.40 and closed at 22,161.60, marking a decrease of approximately 3.24% from the previous close of 22,904.45, with a point change of -742.85. The day's trading was marked by a low volatility as indicated by zero trading volume. The RSI stands at 33.73, indicating a potential oversold condition. The MACD is below the signal line, suggesting a bearish trend.

Relationship with Key Moving Averages
Nifty 50's closing price is currently below all major key moving averages, including the 50-day EMA (23084.60), 200-day EMA (23389.24), 10-day EMA (23020.13), and 20-day EMA (23016.31). This indicates a bearish trend as the current price is significantly under these averages, suggesting weakness and potential continuation of the downtrend.
Moving Averages Trend (MACD)
MACD Analysis for Nifty 50: The MACD line is at 26.25, which is significantly below the MACD Signal line at 94.99. This suggests a bearish trend, indicating potential selling pressure in the near term.

RSI Analysis
Nifty 50 has an RSI of 33.73, suggesting that the index is approaching oversold conditions. A value below 30 typically indicates that the security is oversold, which may lead to a potential price reversal or consolidation in the near term.

Up Next
Indian stock market sector-wise performance today - April 7, 2025

Global stock market indices: How the world markets performed today - 25 April 2025

Indian stock market sector-wise performance today - April 25 2025

Top 5 Nifty 50 gainers today – April 25, 2025: Biggest stock moves

NSE Nifty 50: Top 5 stock losers of April 25, 2025

Global stock market indices: How the world markets performed today - 24 April 2025

More videos

Indian stock market sector-wise performance today - April 24 2025

Top 5 Nifty 50 gainers today – April 24, 2025: Biggest stock moves
NSE Nifty 50: Top 5 stock losers of April 24, 2025

Global stock market indices: How the world markets performed today - 23 April 2025

Indian stock market sector-wise performance today - April 23, 2025
Top 5 Nifty 50 gainers today – April 23, 2025: Biggest stock moves

NSE Nifty 50: Top 5 stock losers of April 23, 2025

Sensex, Nifty rise for 6th day on foreign fund inflows, buying in banking shares

Global stock market indices: How the world markets performed today - 22 April 2025

Indian stock market sector-wise performance today - April 22, 2025