


Highlights
Latest news

OnePlus 15R review: A clear shift in what the R-series stands for

PM Modi departs for Oman on last leg of three-nation visit

India closes visa application centre in Bangladesh capital due to security situation

Congress misleading public on National Herald case, matter still in court: BJP

Pakistan to sell 100 pc stake in PIA after bidders demand complete control post-privatisation

Goa nightclub fire: Luthra brothers taken to Anjuna police station after medical examination

10 Ahmedabad schools get bomb threat, turns out to be hoax after search

India summons Bangladesh envoy, conveys concerns over security of its mission in Dhaka
Indian Stock Market Sector-wise Performance: Which Sector is performed Well Today - April 15, 2025


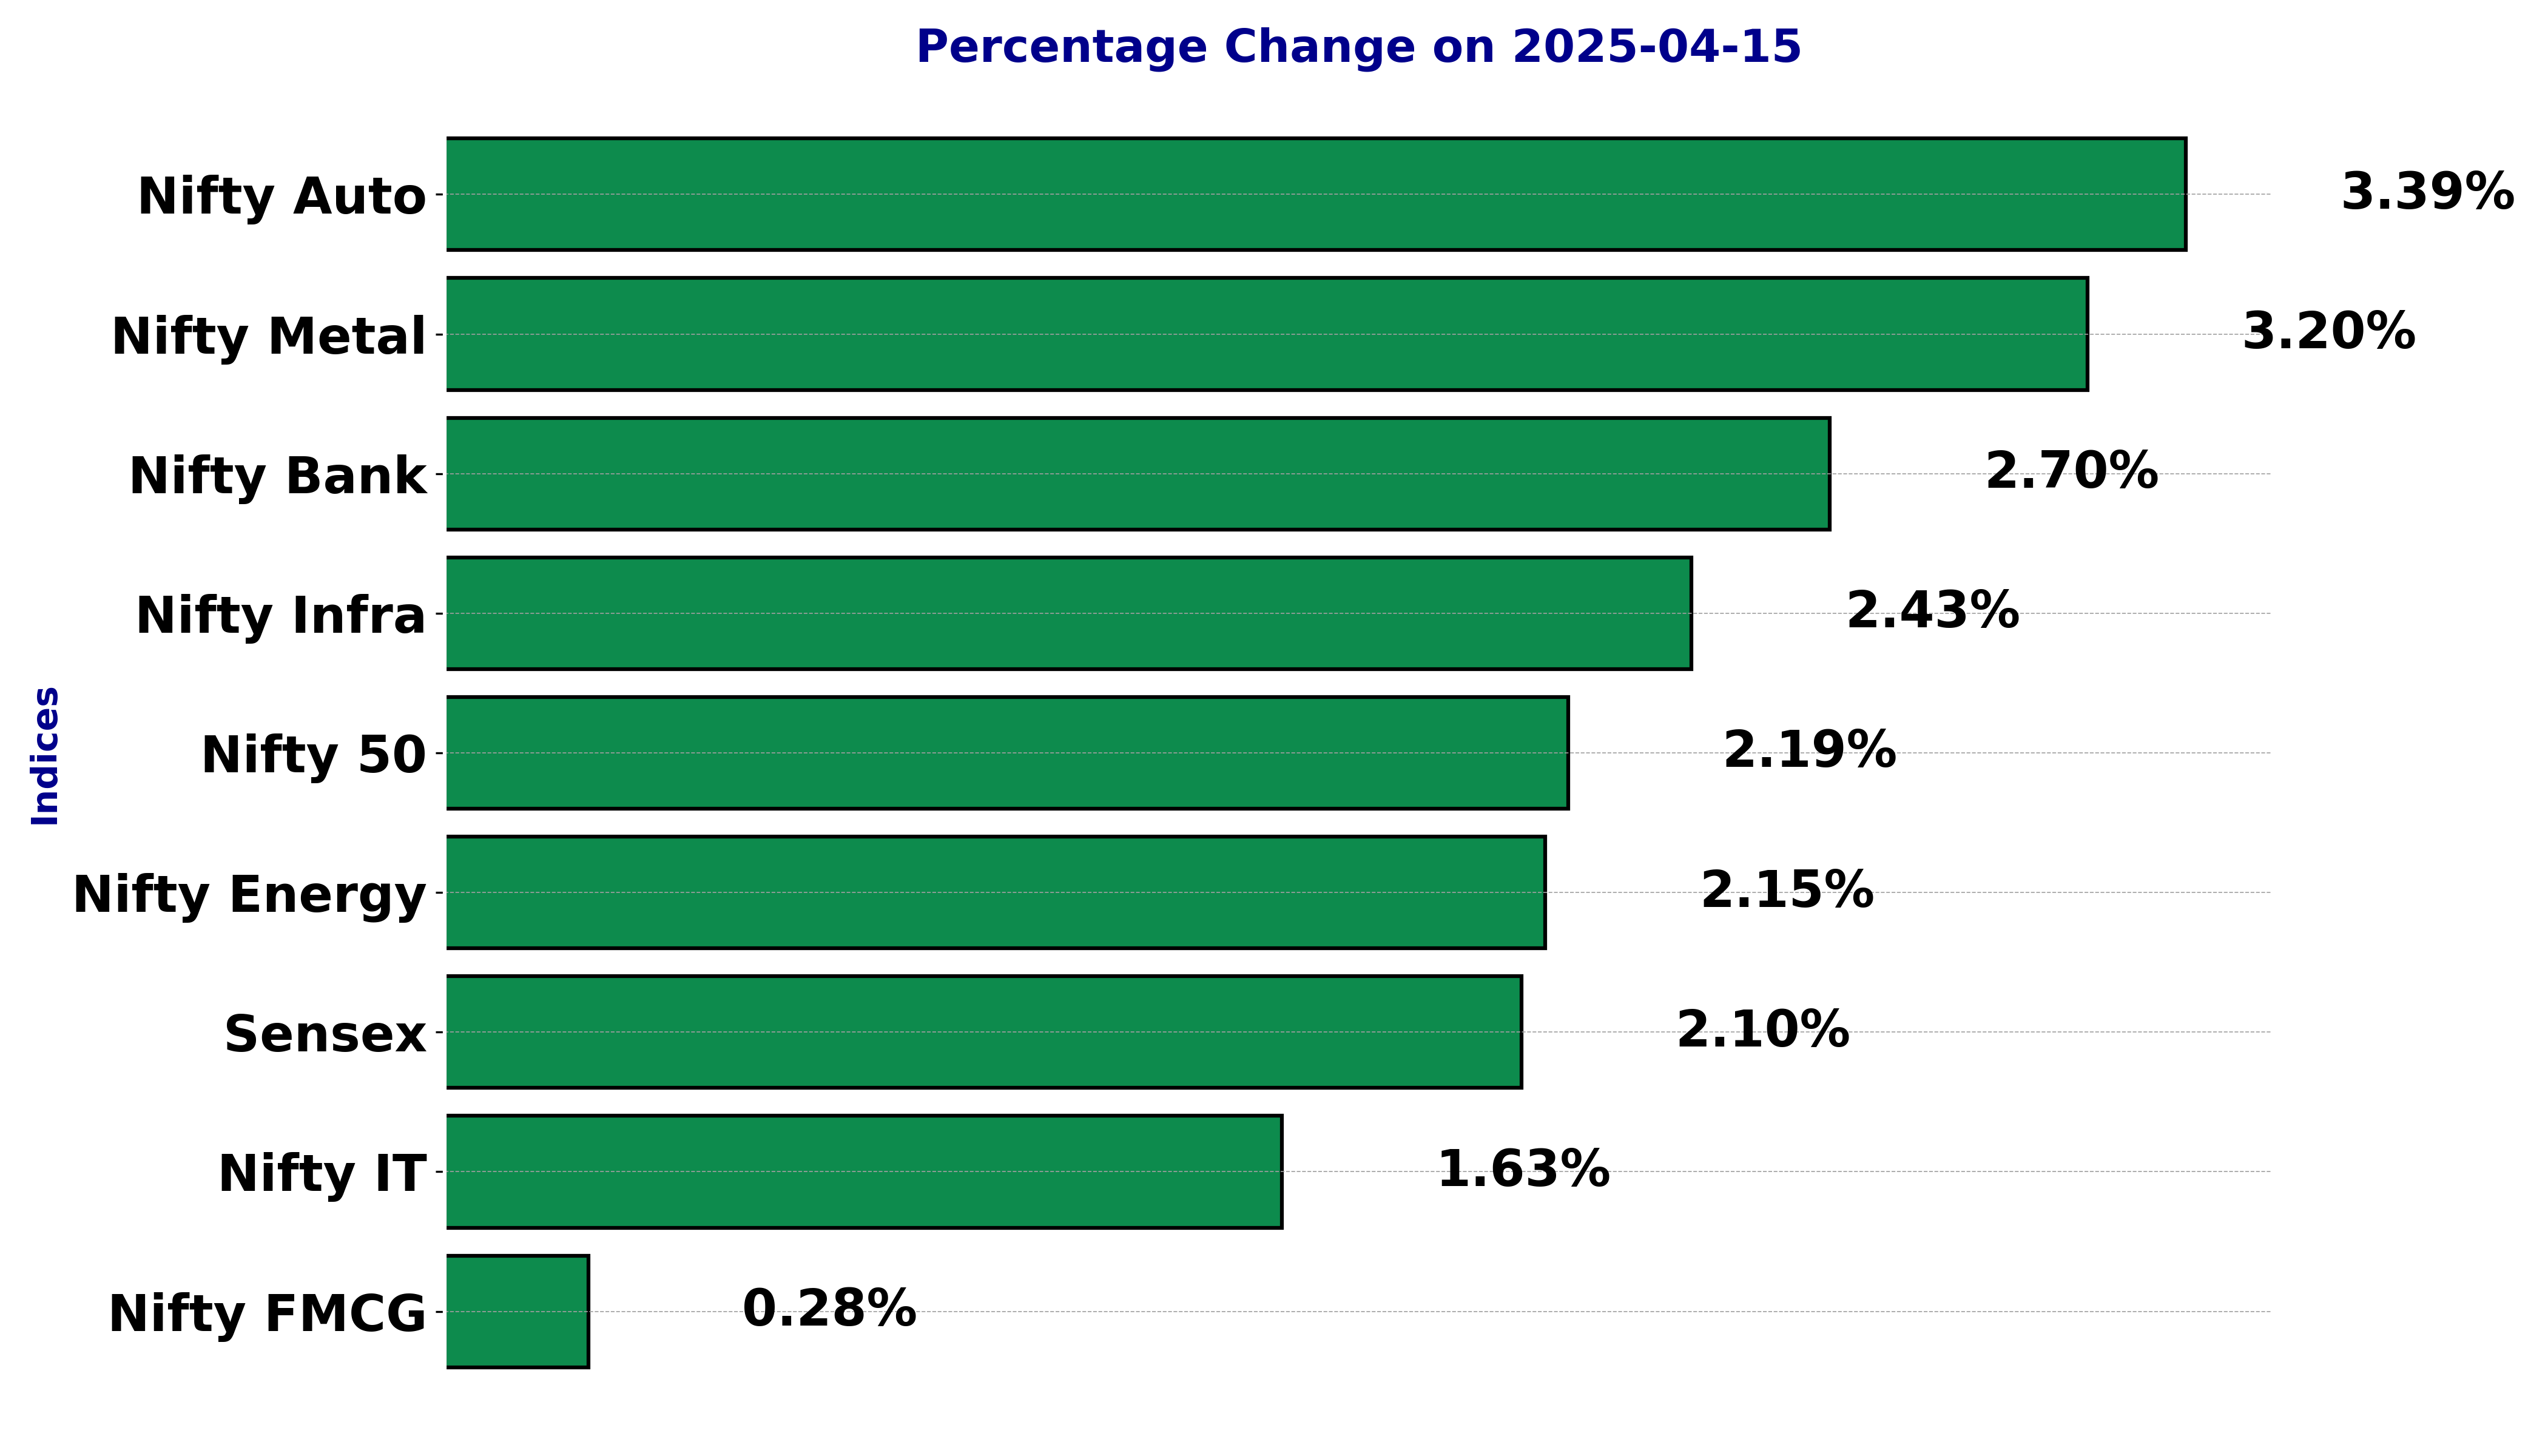
The recent trading session witnessed a notable performance across various sectors and indices in the stock market. The Sensex experienced a notable uptick, recording a 2.10% increase, closing at 76,734.89 points. This positive momentum was echoed across several key indices. The Nifty Auto index stood out with the highest percentage gain, soaring by 3.39%. This surge can be attributed to multiple factors including increased sales and positive investor sentiment towards the auto sector, potentially driven by new model releases and government incentives. Following closely, the Nifty Metal index also experienced a significant increase, with a 3.20% rise. The gains in the metal sector reflect a robust demand in industrial commodities, possibly supported by infrastructure projects and global commodity trends. The Nifty Bank index showcased a strong performance as well, climbing by 2.70%. The banking sector’s positive trajectory could be linked to improved earnings reports and a favorable interest rate environment, boosting investor confidence. The Nifty Infra index rose by 2.43%, indicating positive investor sentiment towards infrastructure development initiatives. Similarly, the Nifty Energy index saw a gain of 2.15%, likely influenced by stable crude prices and policy support for energy projects. Conversely, the Nifty FMCG index recorded modest growth, with a rise of only 0.28%. Despite this, the FMCG sector continued to attract investors, possibly due to its defensive nature amid market fluctuations. The Nifty IT index posted a gain of 1.63%, reflecting a cautious recovery in the technology sector. Despite global headwinds, there remains optimism for IT companies due to growing digital transformation trends. Overall, the session highlighted a broad-based rally across sectors, with the Nifty Auto and Nifty Metal indices leading the charge. The strong performances in these sectors were driven by a mixture of favorable market conditions and strategic industry developments, offering positive indicators for the market's future trajectory.
Analysis for Sensex - April 15, 2025

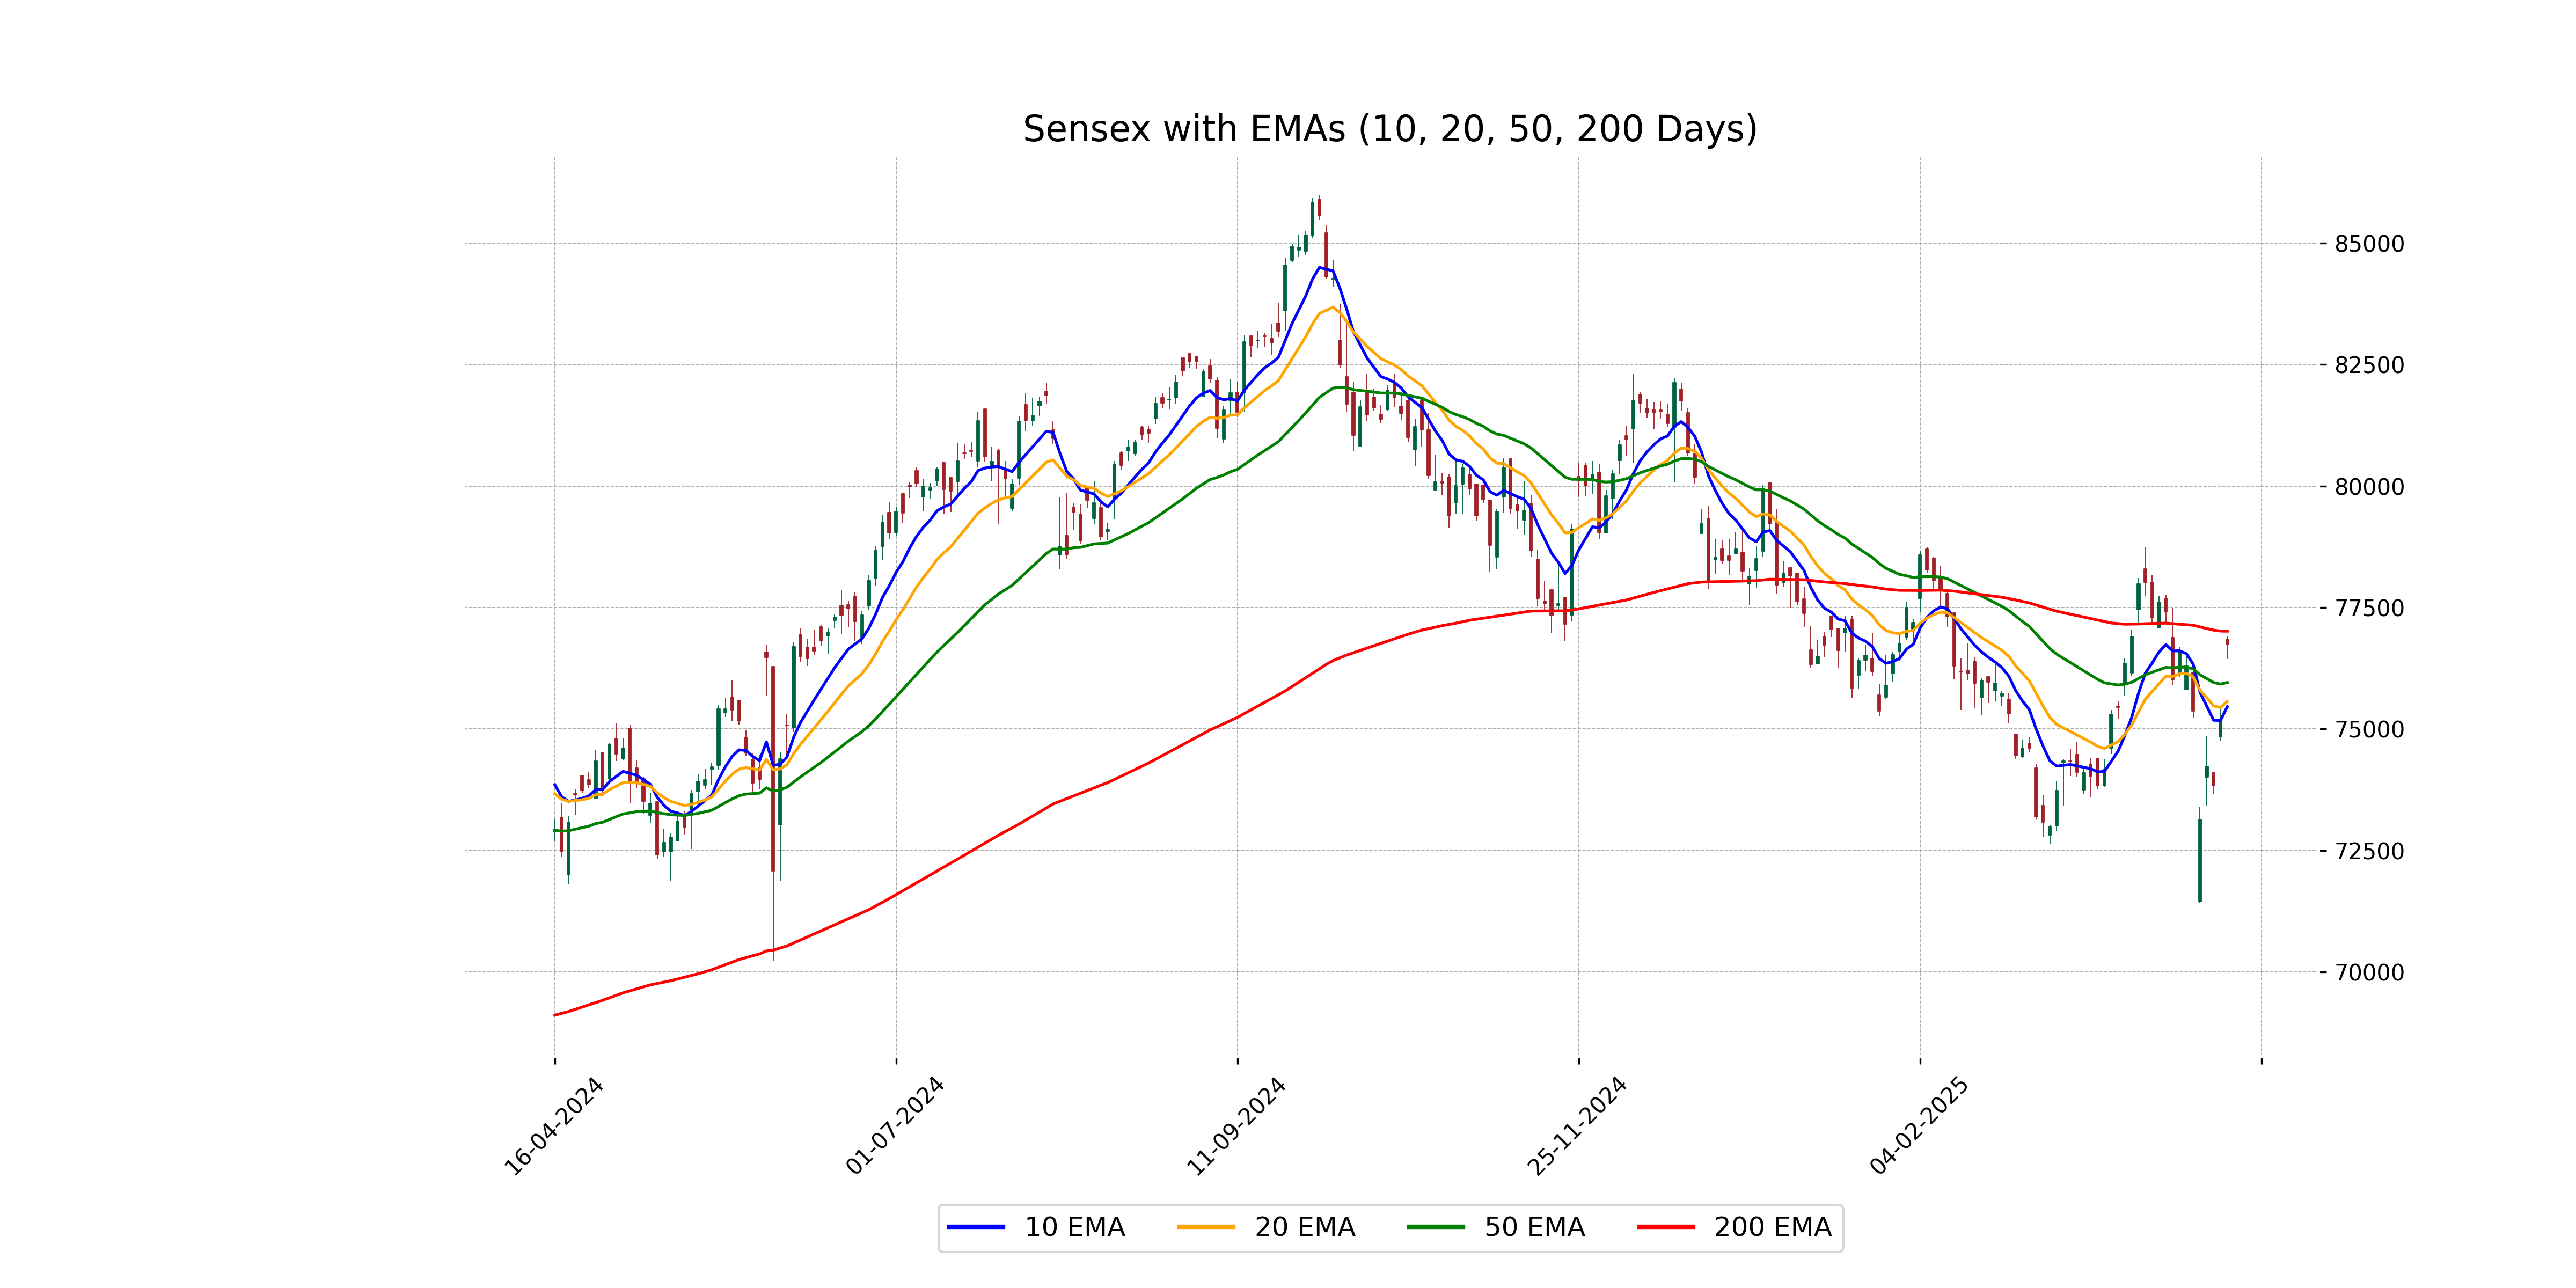
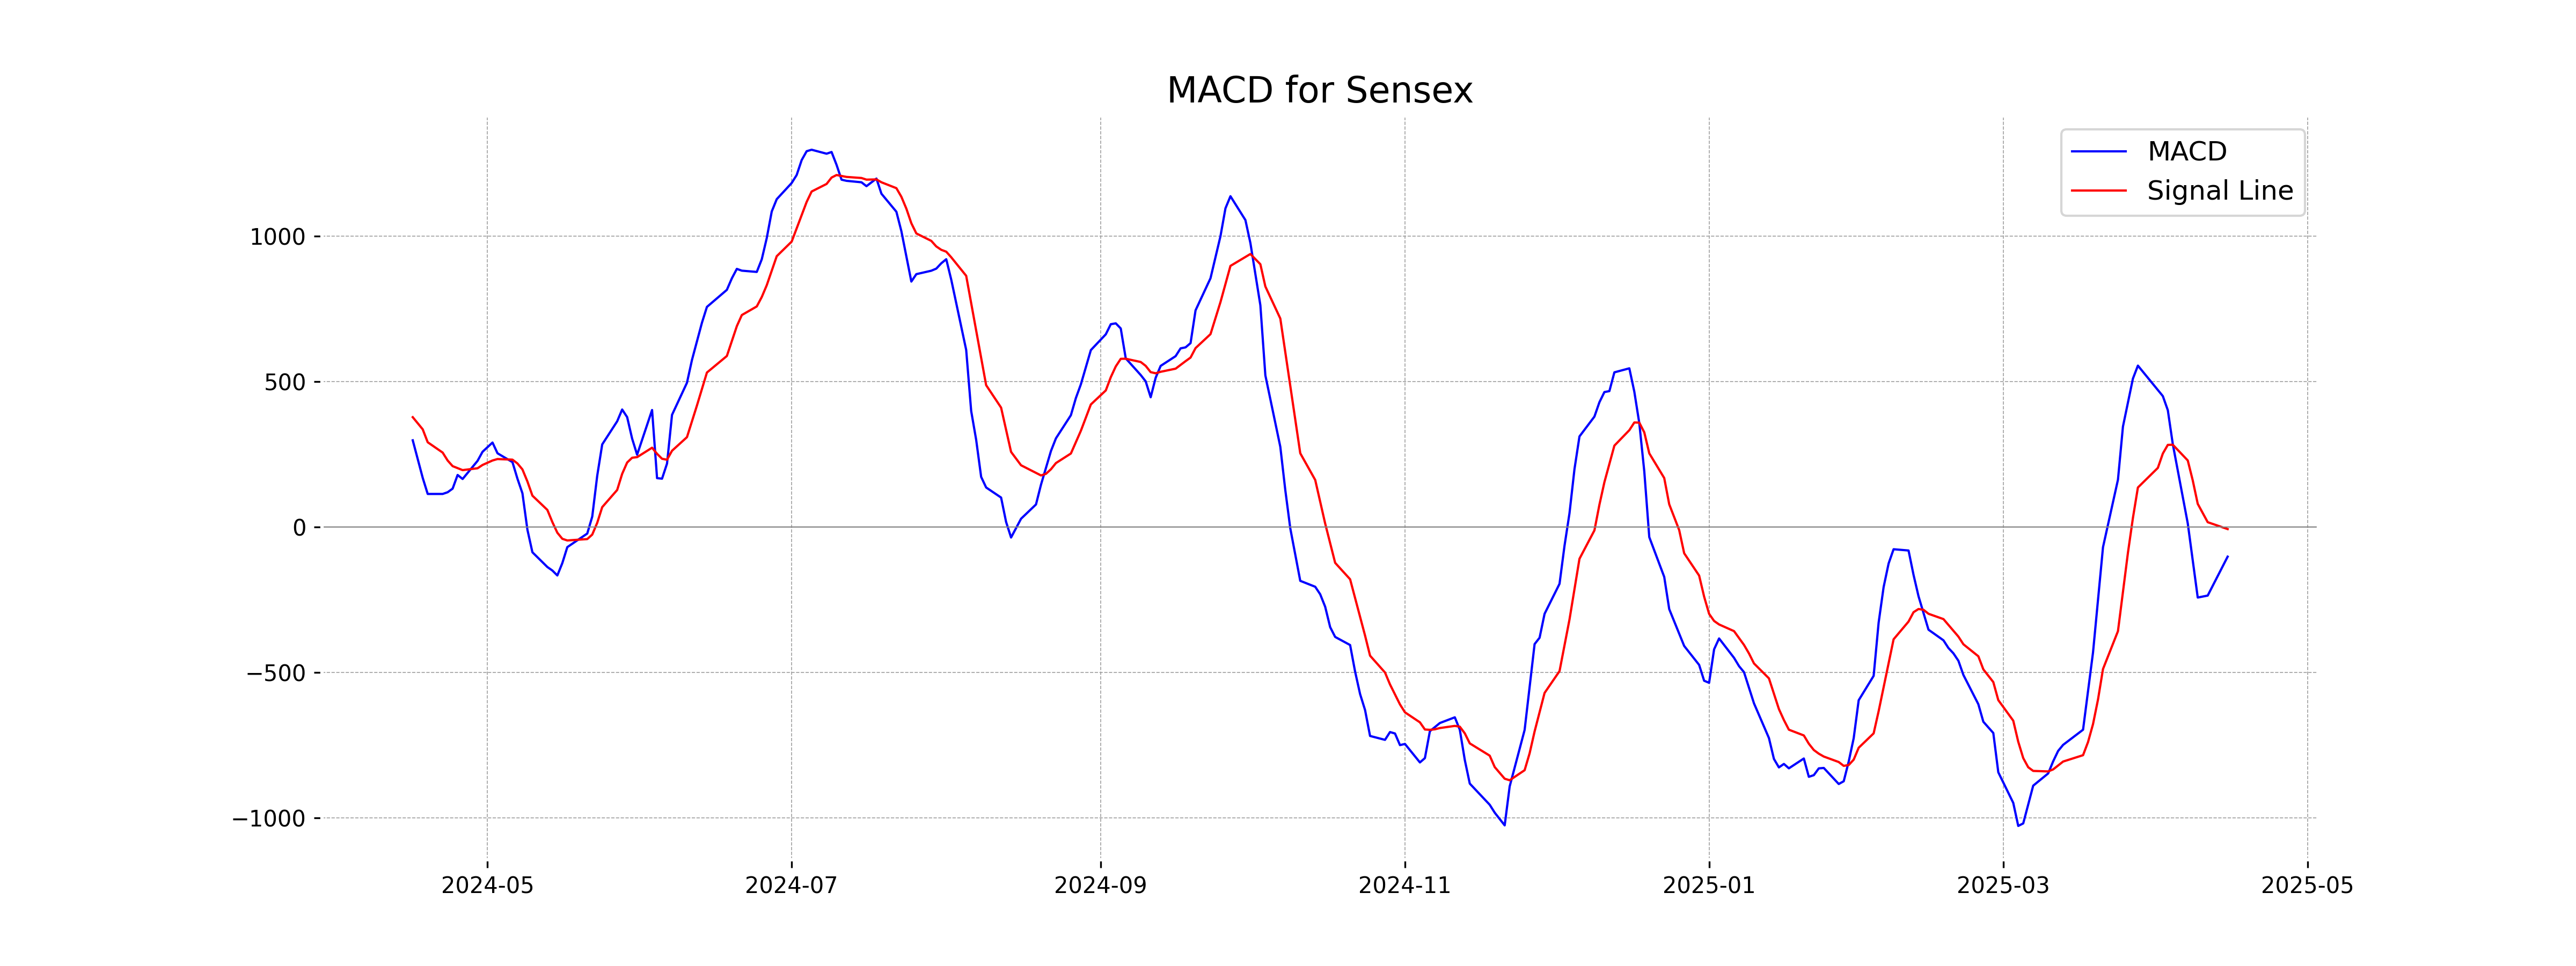
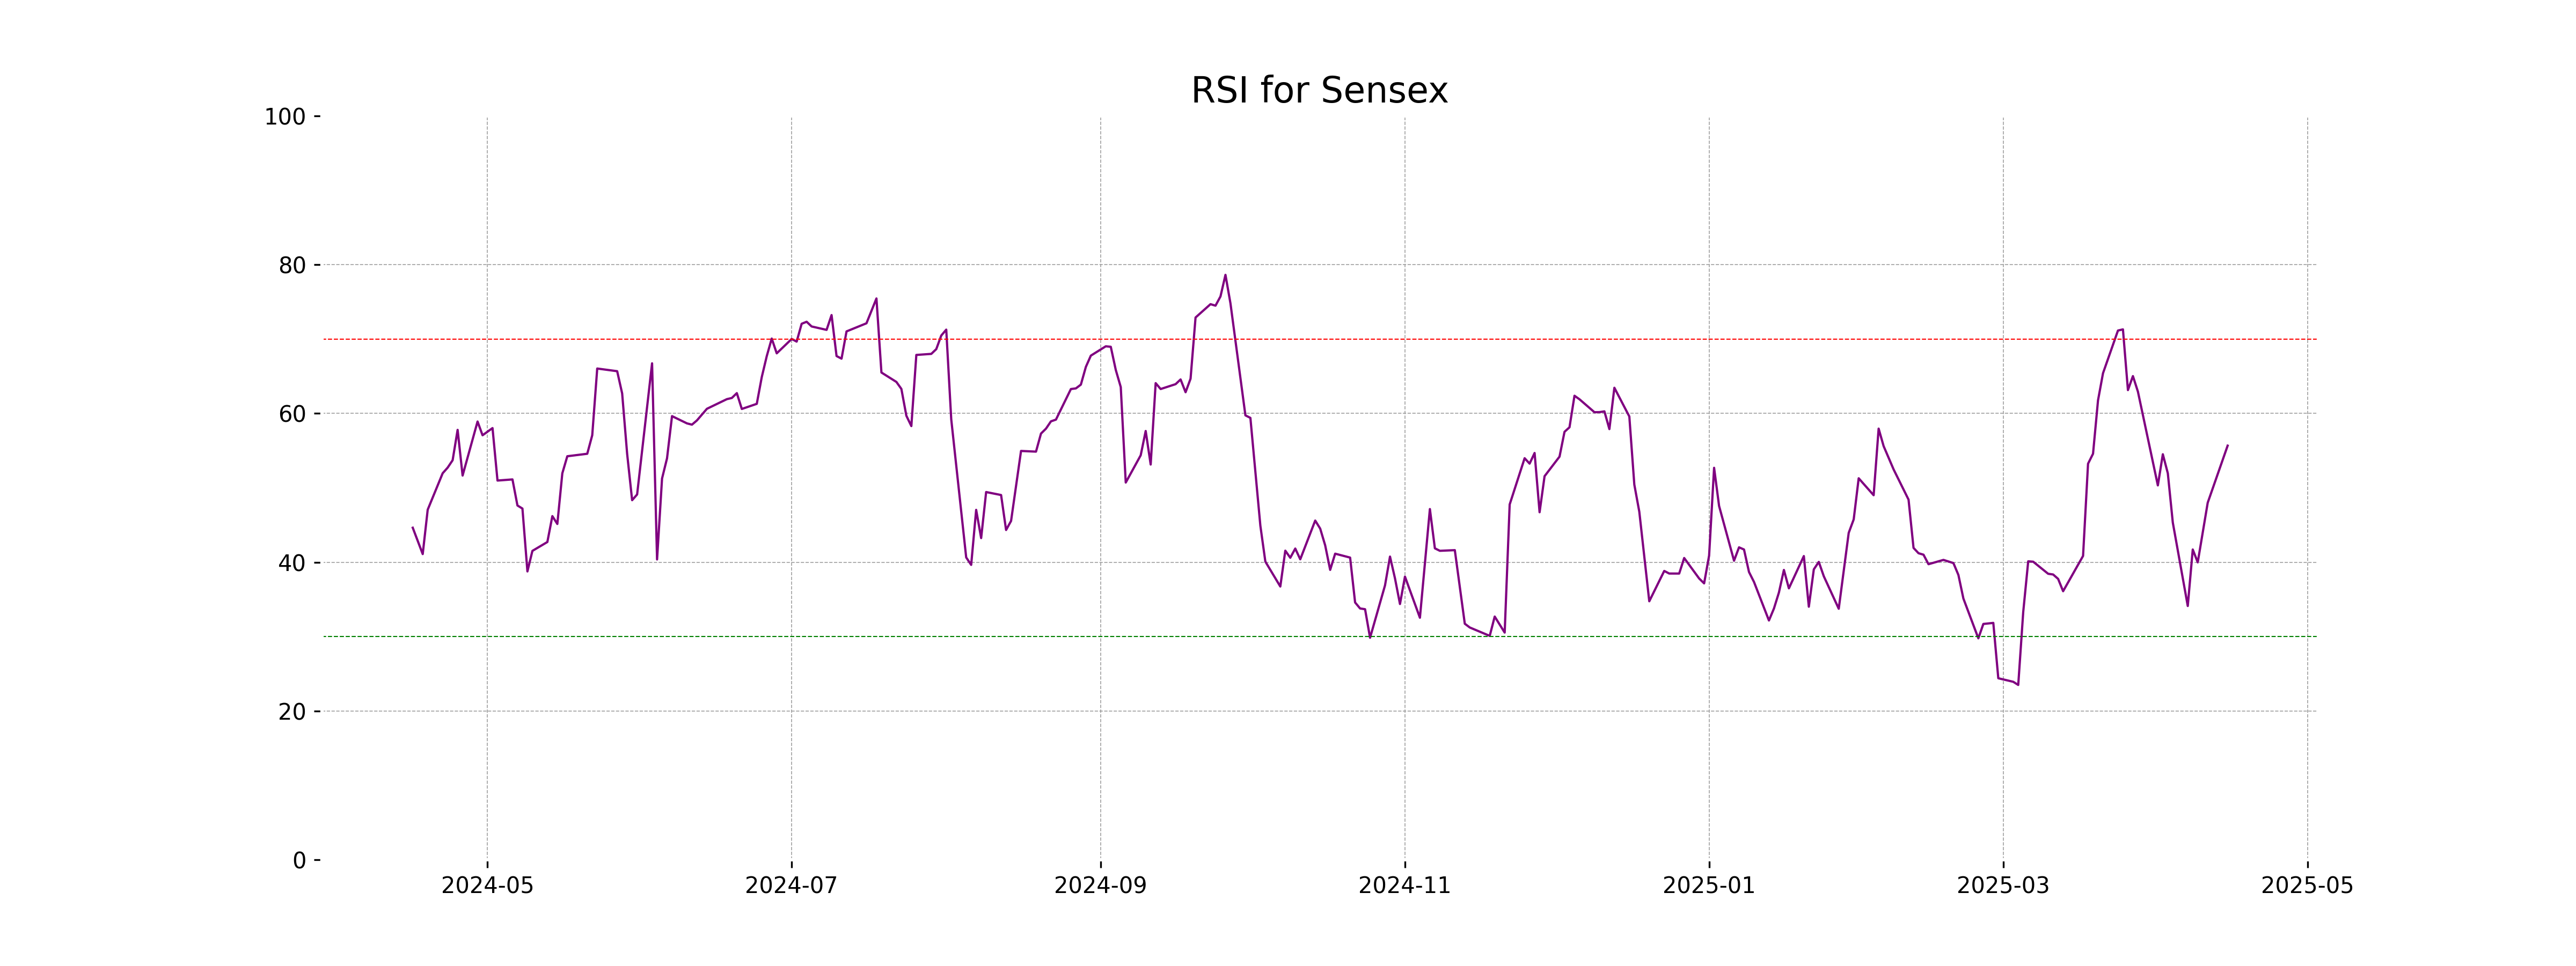
Sensex Performance Description: The Sensex opened at 76,852.06 and saw a high of 76,907.63 and a low of 76,435.07 before closing at 76,734.89. This represents a significant increase as compared to the previous close of 75,157.26, with a percentage change of approximately 2.10% and a points change of 1,577.63. The RSI indicates moderate strength at 55.67, while the MACD reflects a negative trend with a value of -101.36.
Relationship with Key Moving Averages
The current close of the Sensex at 76,734.89 is above the 50-day EMA of 75,956.61 and the 10-day EMA of 75,459.80, indicating a short-term upward momentum. However, it is just below the 200-day EMA of 77,013.43, suggesting that while the short-term trend is upward, the broader long-term trend may still be watched for further confirmation. The RSI of 55.67 suggests the market is neither overbought nor oversold.
Moving Averages Trend (MACD)
Based on the data provided, the MACD for Sensex is -101.36, with a MACD Signal of -6.58. This indicates that the MACD is below the signal line, suggesting a bearish trend. However, the recent increase in the percentage change of 2.10% may be a sign of potential reversal if the upward momentum continues.
RSI Analysis
The RSI for Sensex is currently at 55.67, which suggests a neutral zone—neither overbought nor oversold. This indicates a balance in buying and selling pressures, suggesting that the current trend might continue without immediate reversal pressures.
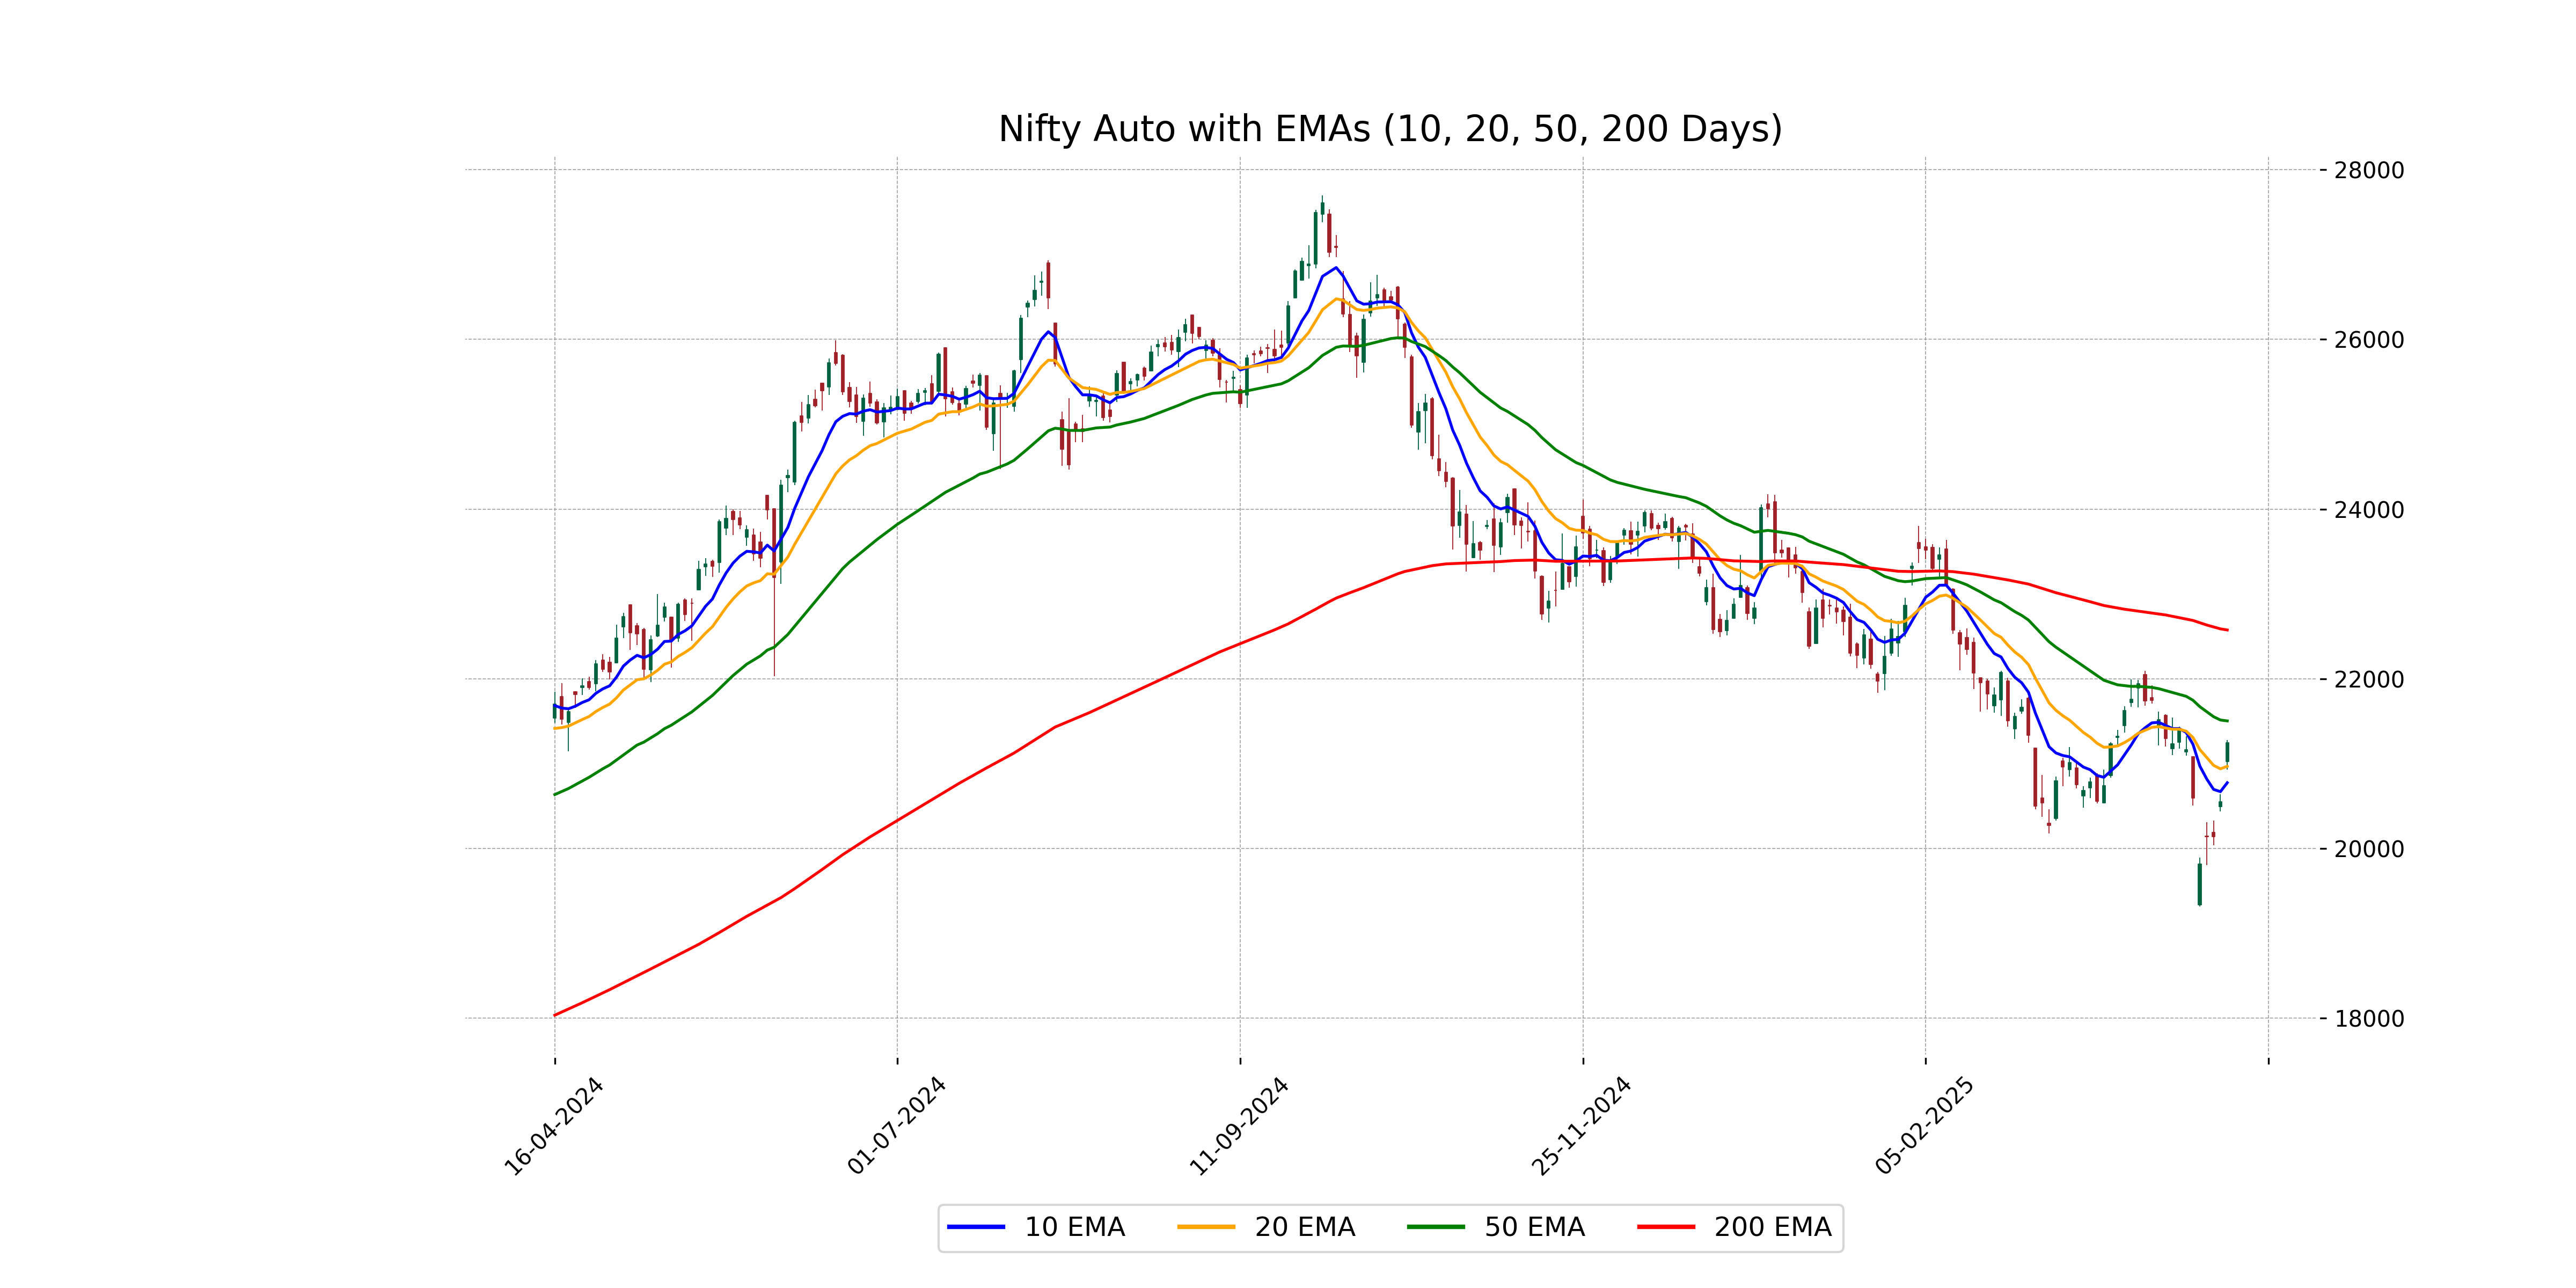
Analysis for Nifty Auto - April 15, 2025
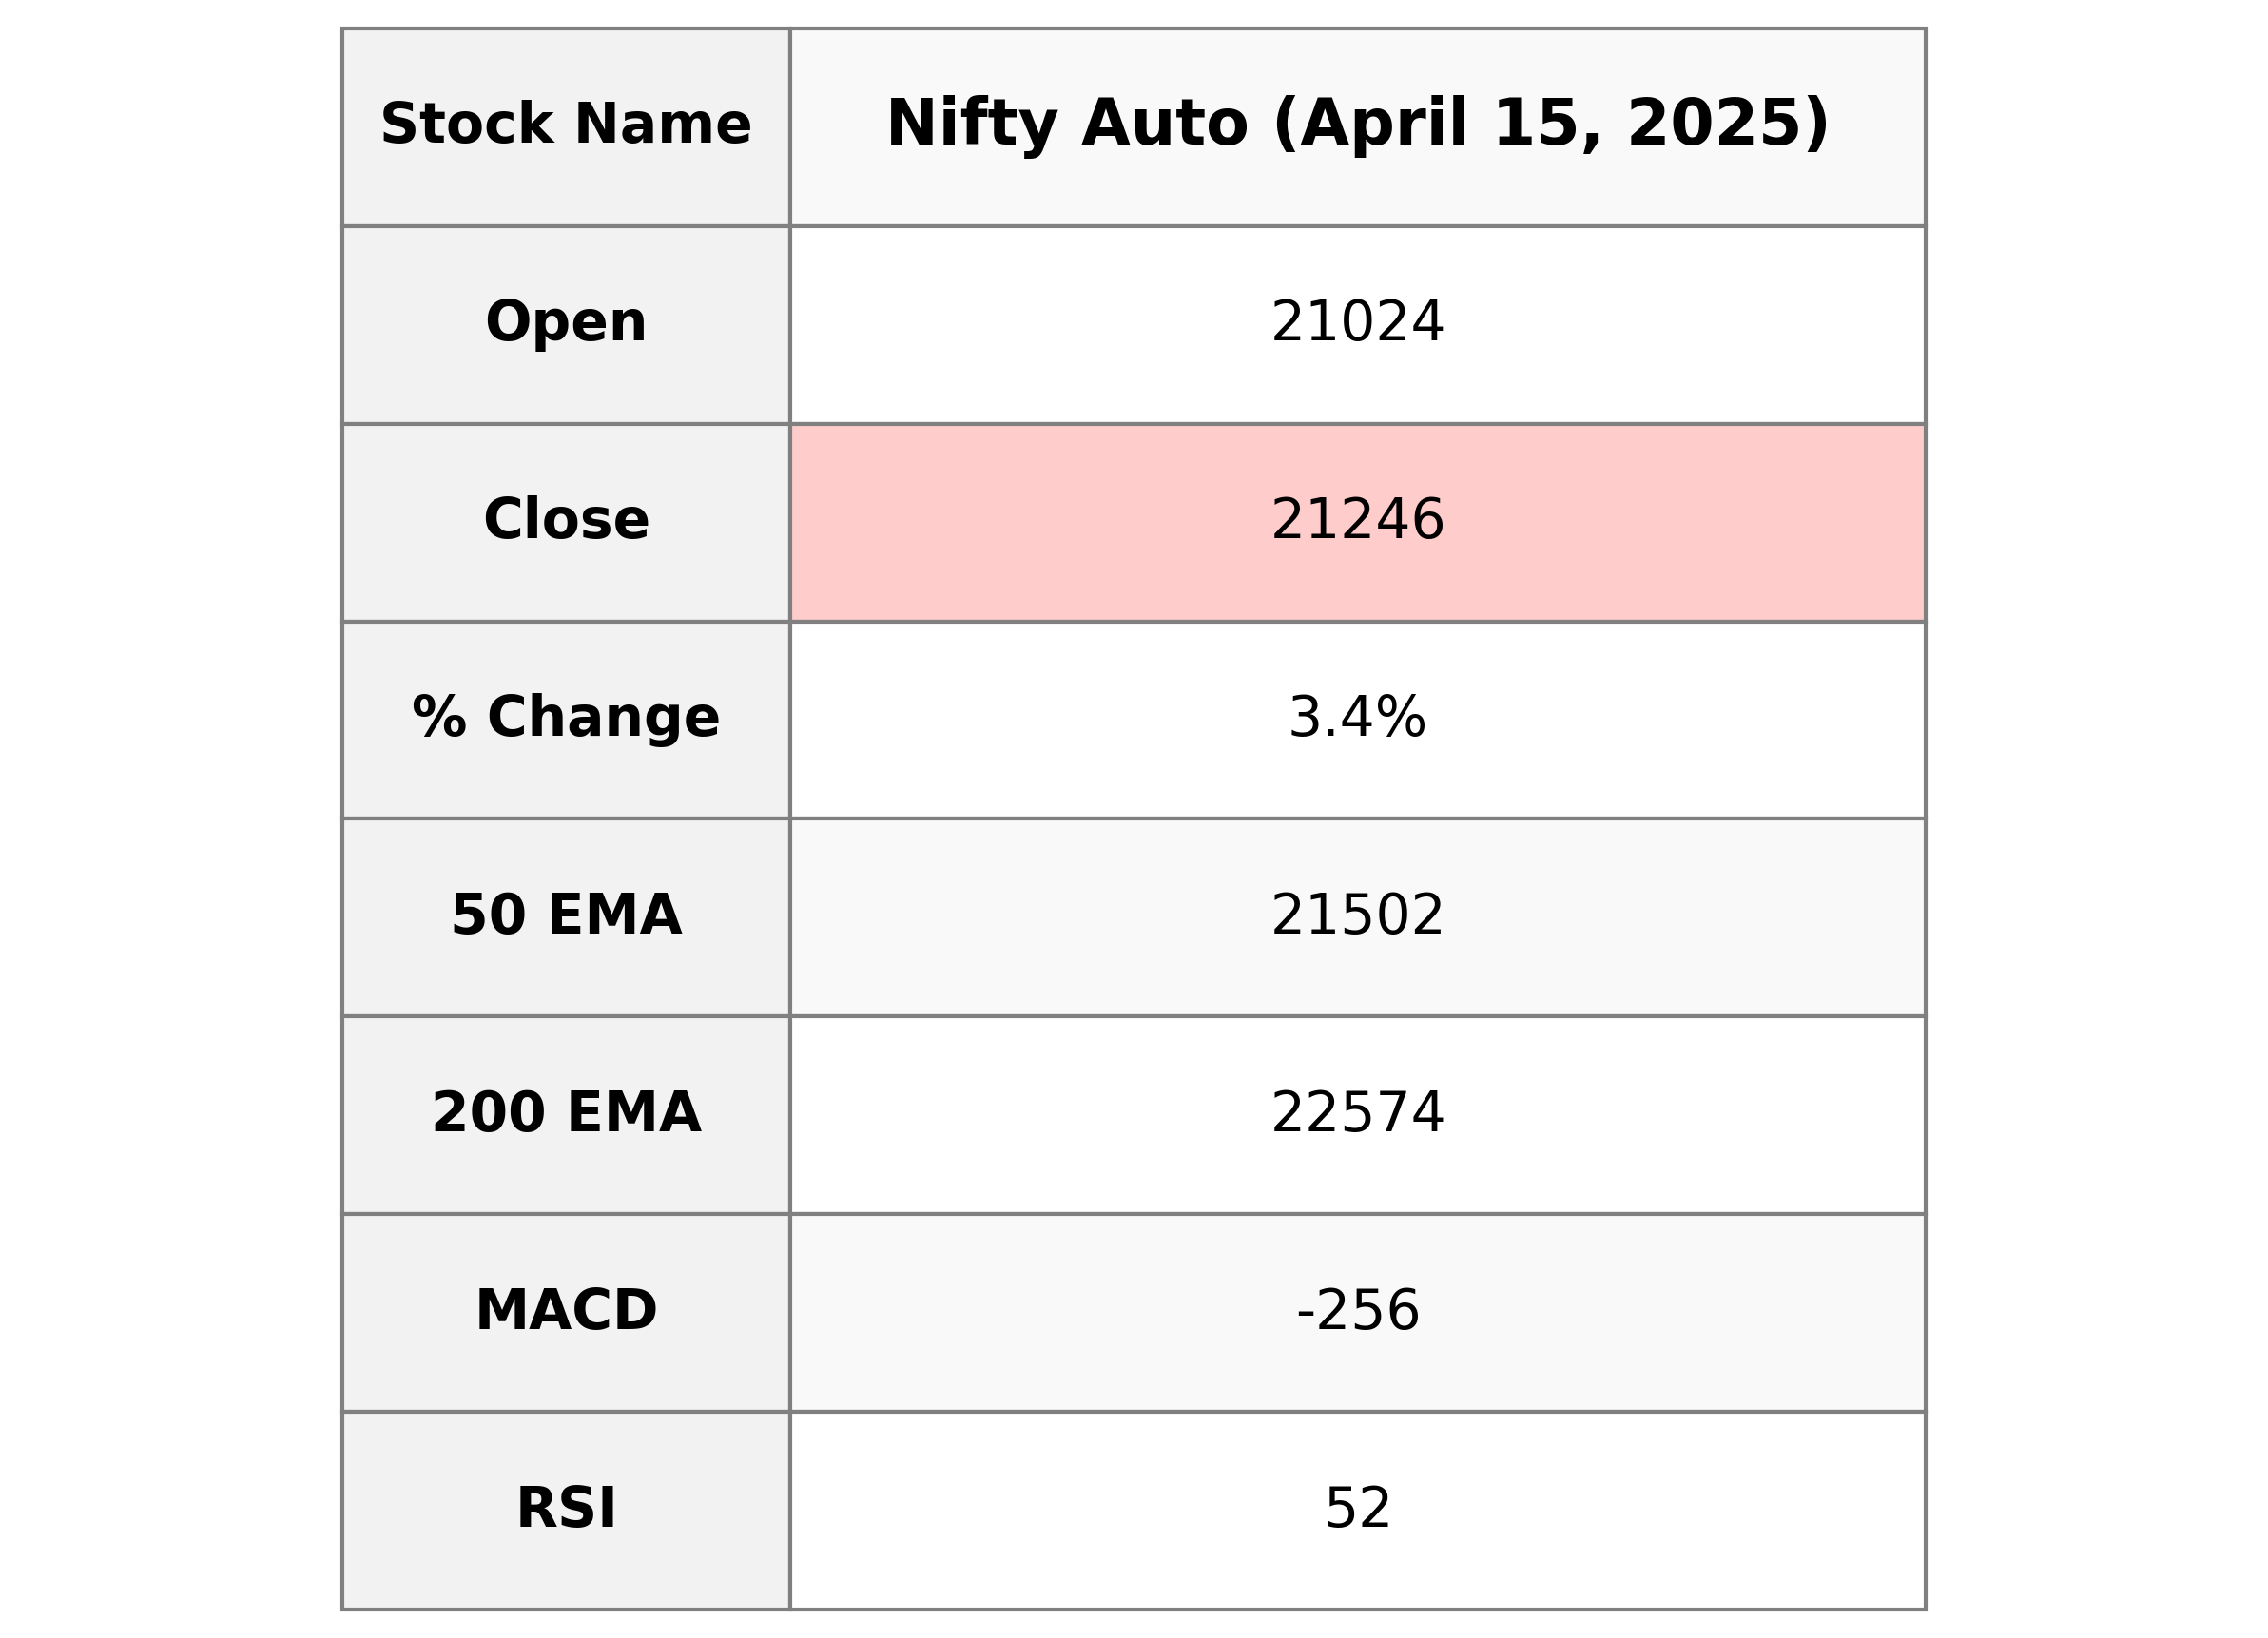
The Nifty Auto index opened at 21023.95 and showed a strong performance, closing higher at 21246.20. It recorded a significant gain with a percentage change of approximately 3.39%, reflecting a points increase of 697.55 from the previous close of 20548.65. Key indicators such as the 50-day and 20-day EMAs are higher than the closing price, although the index managed to close above the 10-day EMA. The Relative Strength Index (RSI) is at 52.03, indicating a neutral trend, while the MACD reflects a bearish sign.
Relationship with Key Moving Averages
The Nifty Auto index closed at 21,246.20, which is below its 50 EMA of 21,502.35 and the 200 EMA of 22,574.28, indicating a potential bearish trend in the longer term. However, it is trading above the 10 EMA of 20,773.50 and the 20 EMA of 20,966.96, suggesting short-term bullish momentum.
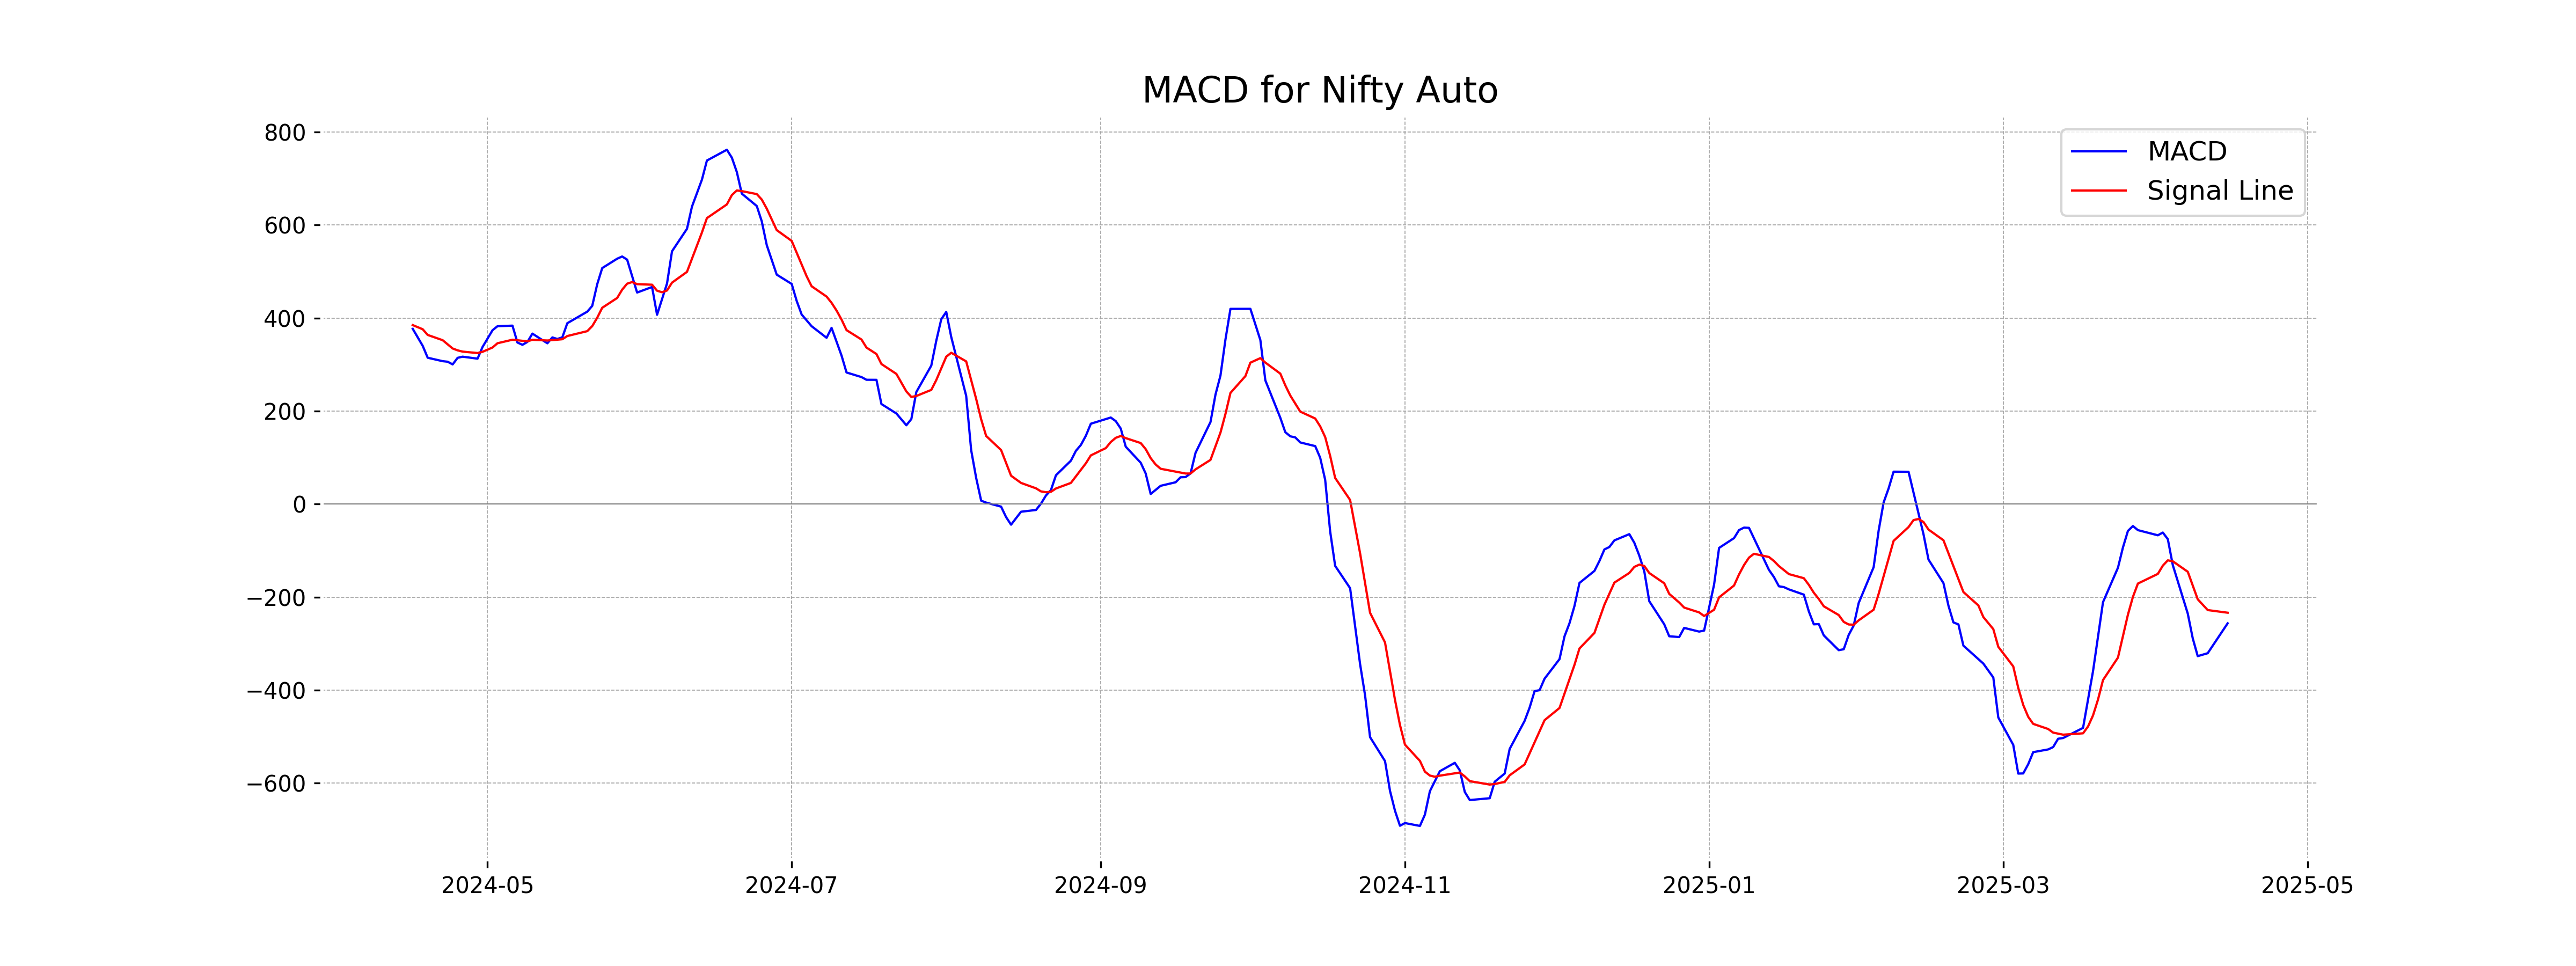
Moving Averages Trend (MACD)
MACD Analysis for Nifty Auto: The MACD is currently at -256.47, with the MACD Signal at -233.65. This indicates a bearish trend, as the MACD line is below the signal line. However, as the values are relatively close, there is a possibility of a crossover that could signal a reversal or improvement in momentum.
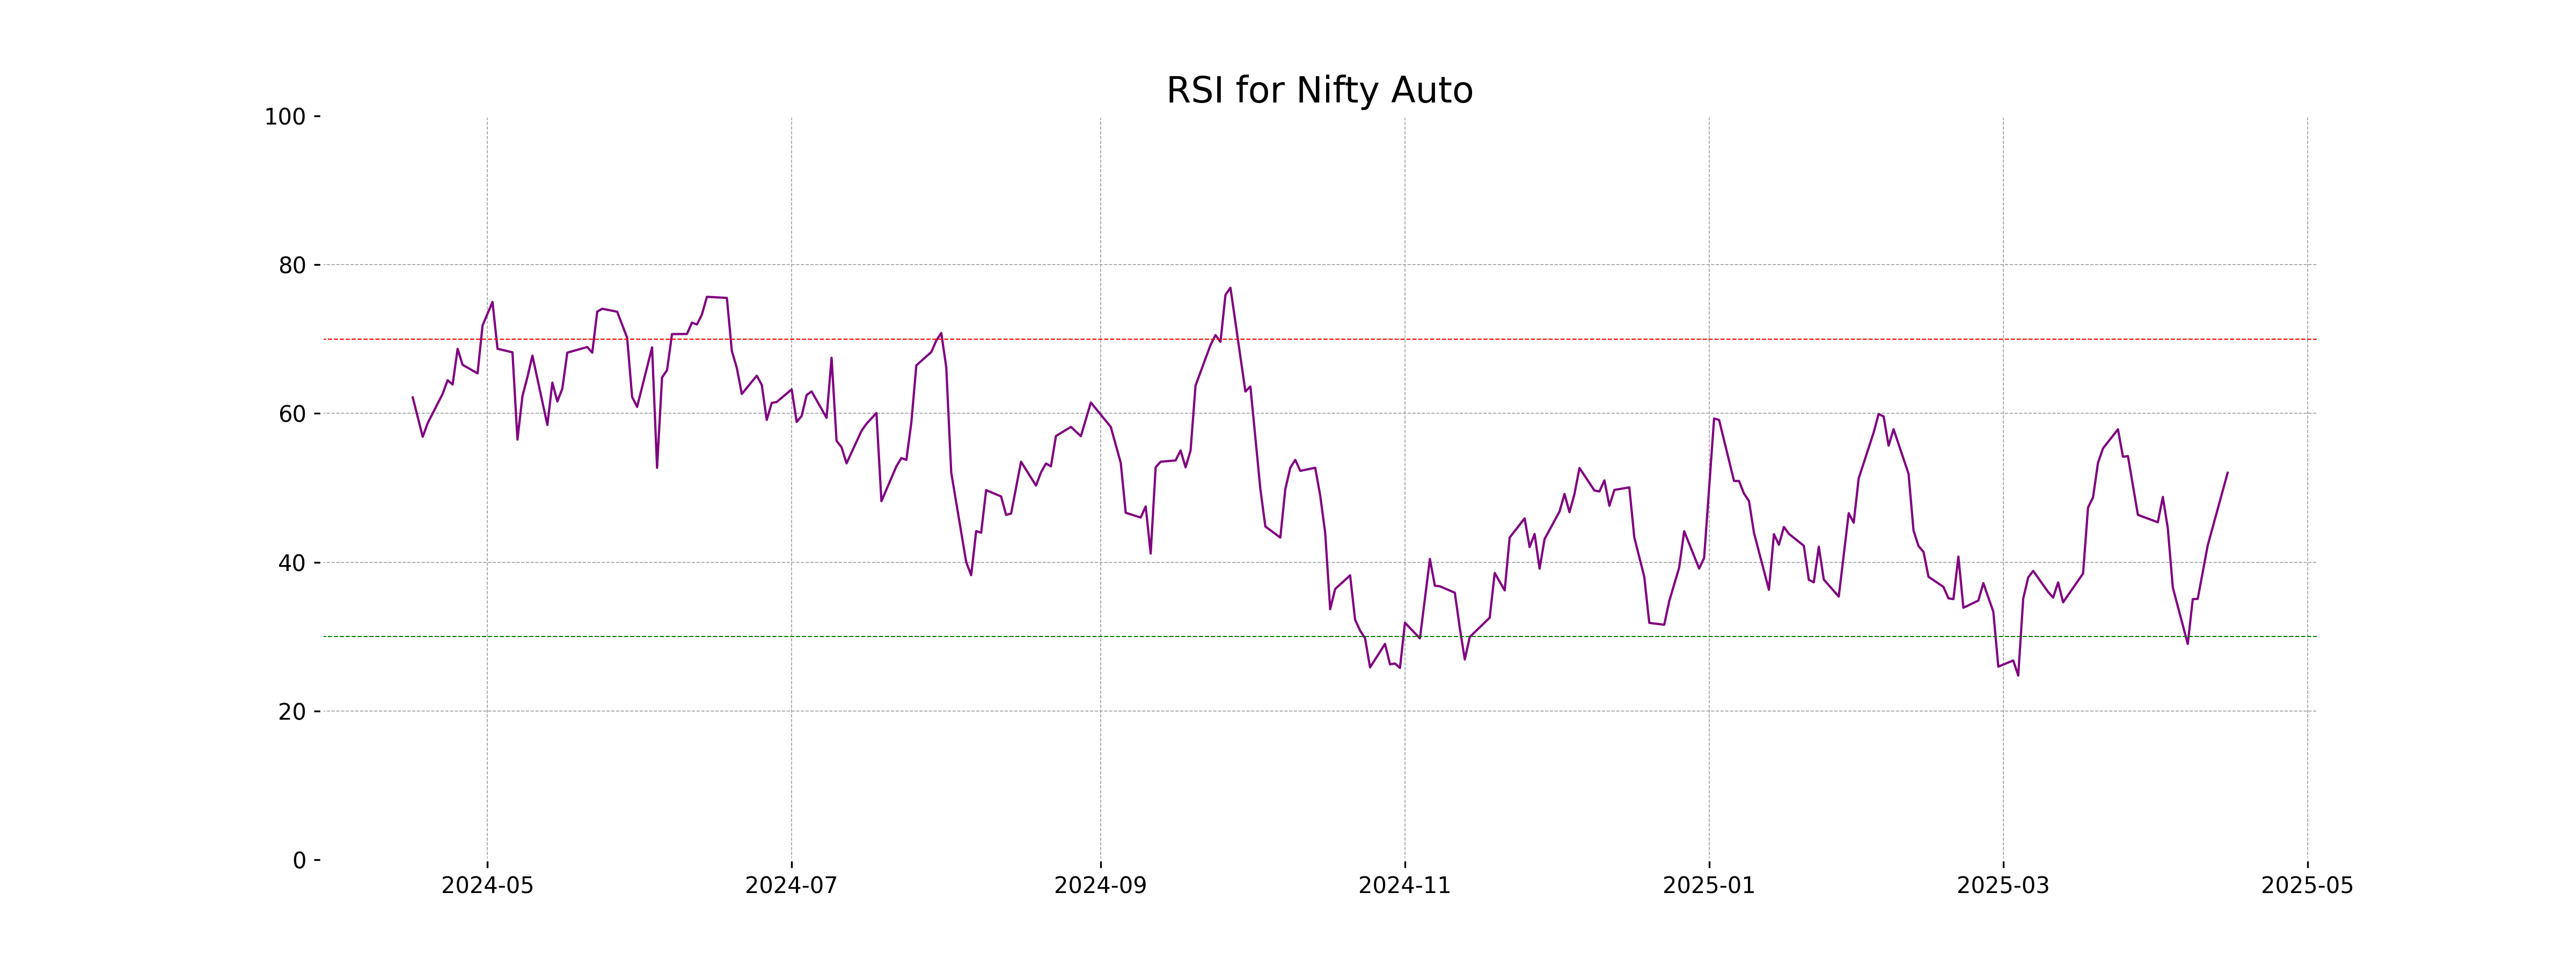
RSI Analysis
The RSI (Relative Strength Index) for Nifty Auto is currently 52.03, indicating a neutral market position. This suggests that the index is neither overbought nor oversold, implying a balanced momentum at this time.
Analysis for Nifty Energy - April 15, 2025
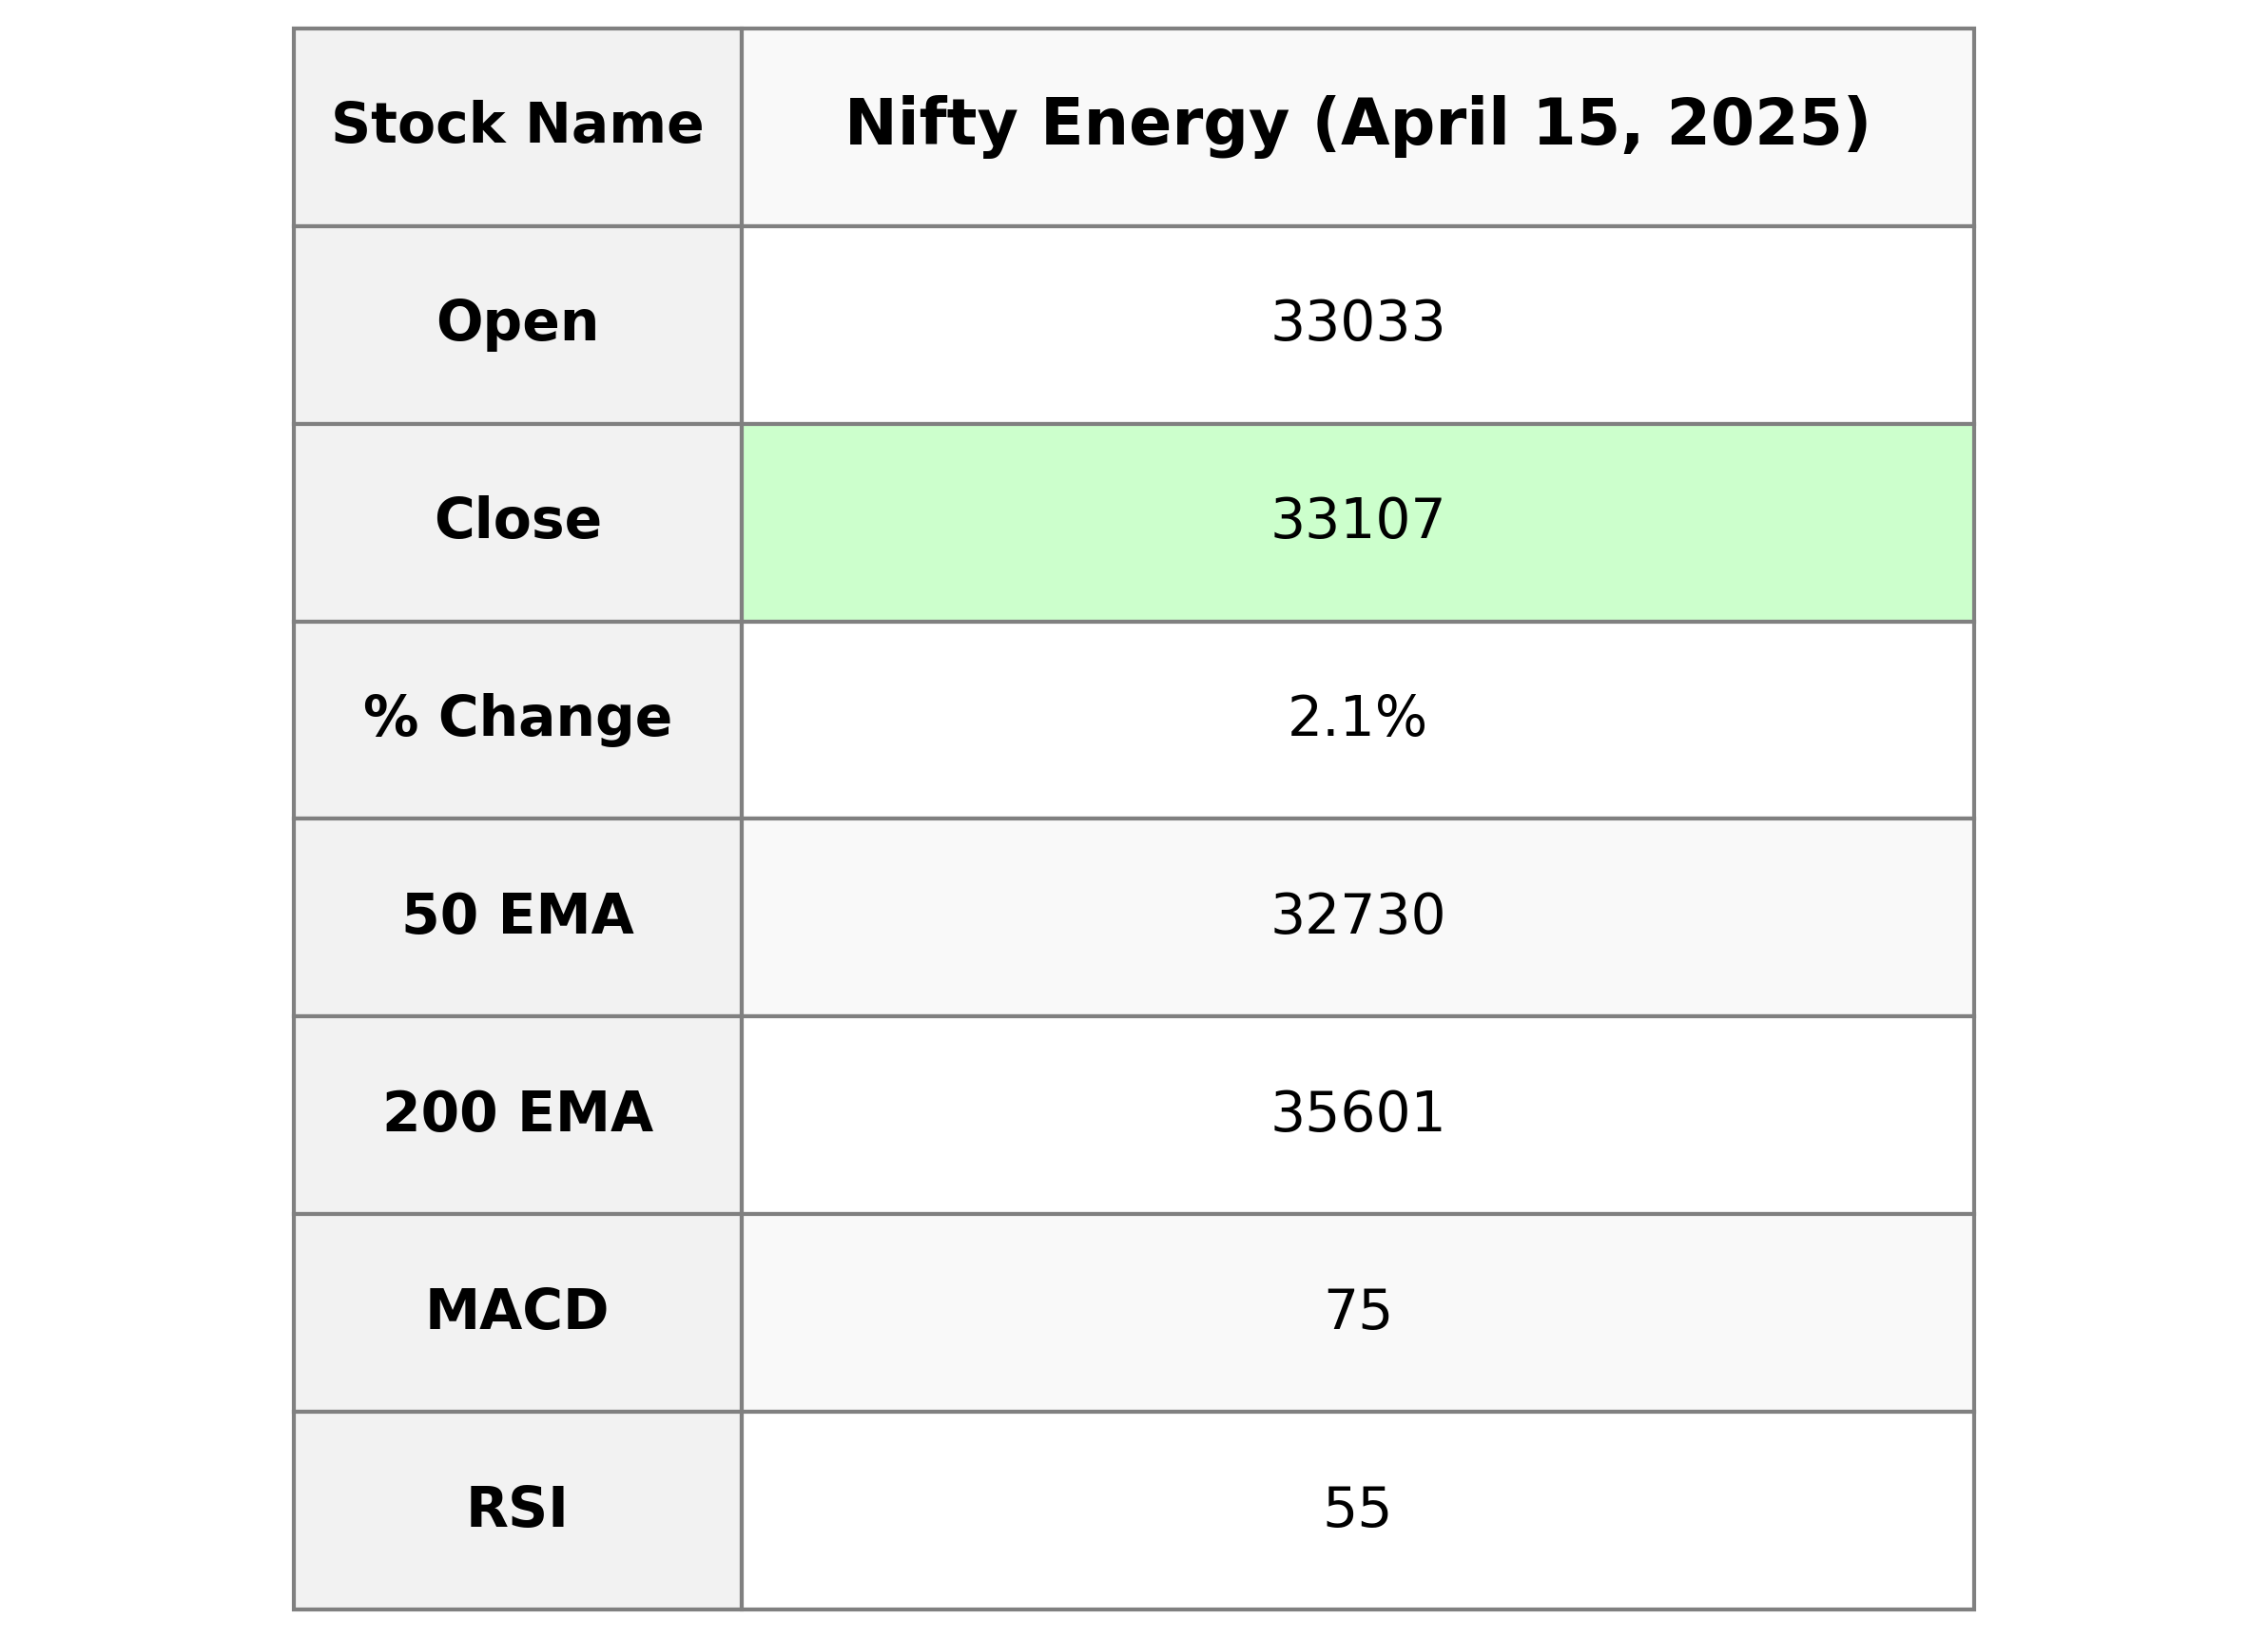
The Nifty Energy index showed a positive performance with a closing value of 33,106.55, marking a 2.15% increase from the previous close. The index opened at 33,033.25, reached a high of 33,182.40, and faced a low of 32,811.40. The RSI is at 55.13, indicating moderate strength, while the MACD is below its signal line, suggesting potential caution.
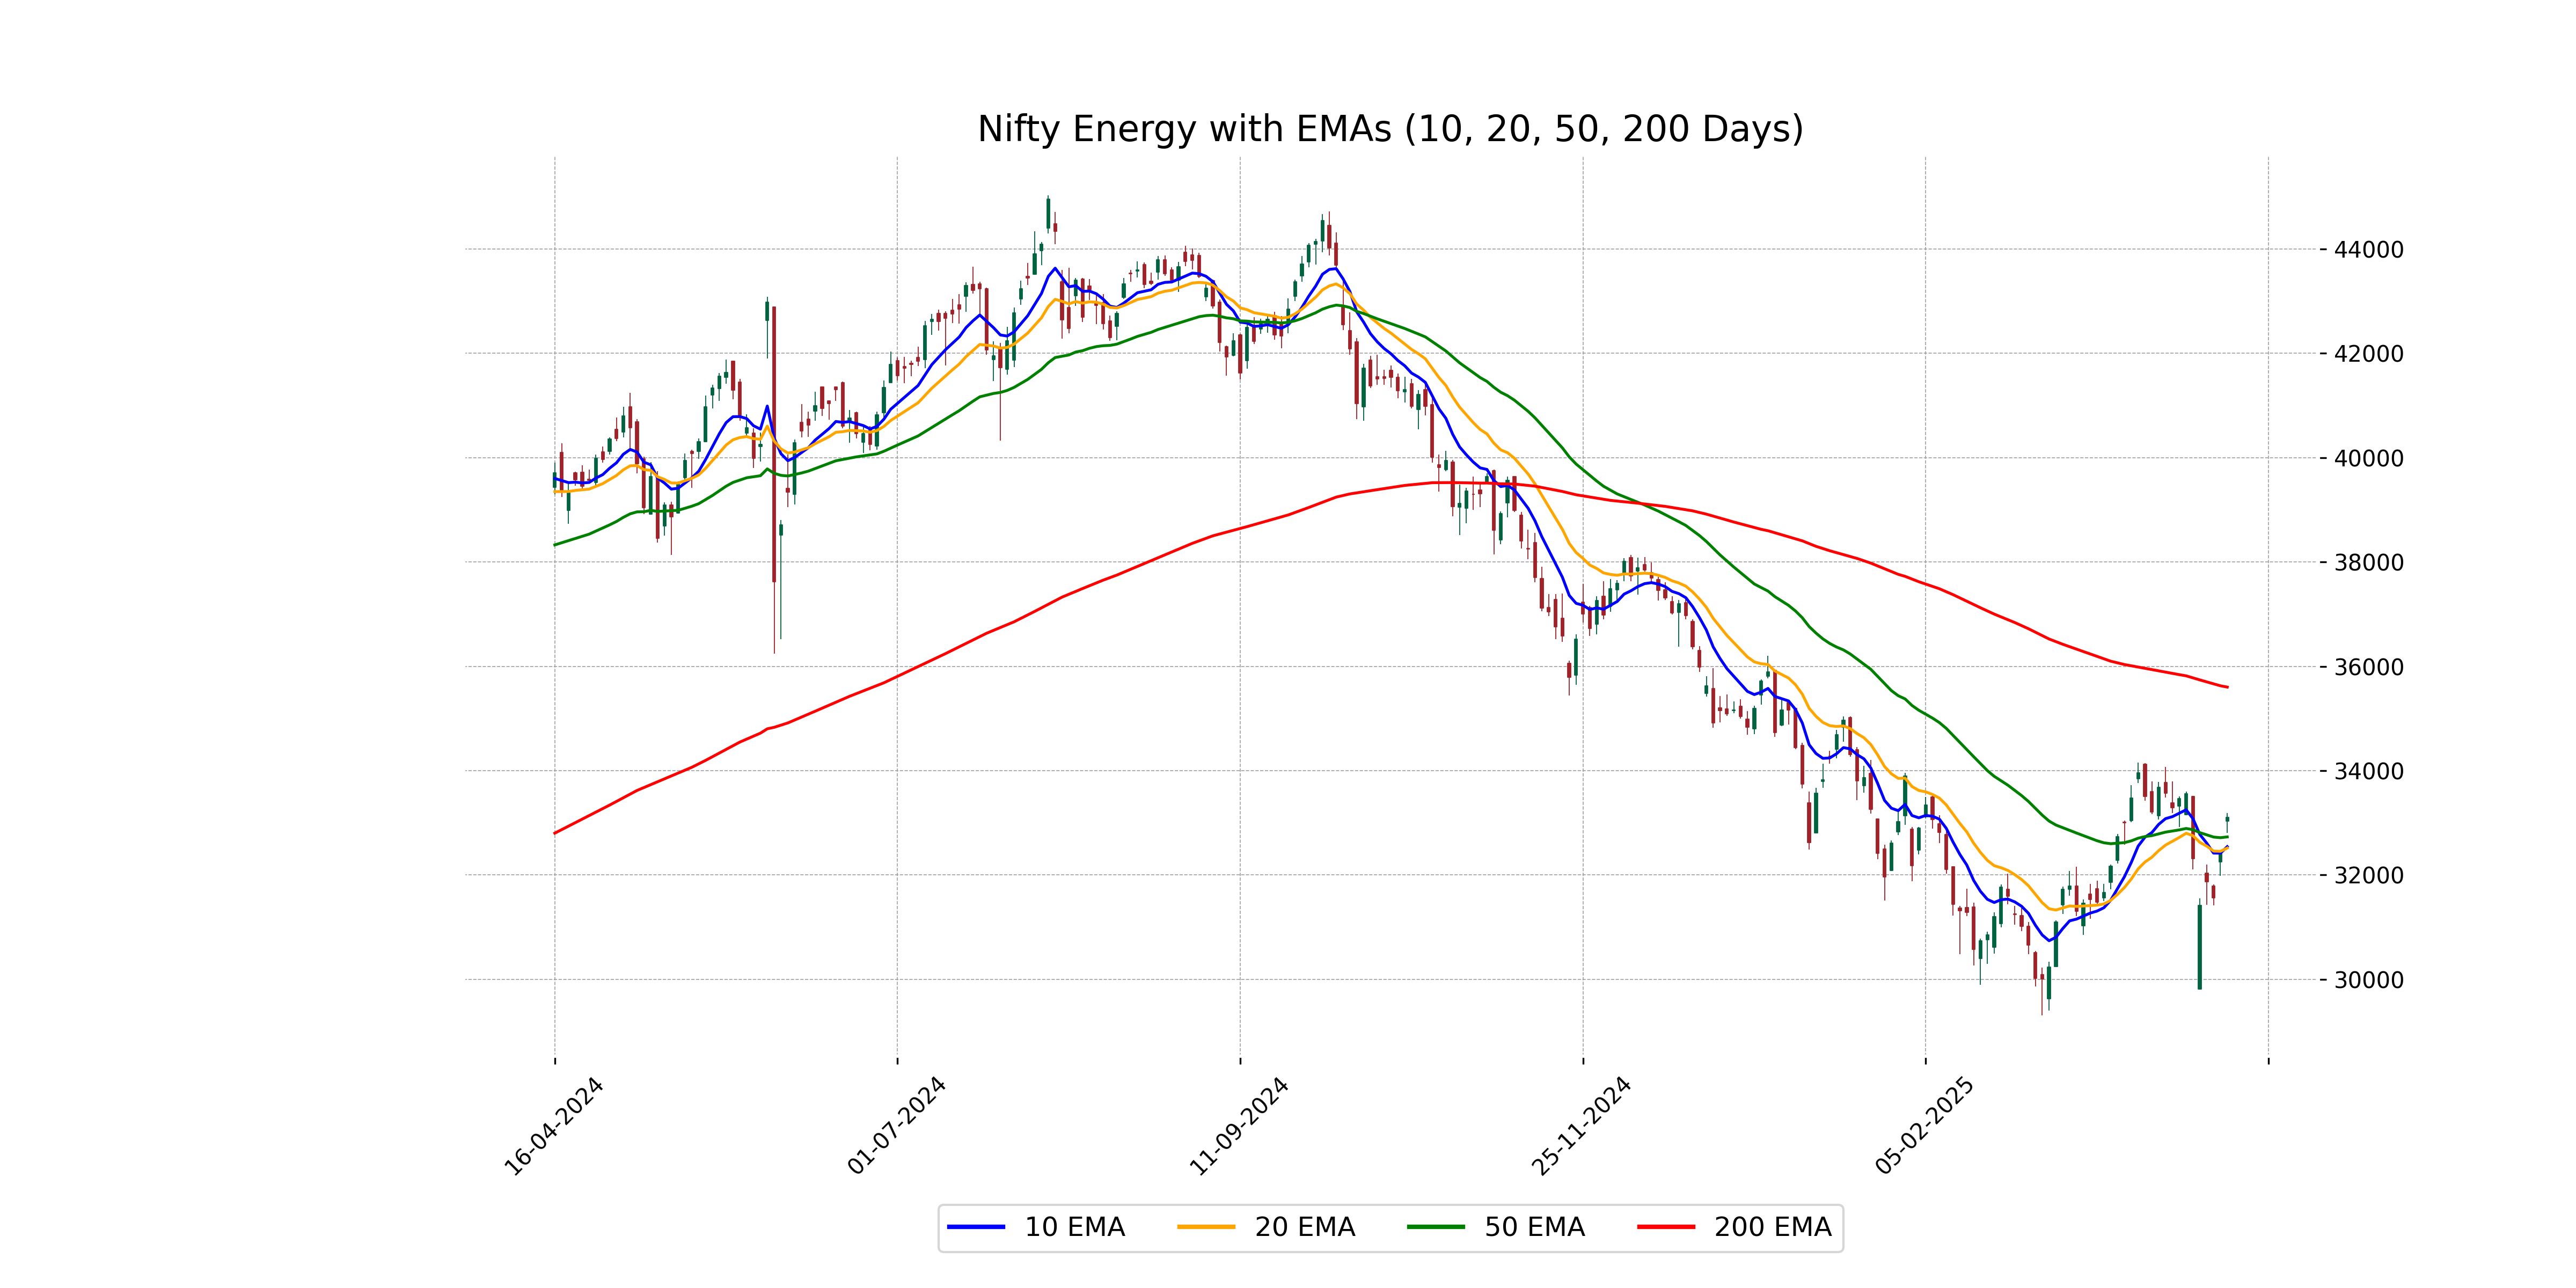
Relationship with Key Moving Averages
The Nifty Energy index closed at 33106.55, above both its 10 EMA (32543.26) and 20 EMA (32516.16), indicating a recent upward momentum. However, it remains below the 50 EMA (32730.05), signaling a potential resistance level. The index is also well below the 200 EMA (35601.29), suggesting a longer-term bearish trend may still be intact.
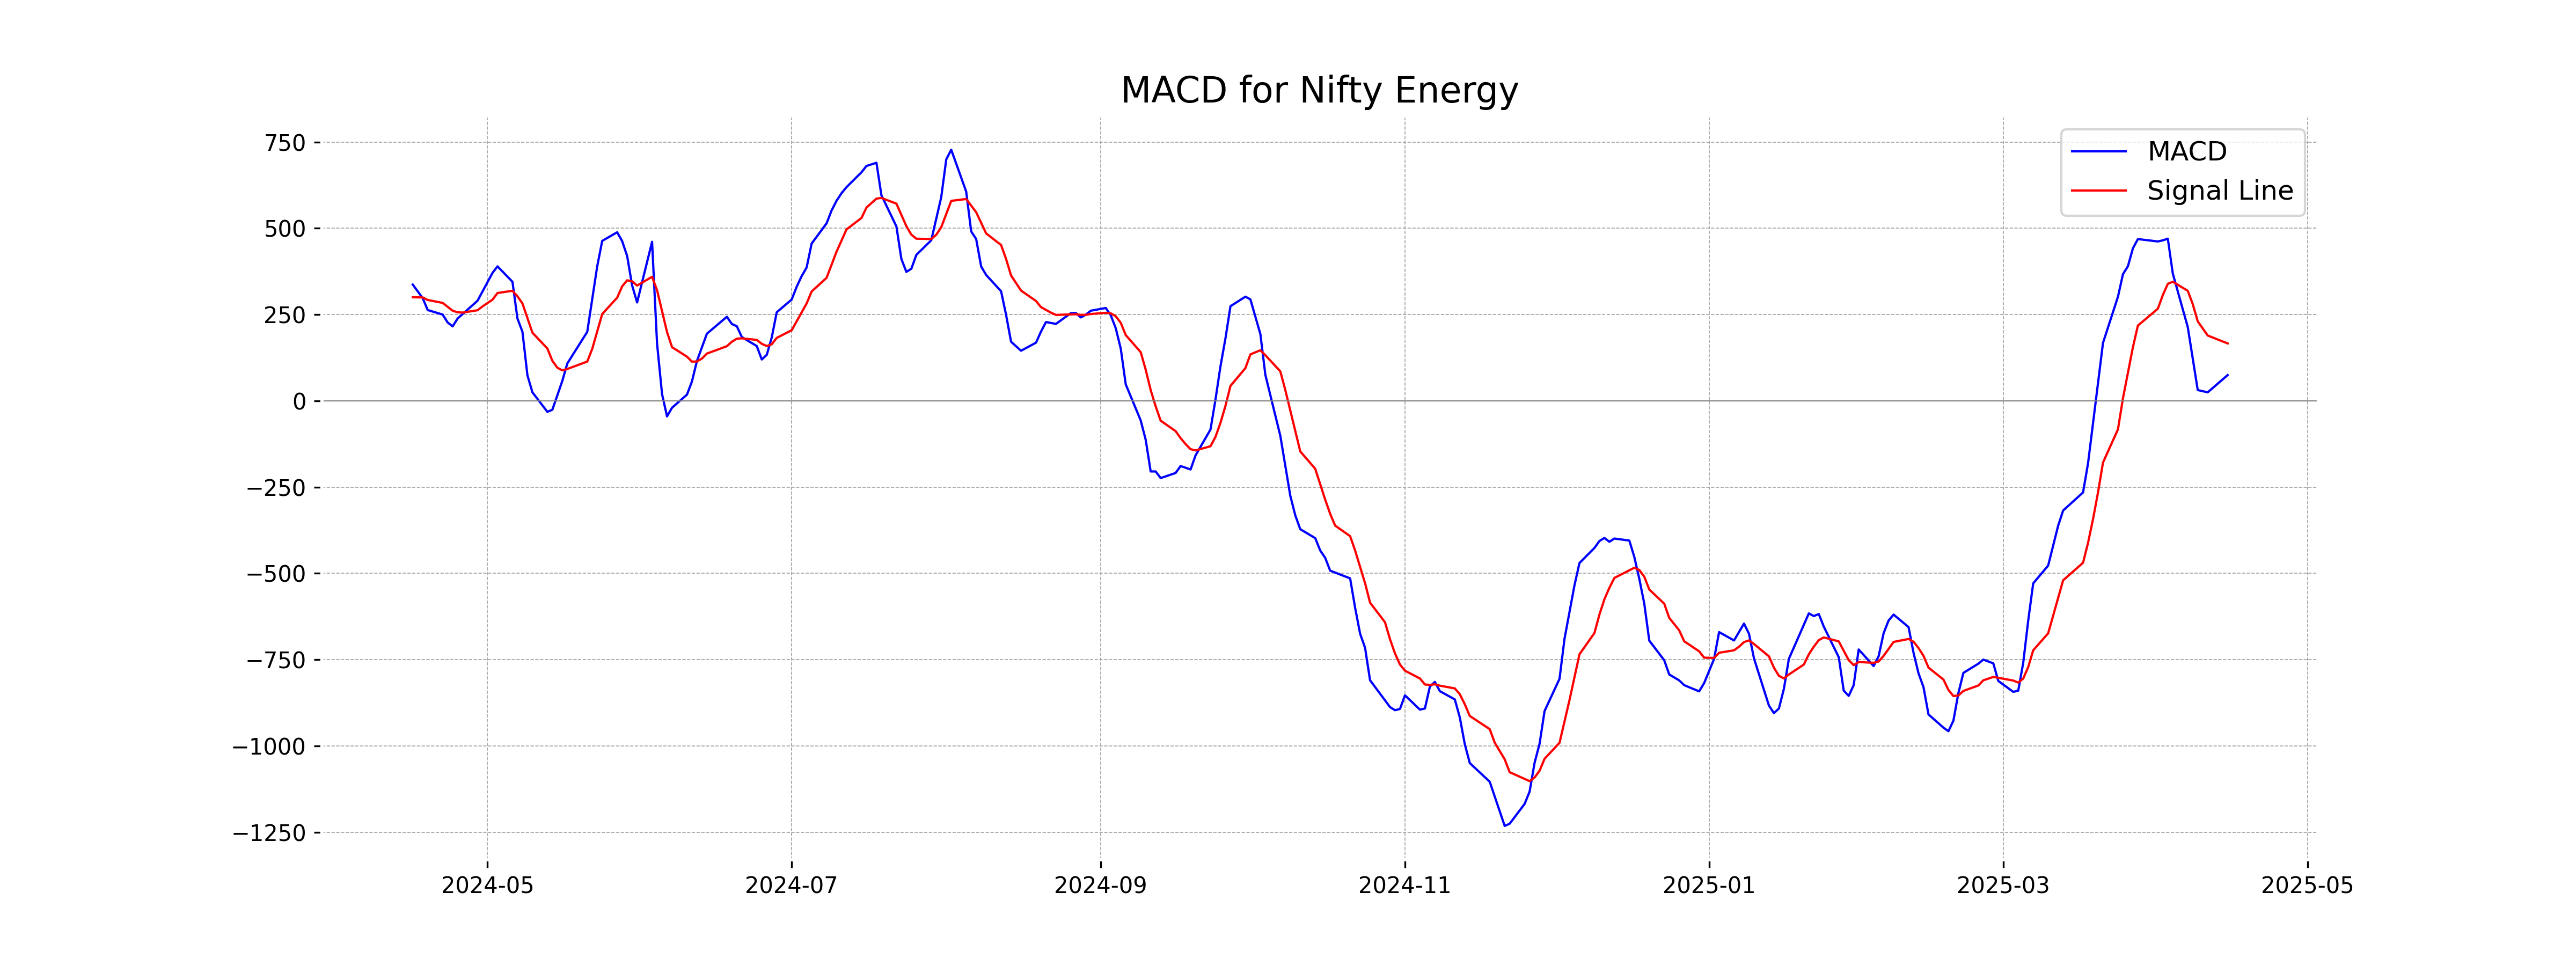
Moving Averages Trend (MACD)
MACD Analysis for Nifty Energy: The MACD value of 74.69, which is below the MACD Signal value of 166.38, suggests a bearish momentum in the short term. While the RSI is relatively neutral at 55.13, the weak MACD line indicates that the current upward trend may be losing strength.
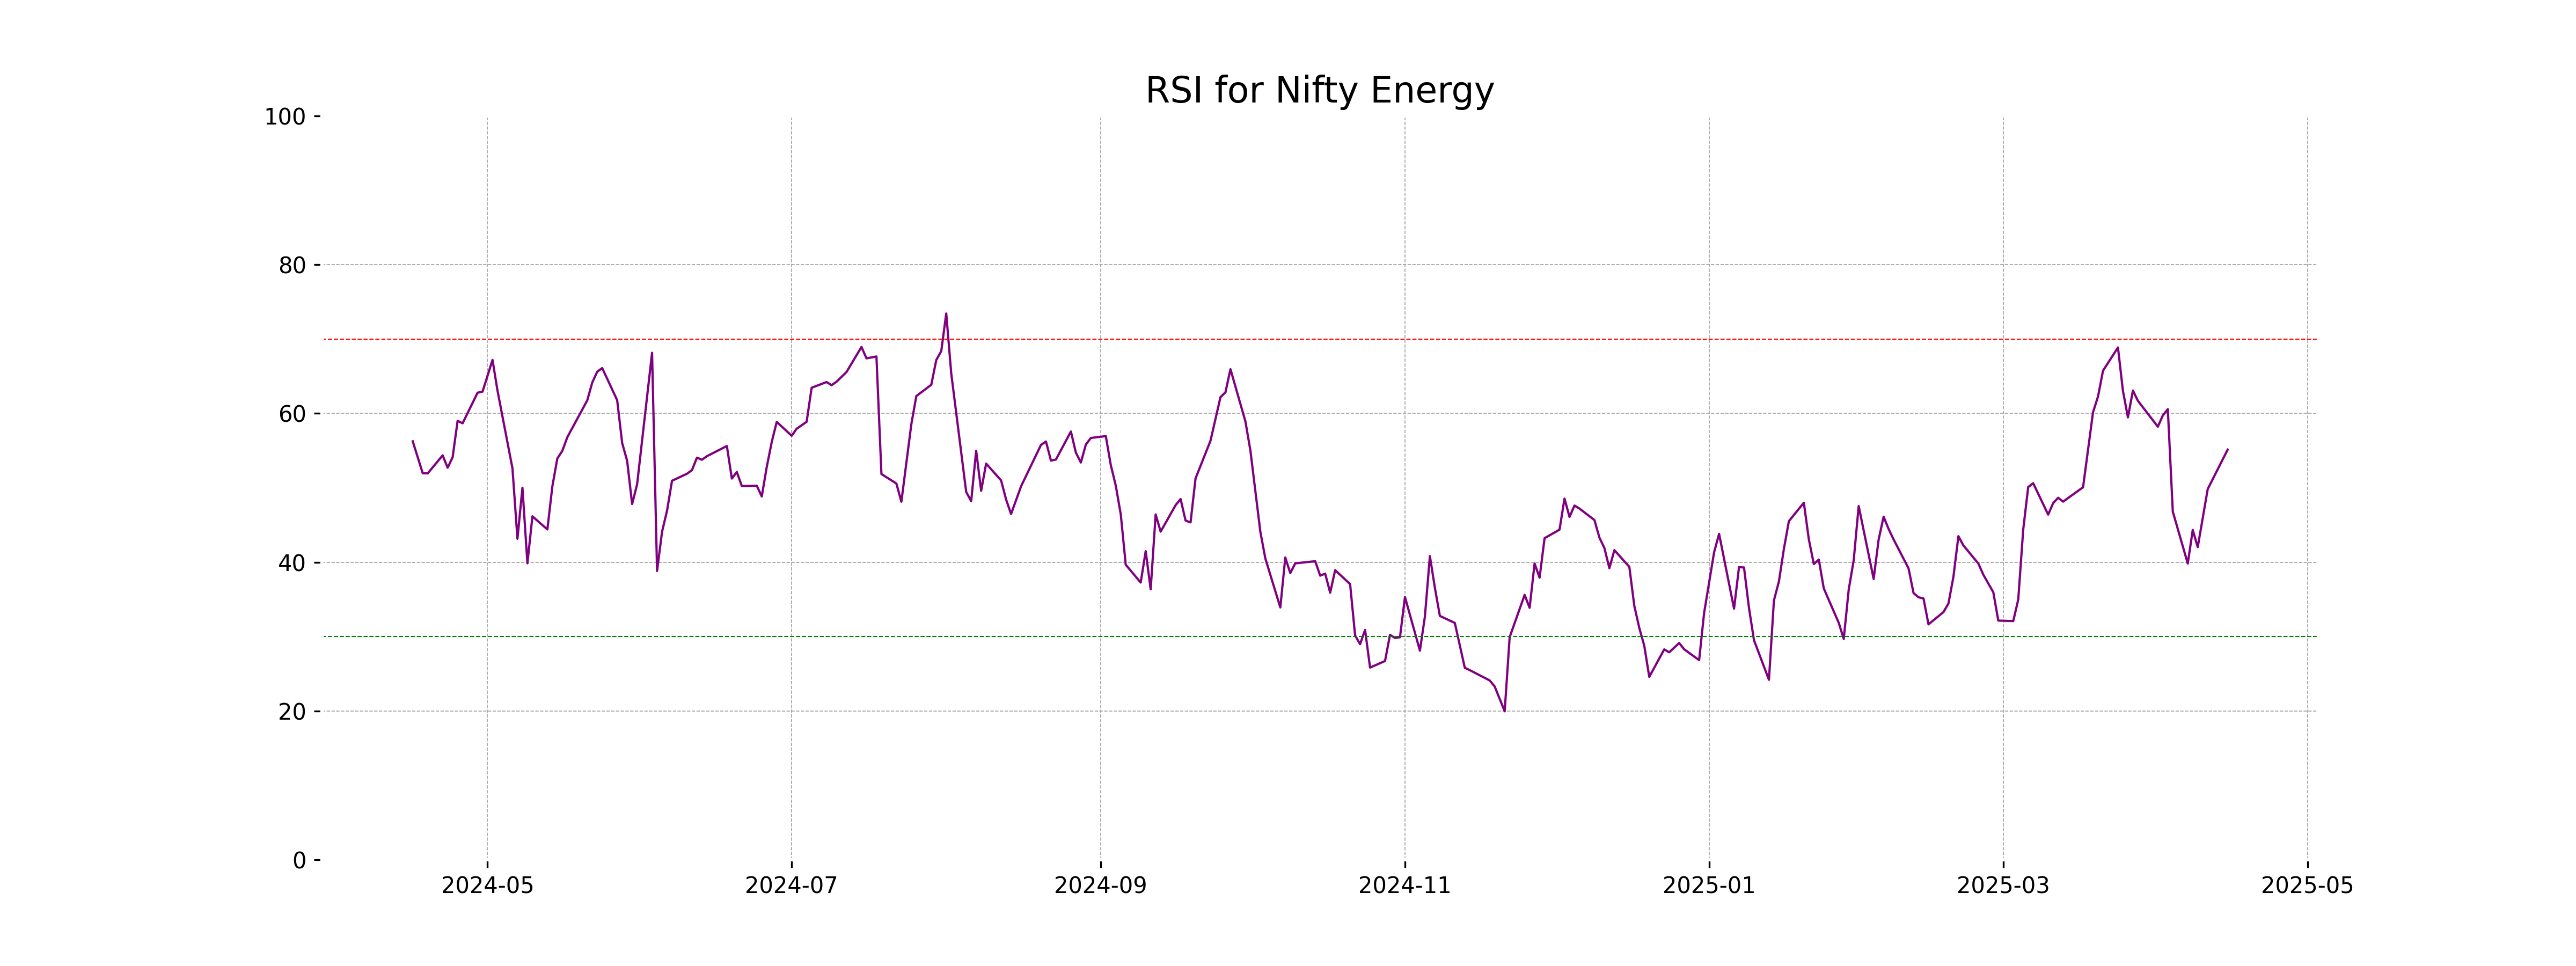
RSI Analysis
The Relative Strength Index (RSI) for Nifty Energy is at 55.13, which indicates a neutral position. An RSI between 30 and 70 typically suggests that the stock is neither overbought nor oversold, suggesting a balanced momentum in the market.
Analysis for Nifty FMCG - April 15, 2025
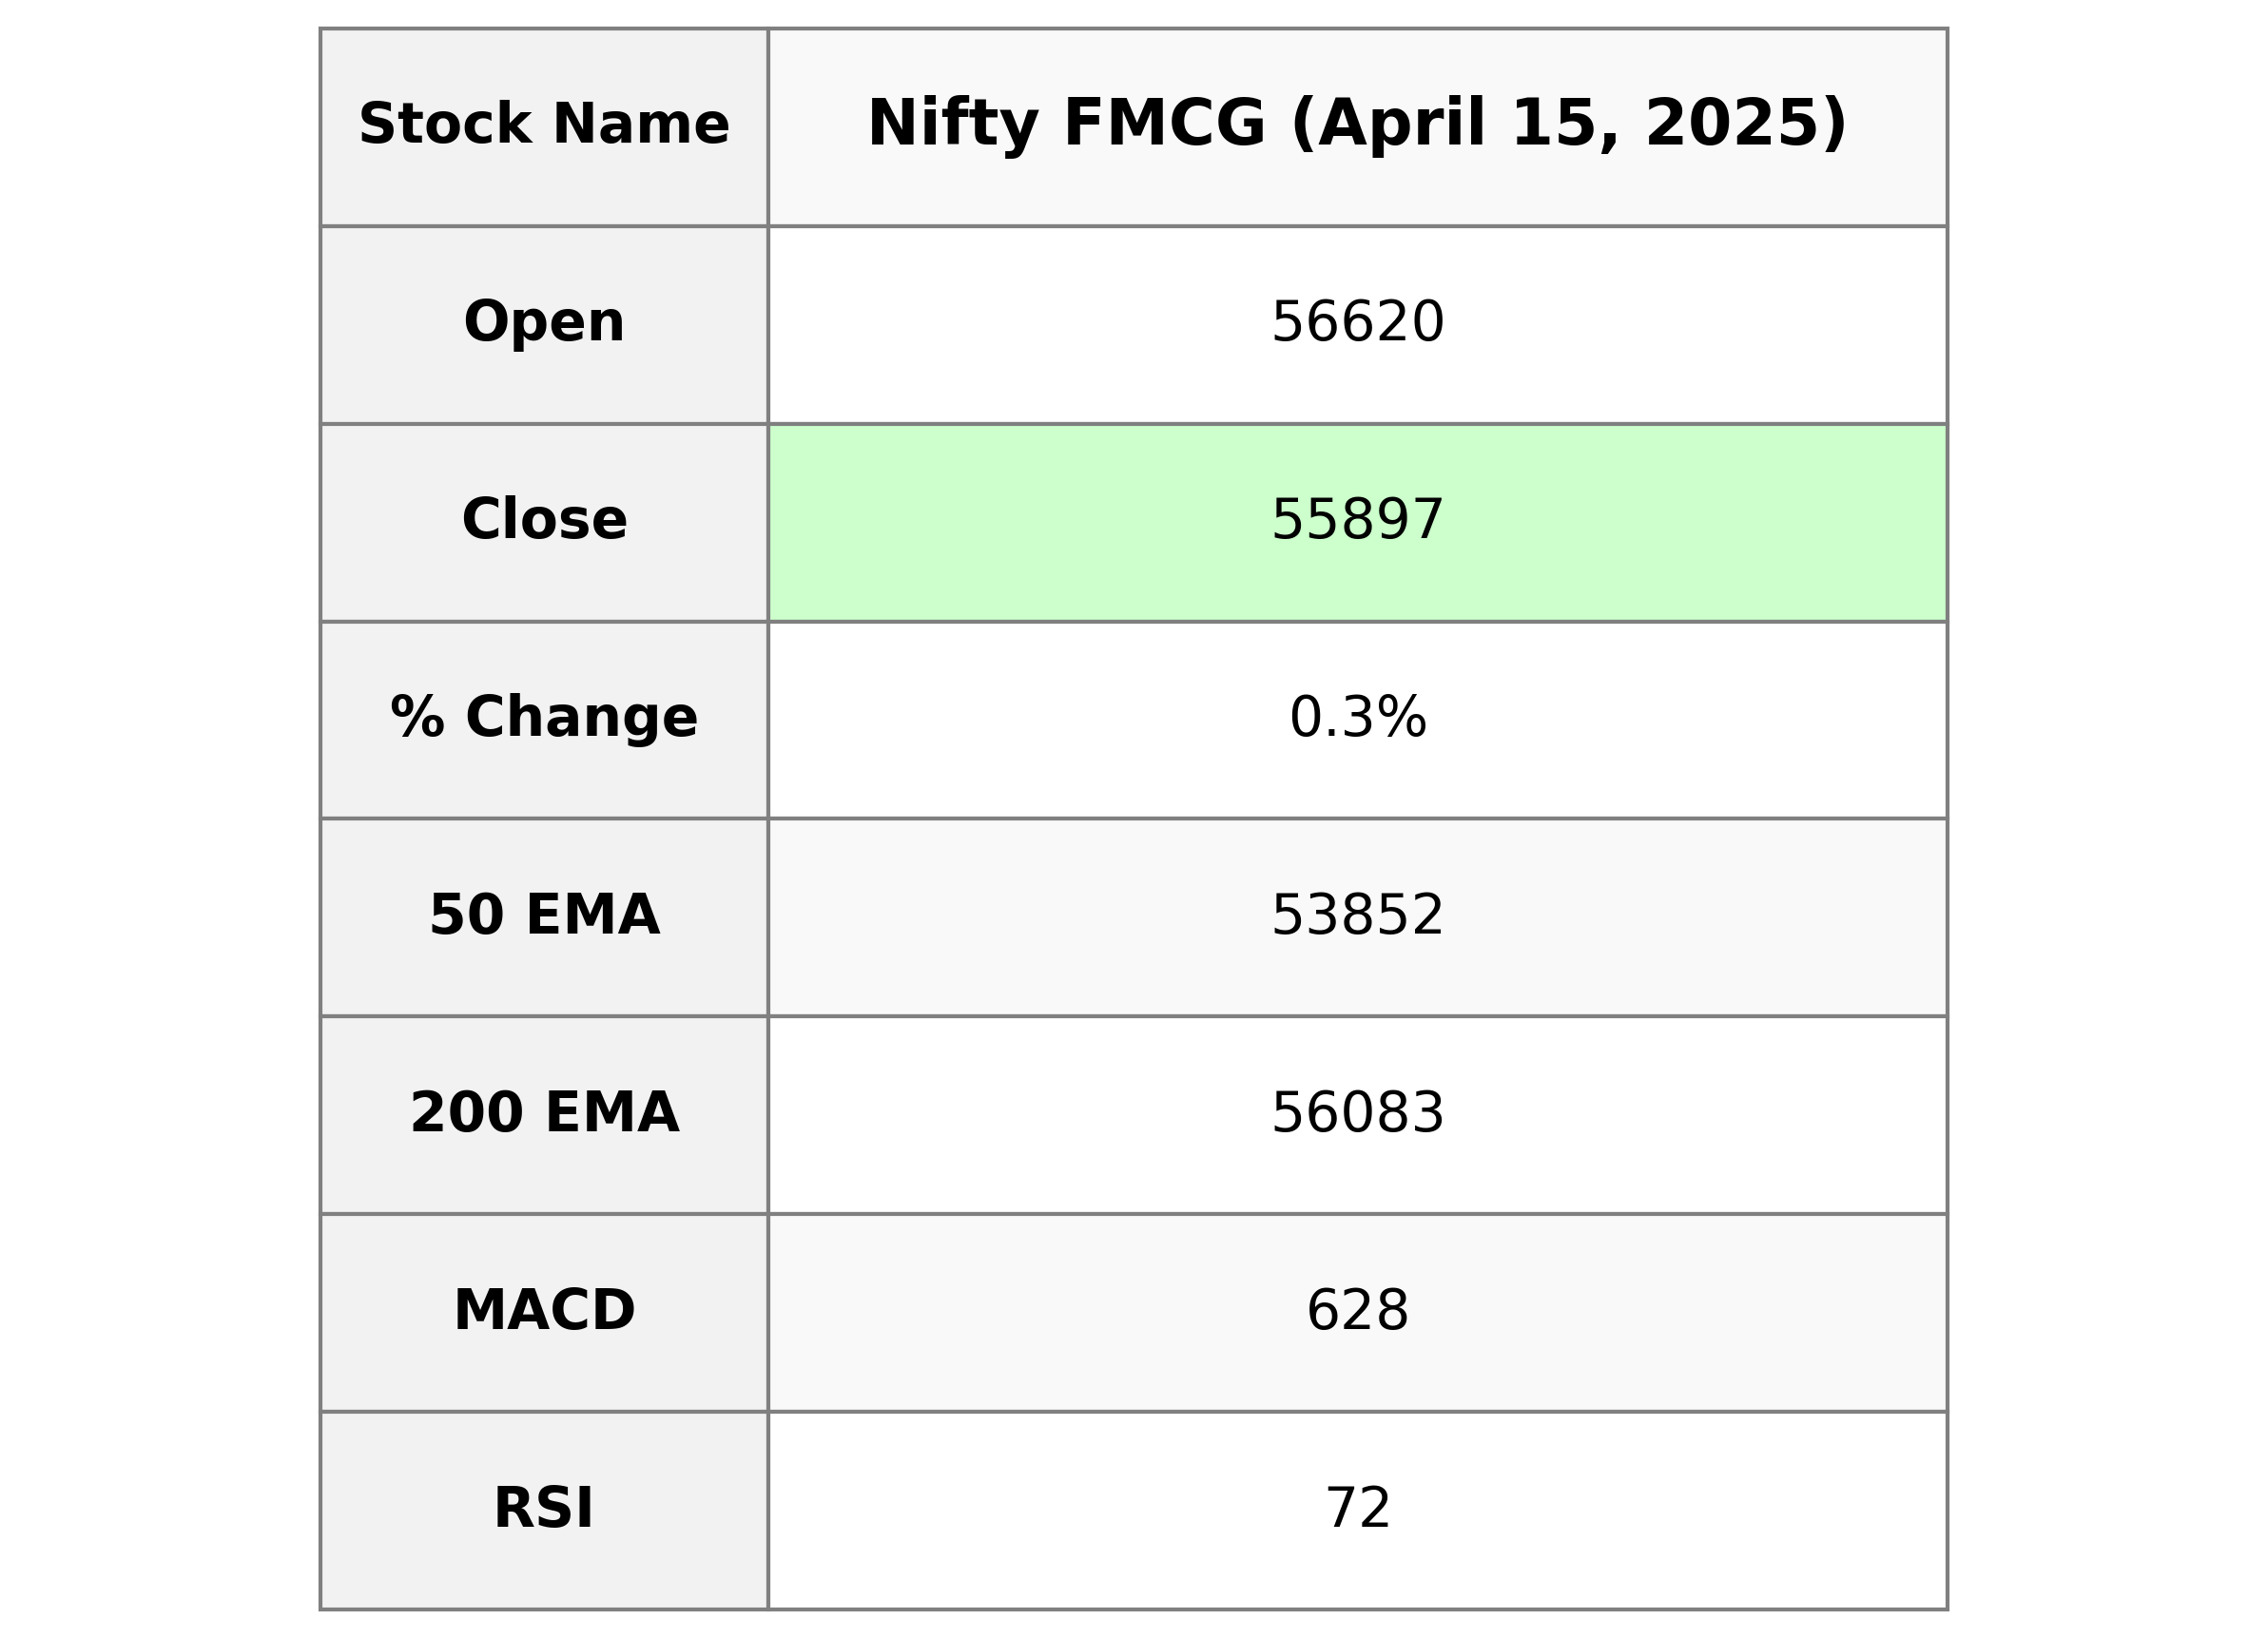
The Nifty FMCG index opened at 56,620.05 and closed slightly higher at 55,896.95, marking a positive change of 0.28% or 155.85 points from the previous close of 55,741.10. With an RSI of 71.70, it is in the overbought territory, indicating strong buying momentum. The MACD value of 627.65, well above its signal line of 283.57, suggests a bullish trend.
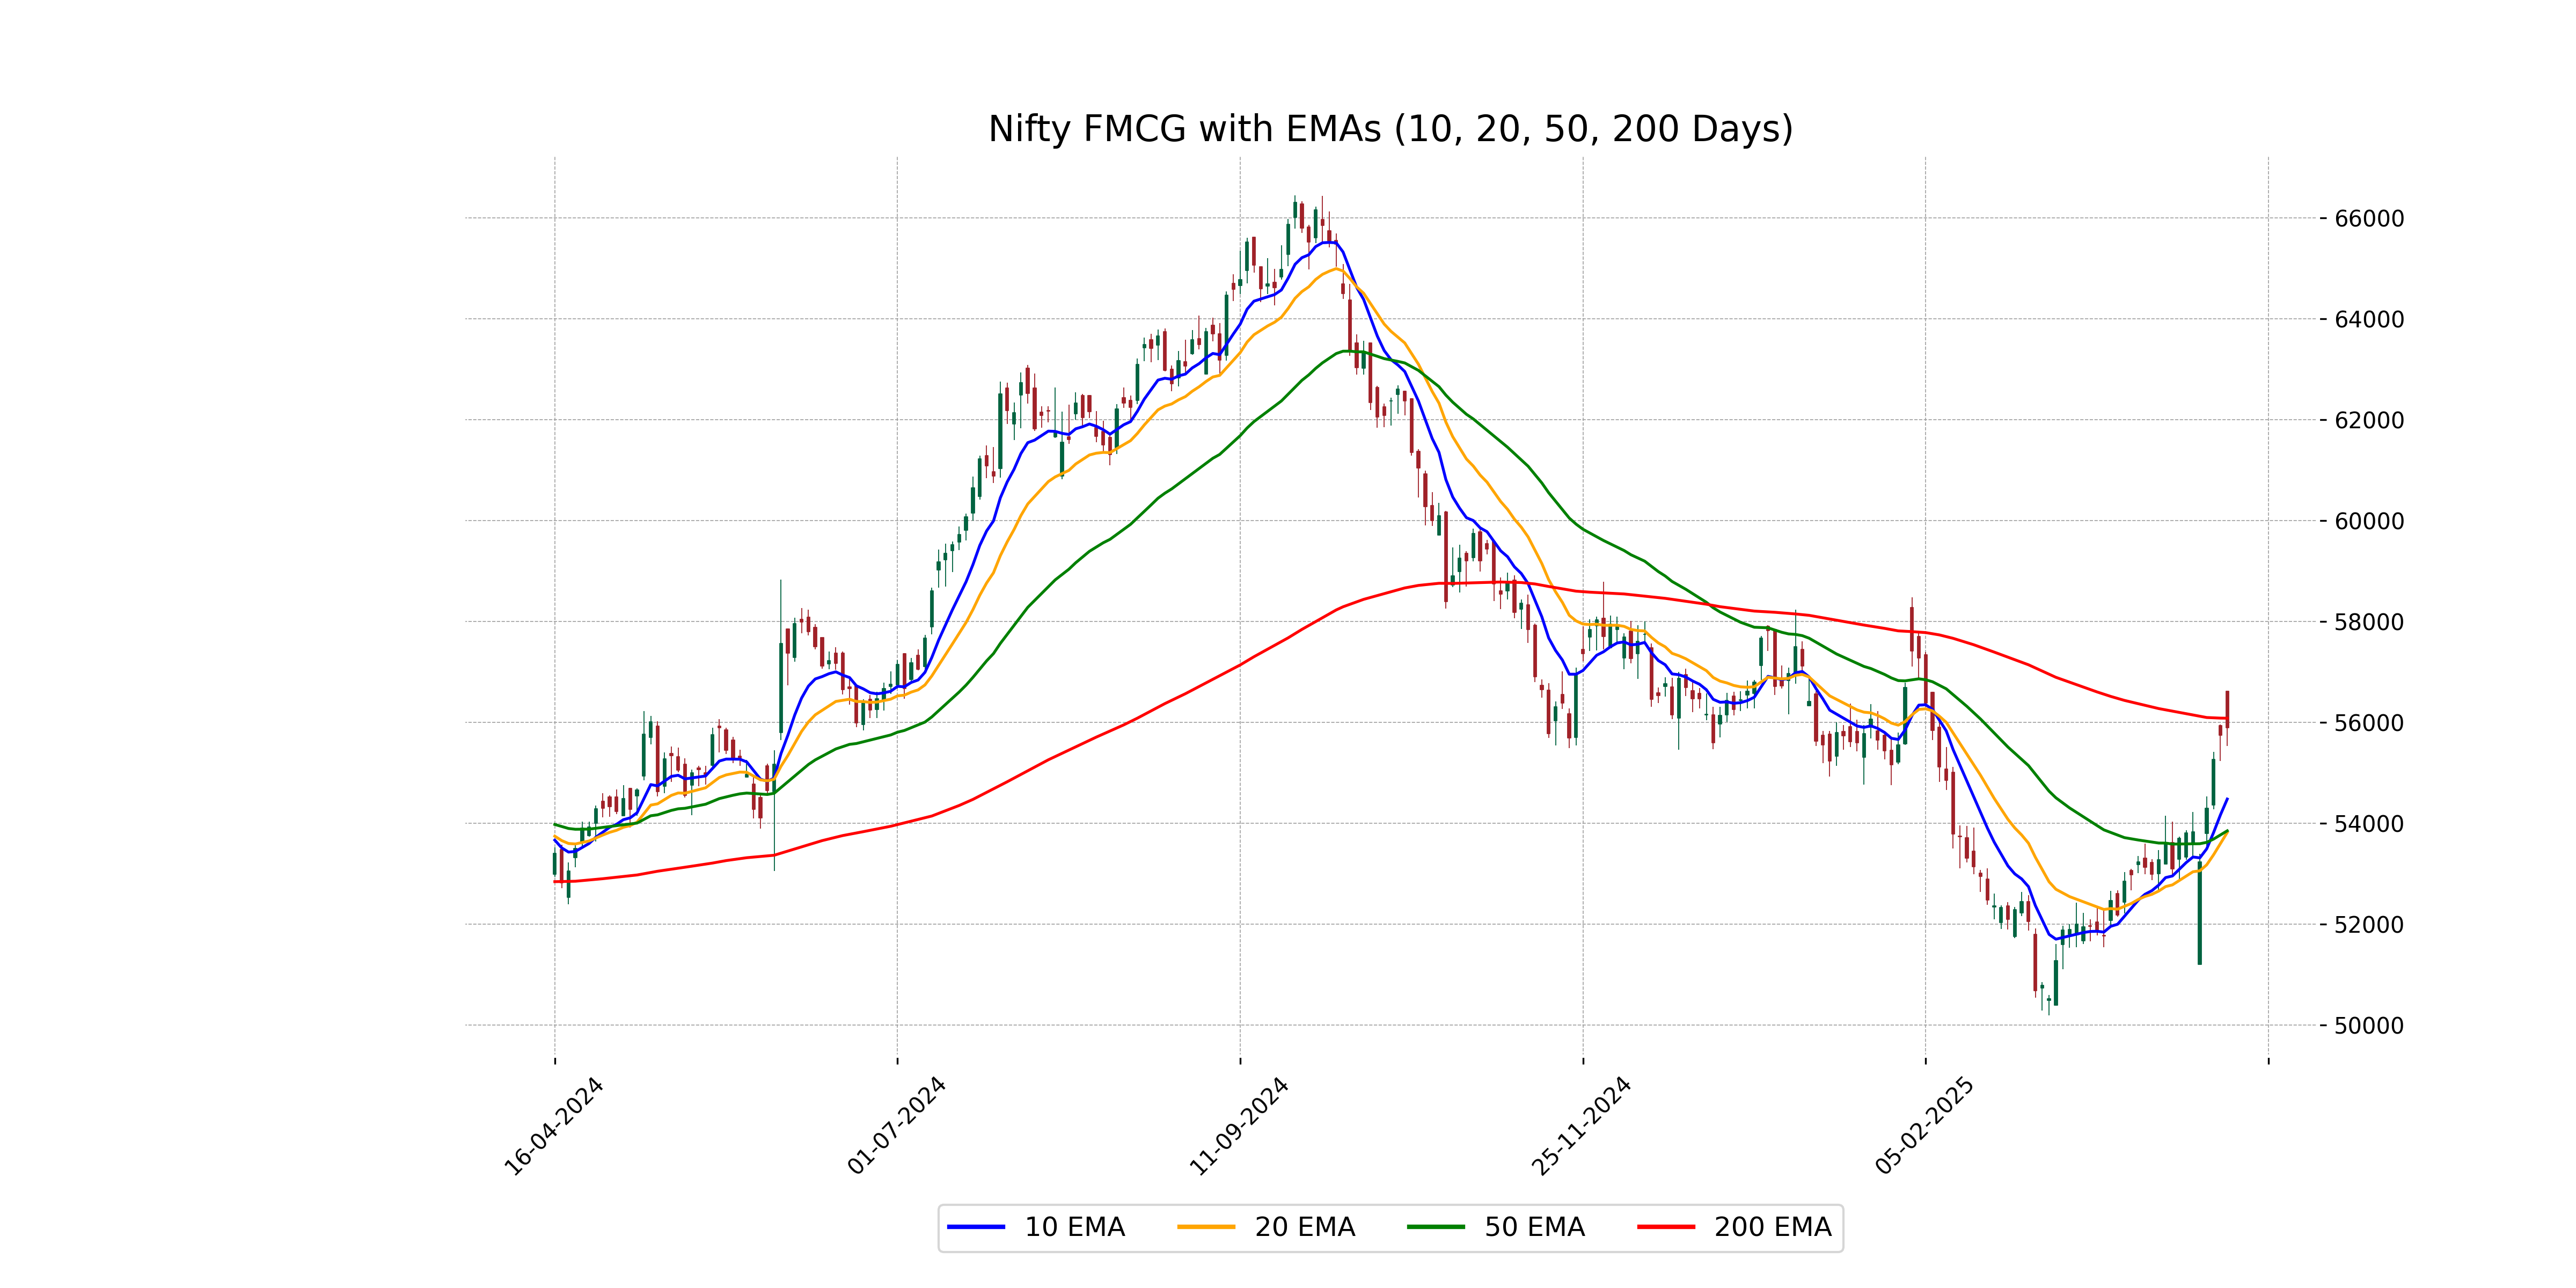
Relationship with Key Moving Averages
Nifty FMCG is currently trading above its 50 EMA and 20 EMA, indicating a potential short-term bullish trend. However, it's trading slightly below the 200 EMA, which may suggest a need for caution in longer-term perspectives. The RSI value indicates overbought conditions, suggesting potential caution for new long positions.
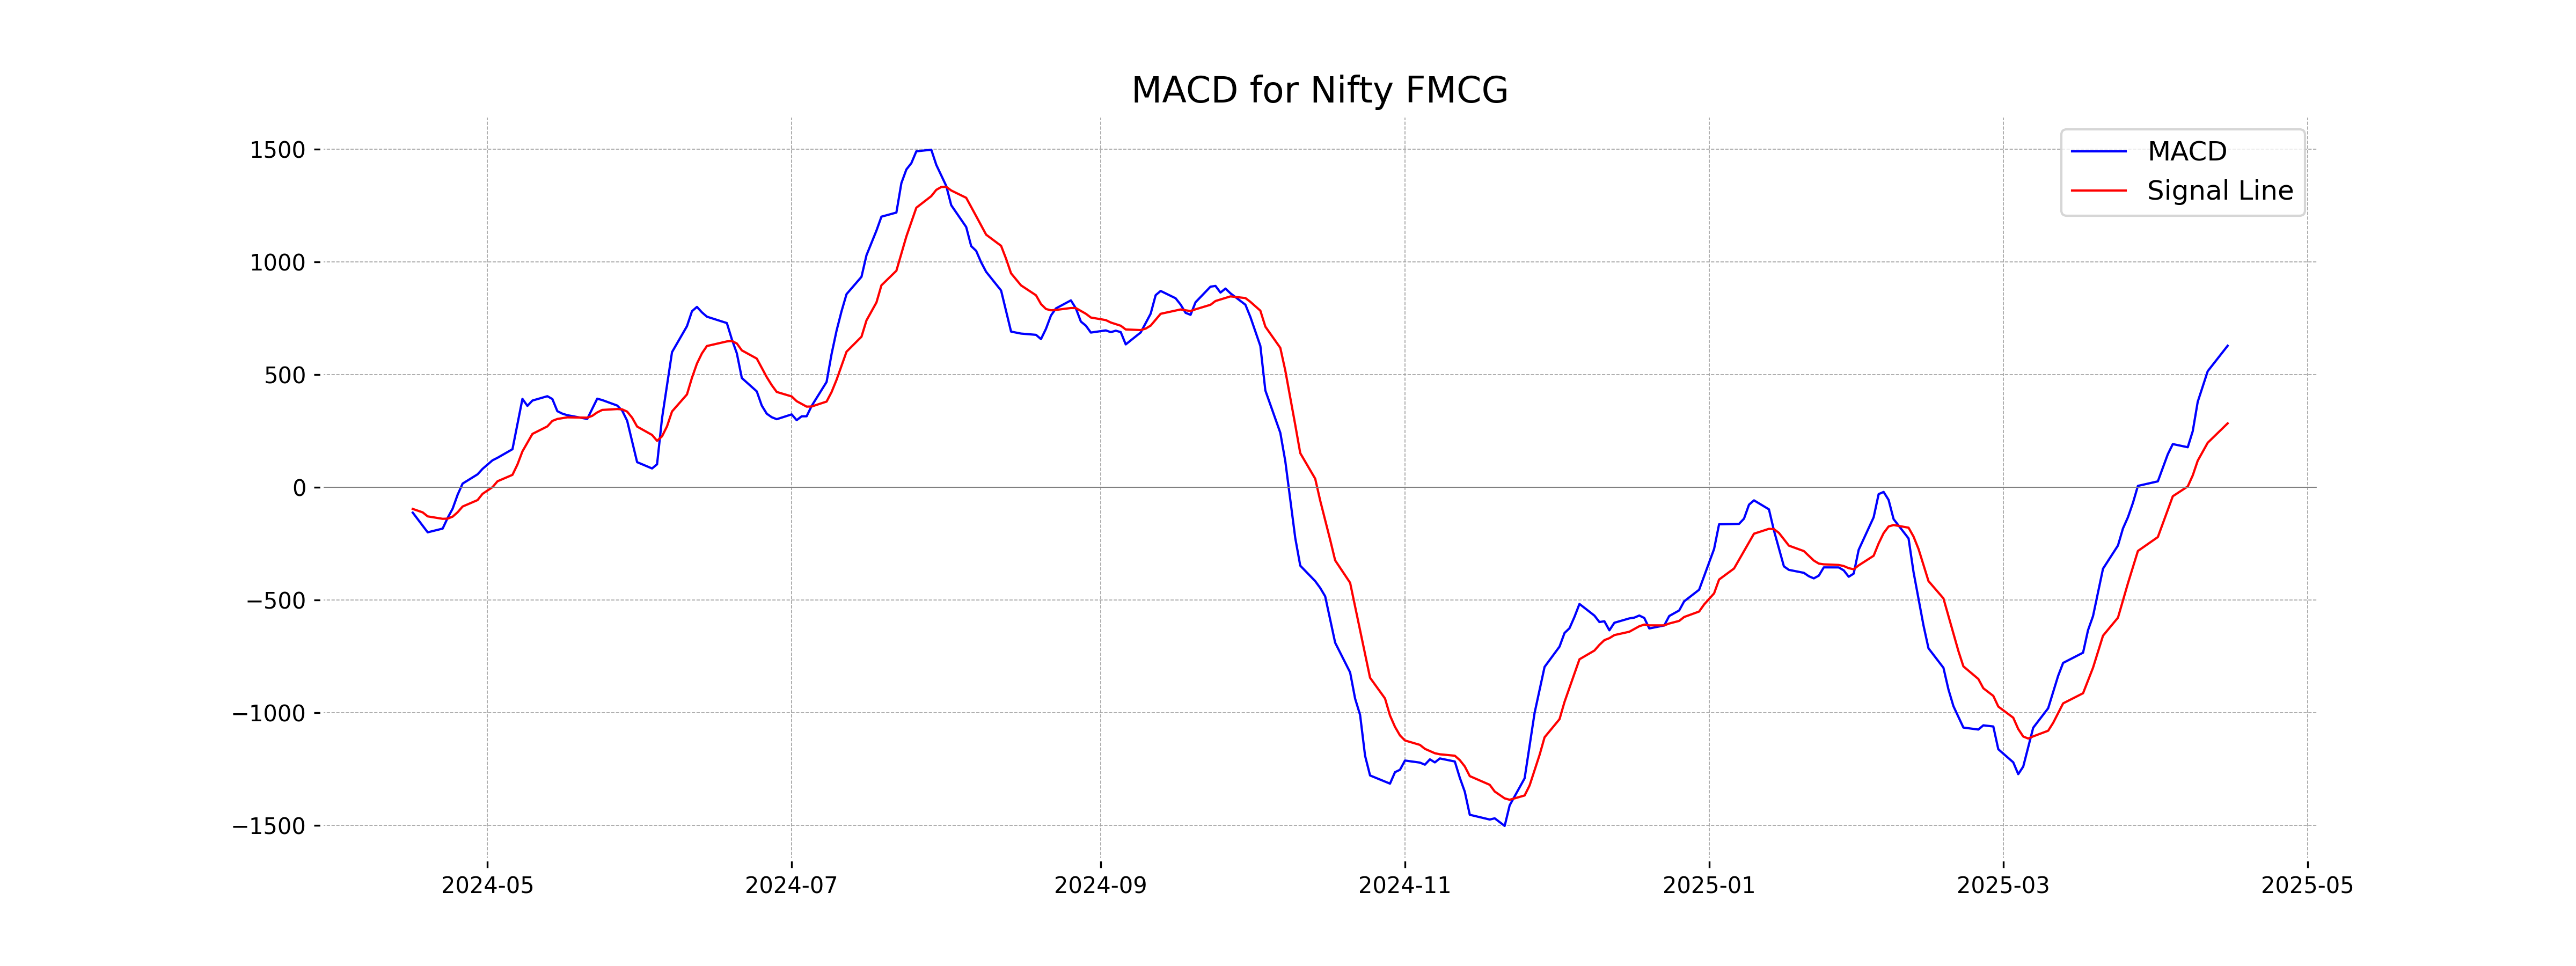
Moving Averages Trend (MACD)
Nifty FMCG's MACD value of 627.65 is above its MACD Signal value of 283.57, indicating a bullish momentum. This suggests that the stock trend might continue its upward movement. However, monitoring for any changes in trend indicators is advisable.
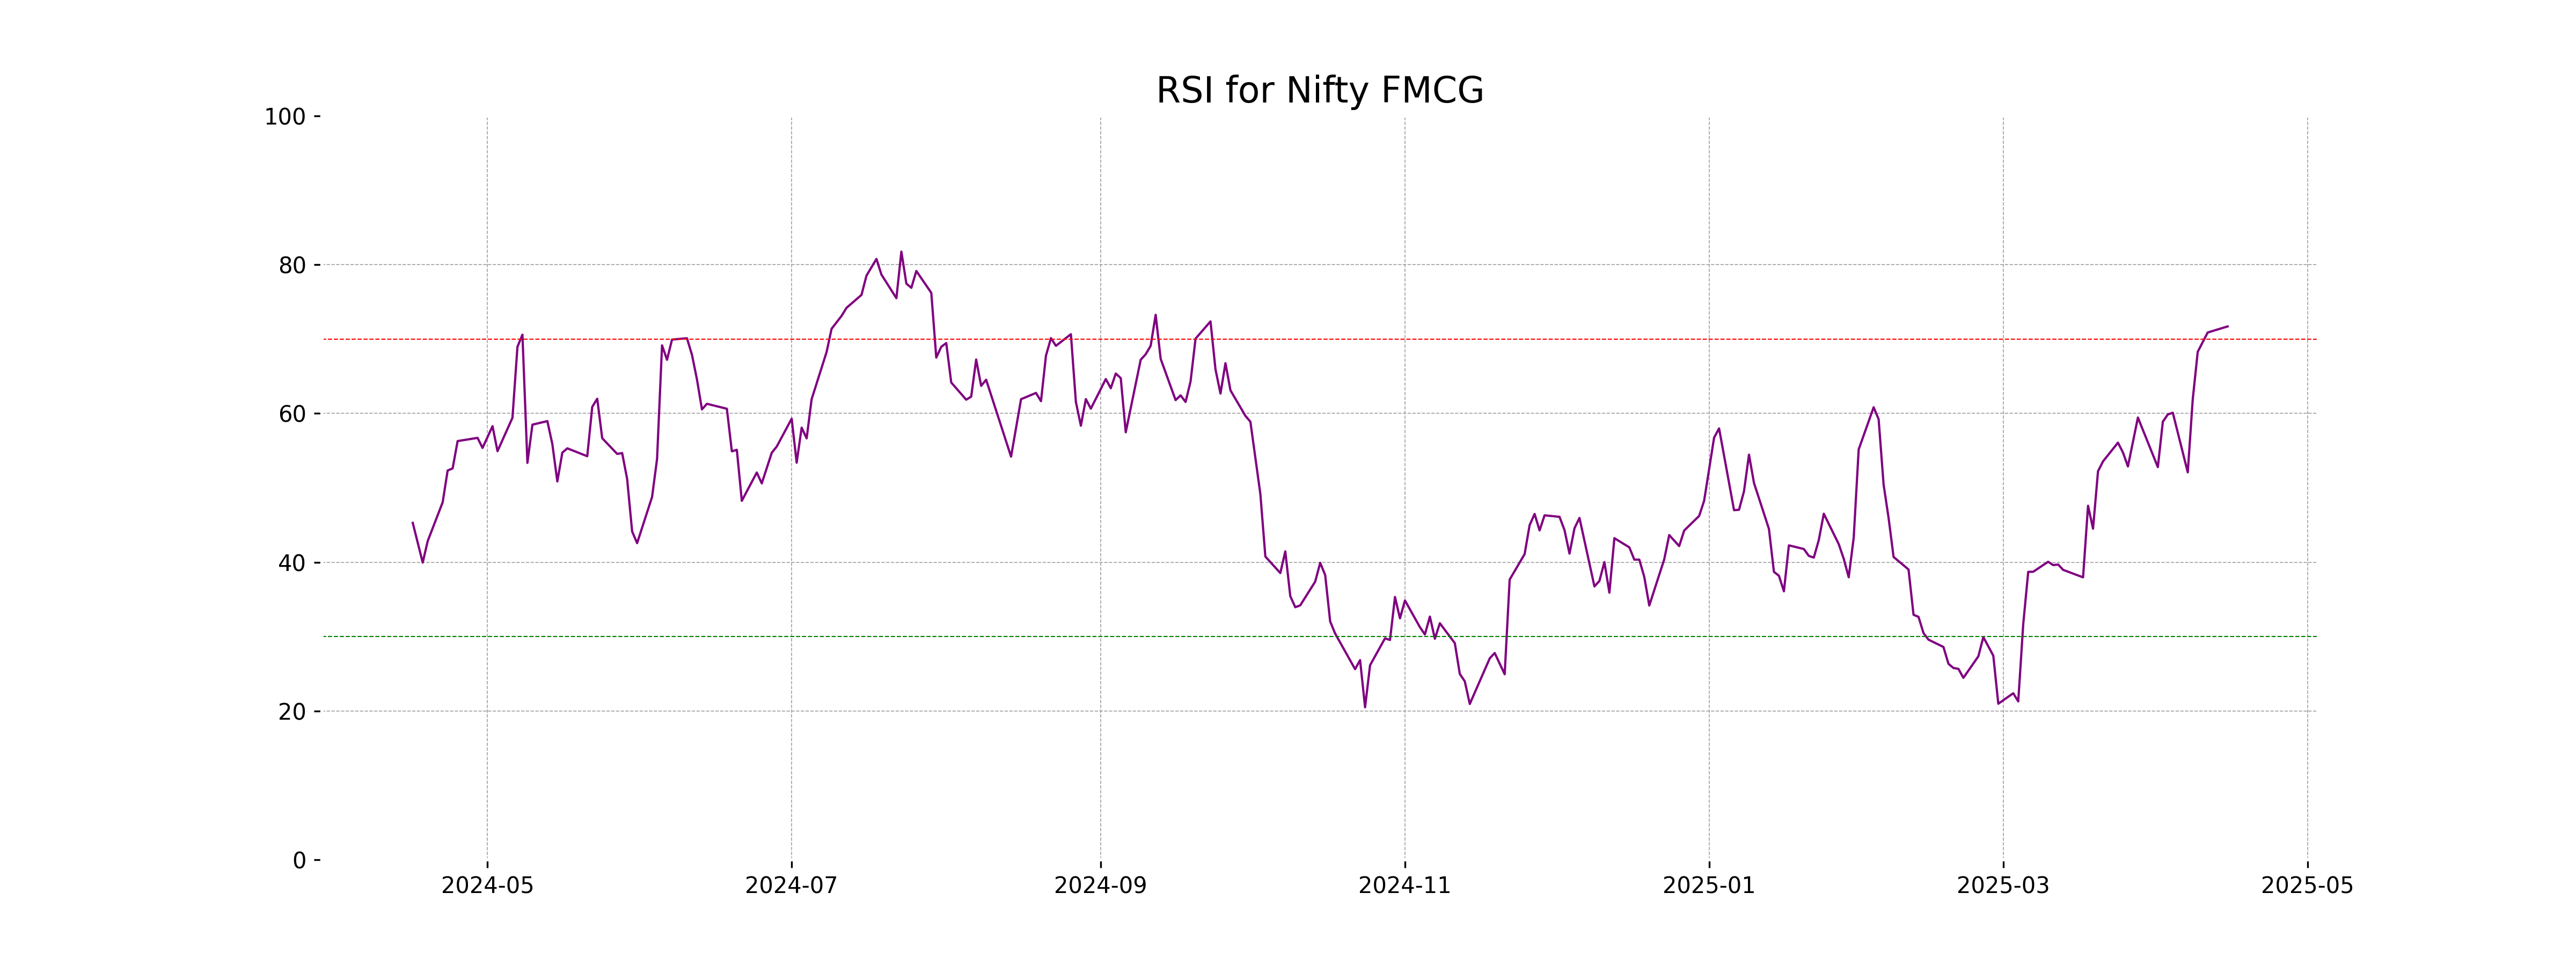
RSI Analysis
Nifty FMCG Relative Strength Index (RSI) Analysis: The RSI value for Nifty FMCG is 71.70, which suggests that the index is in an overbought condition. This may indicate that the index has been experiencing upward momentum, but it could also signal a potential pullback or consolidation in the near future.
Analysis for Nifty Infra - April 15, 2025
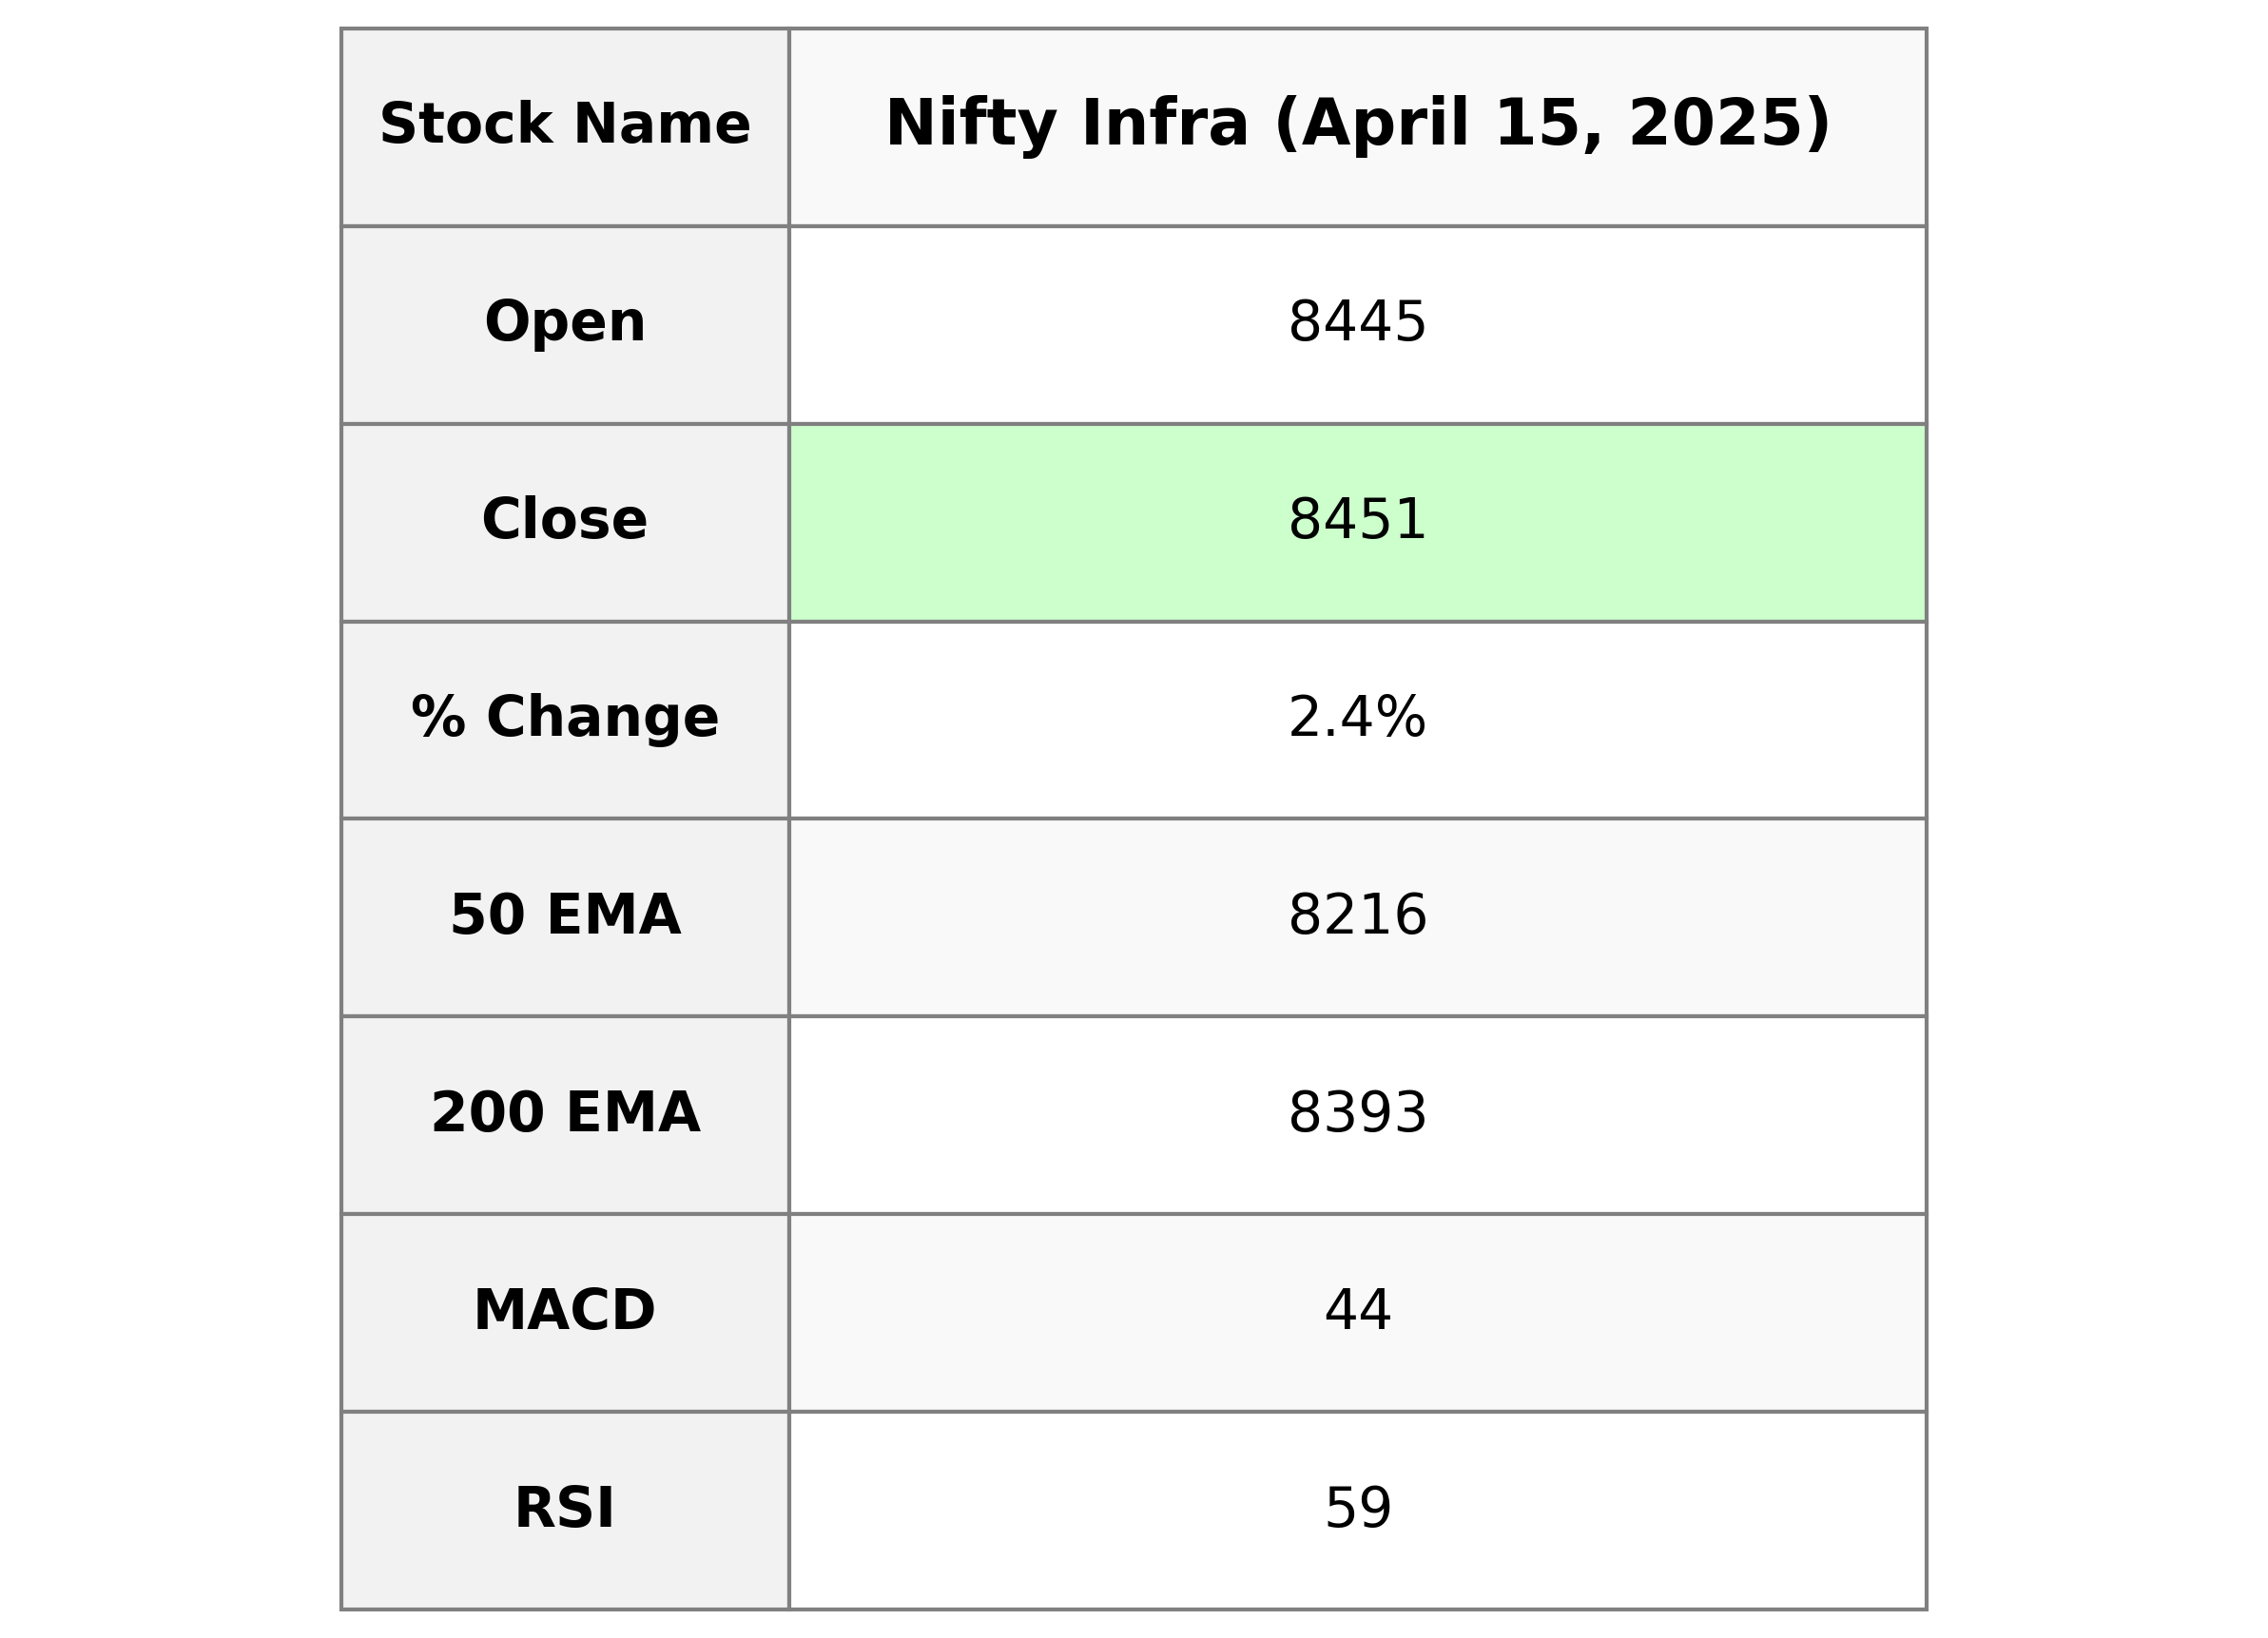
Nifty Infra Performance: Nifty Infra opened at 8444.95, reaching a high of 8460.80 and a low of 8390.10, before closing at 8450.60. The index saw a notable increase of 2.43% from the previous close of 8250.15, recording a points change of 200.45. The Relative Strength Index (RSI) is at 58.99, suggesting a relatively neutral position, while the MACD is below its signal line, indicating a potential shift in momentum.
Relationship with Key Moving Averages
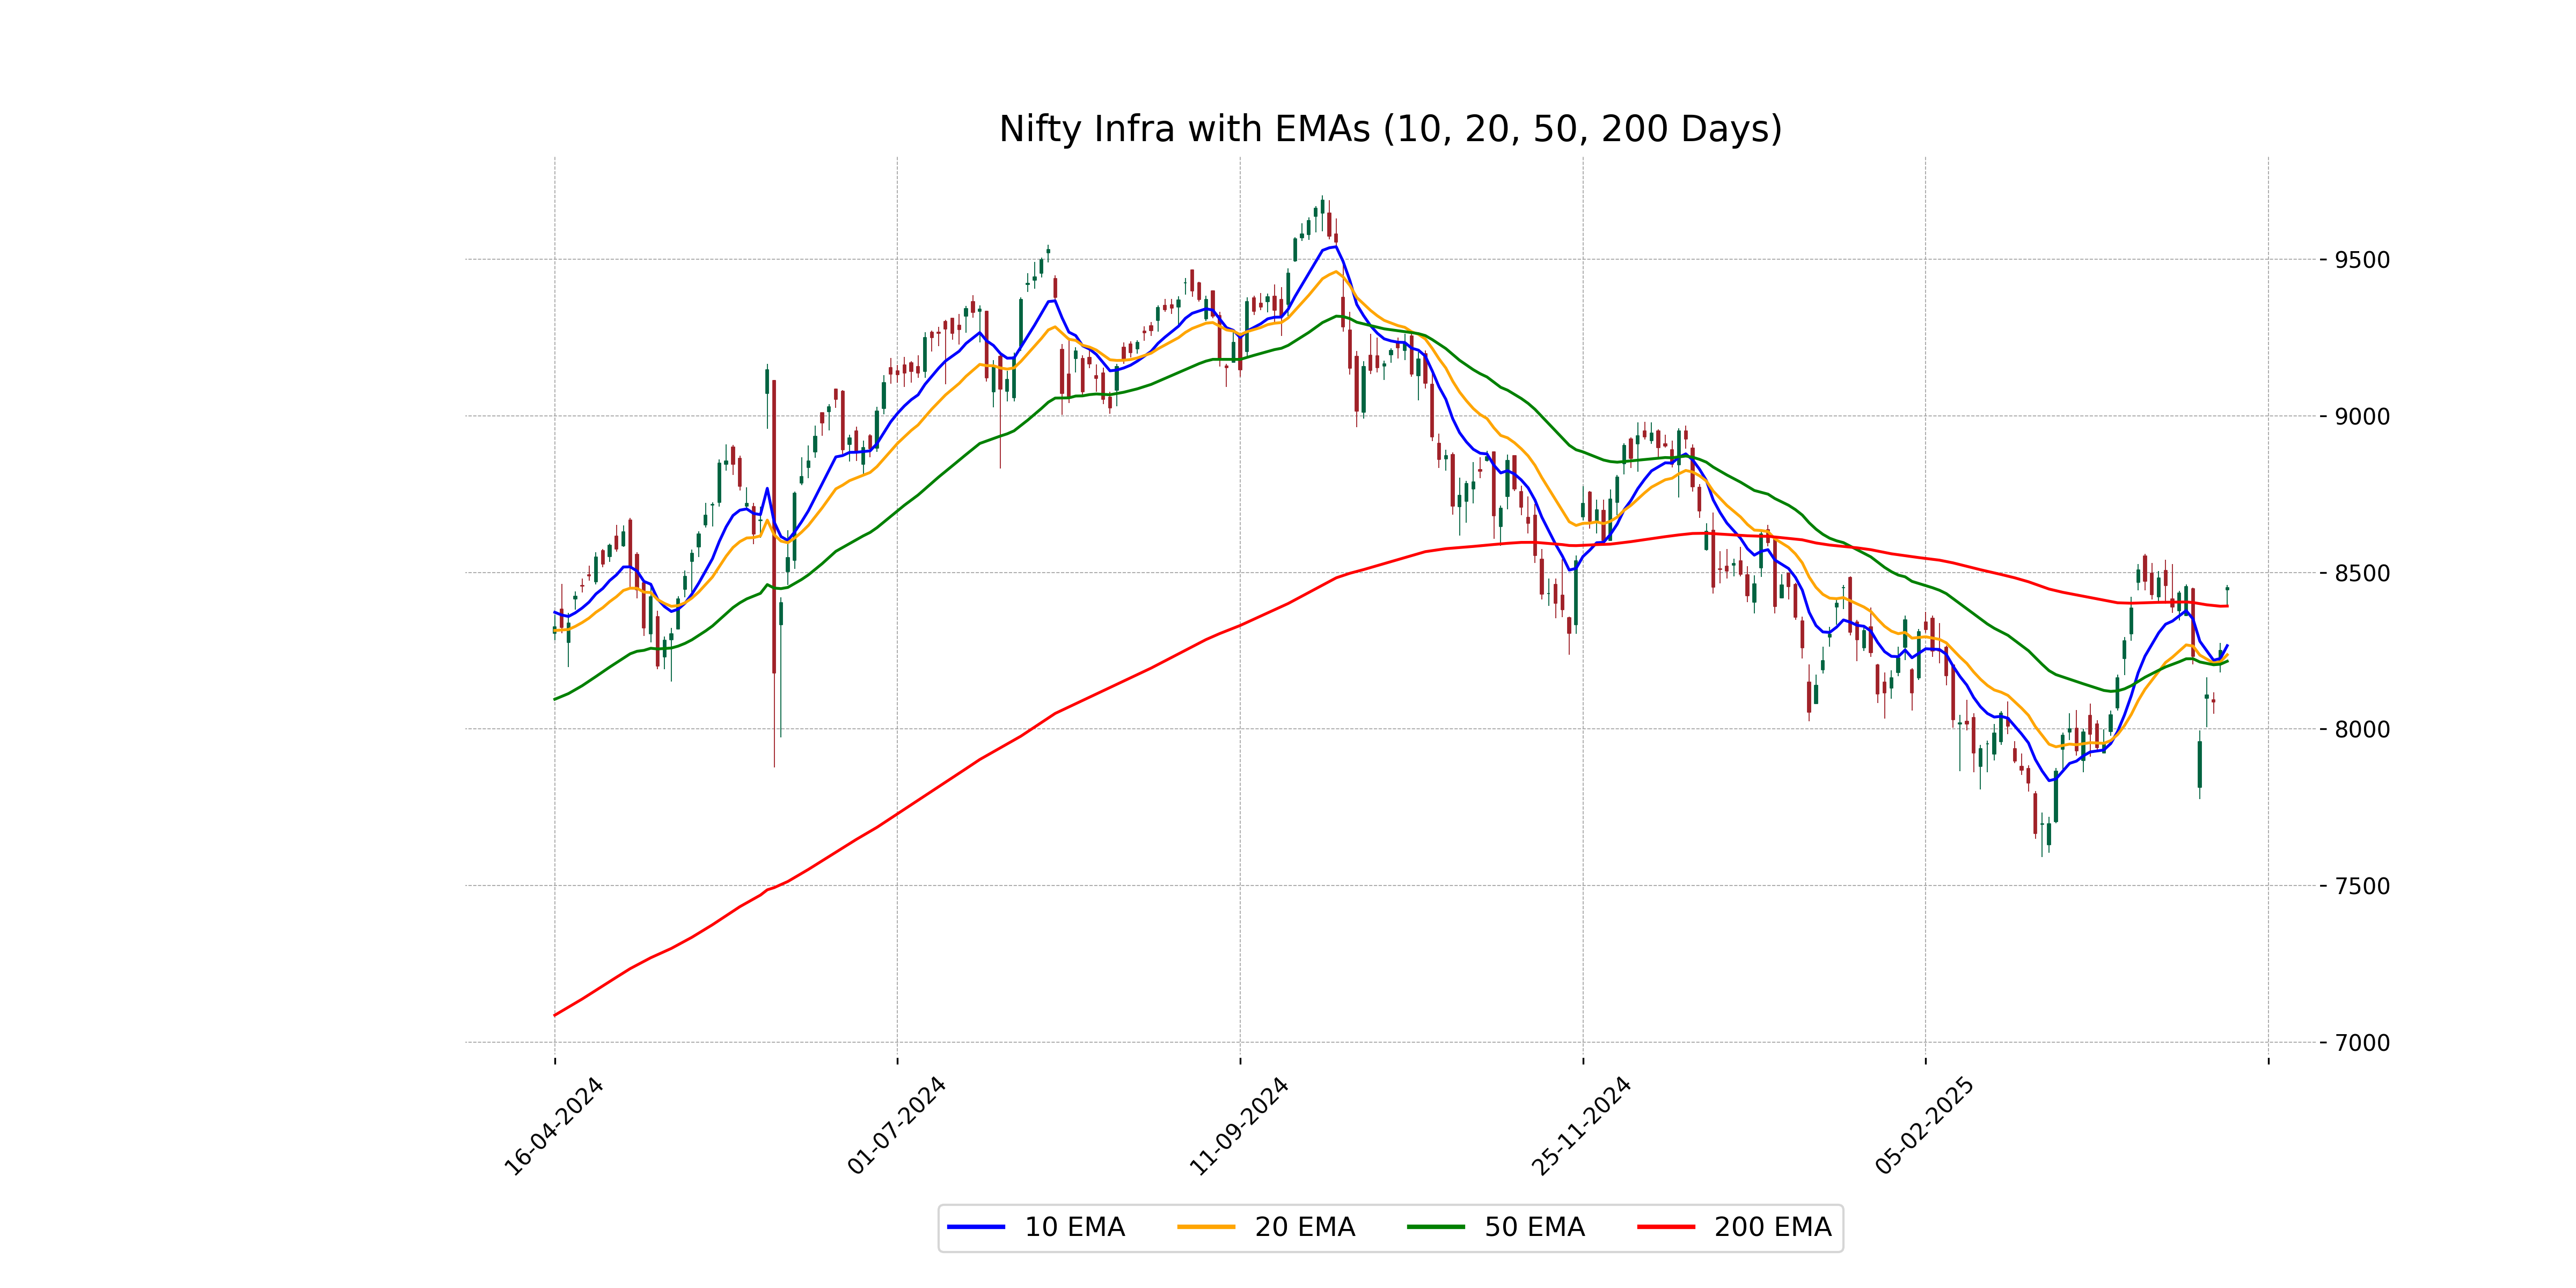
The closing price of Nifty Infra at 8450.60 is above the 50-day EMA of 8216.37 and the 200-day EMA of 8392.70, as well as above the 10-day and 20-day EMAs, indicating a potential bullish trend. Additionally, the MACD value is less than the MACD Signal, suggesting cautious optimism.
Moving Averages Trend (MACD)
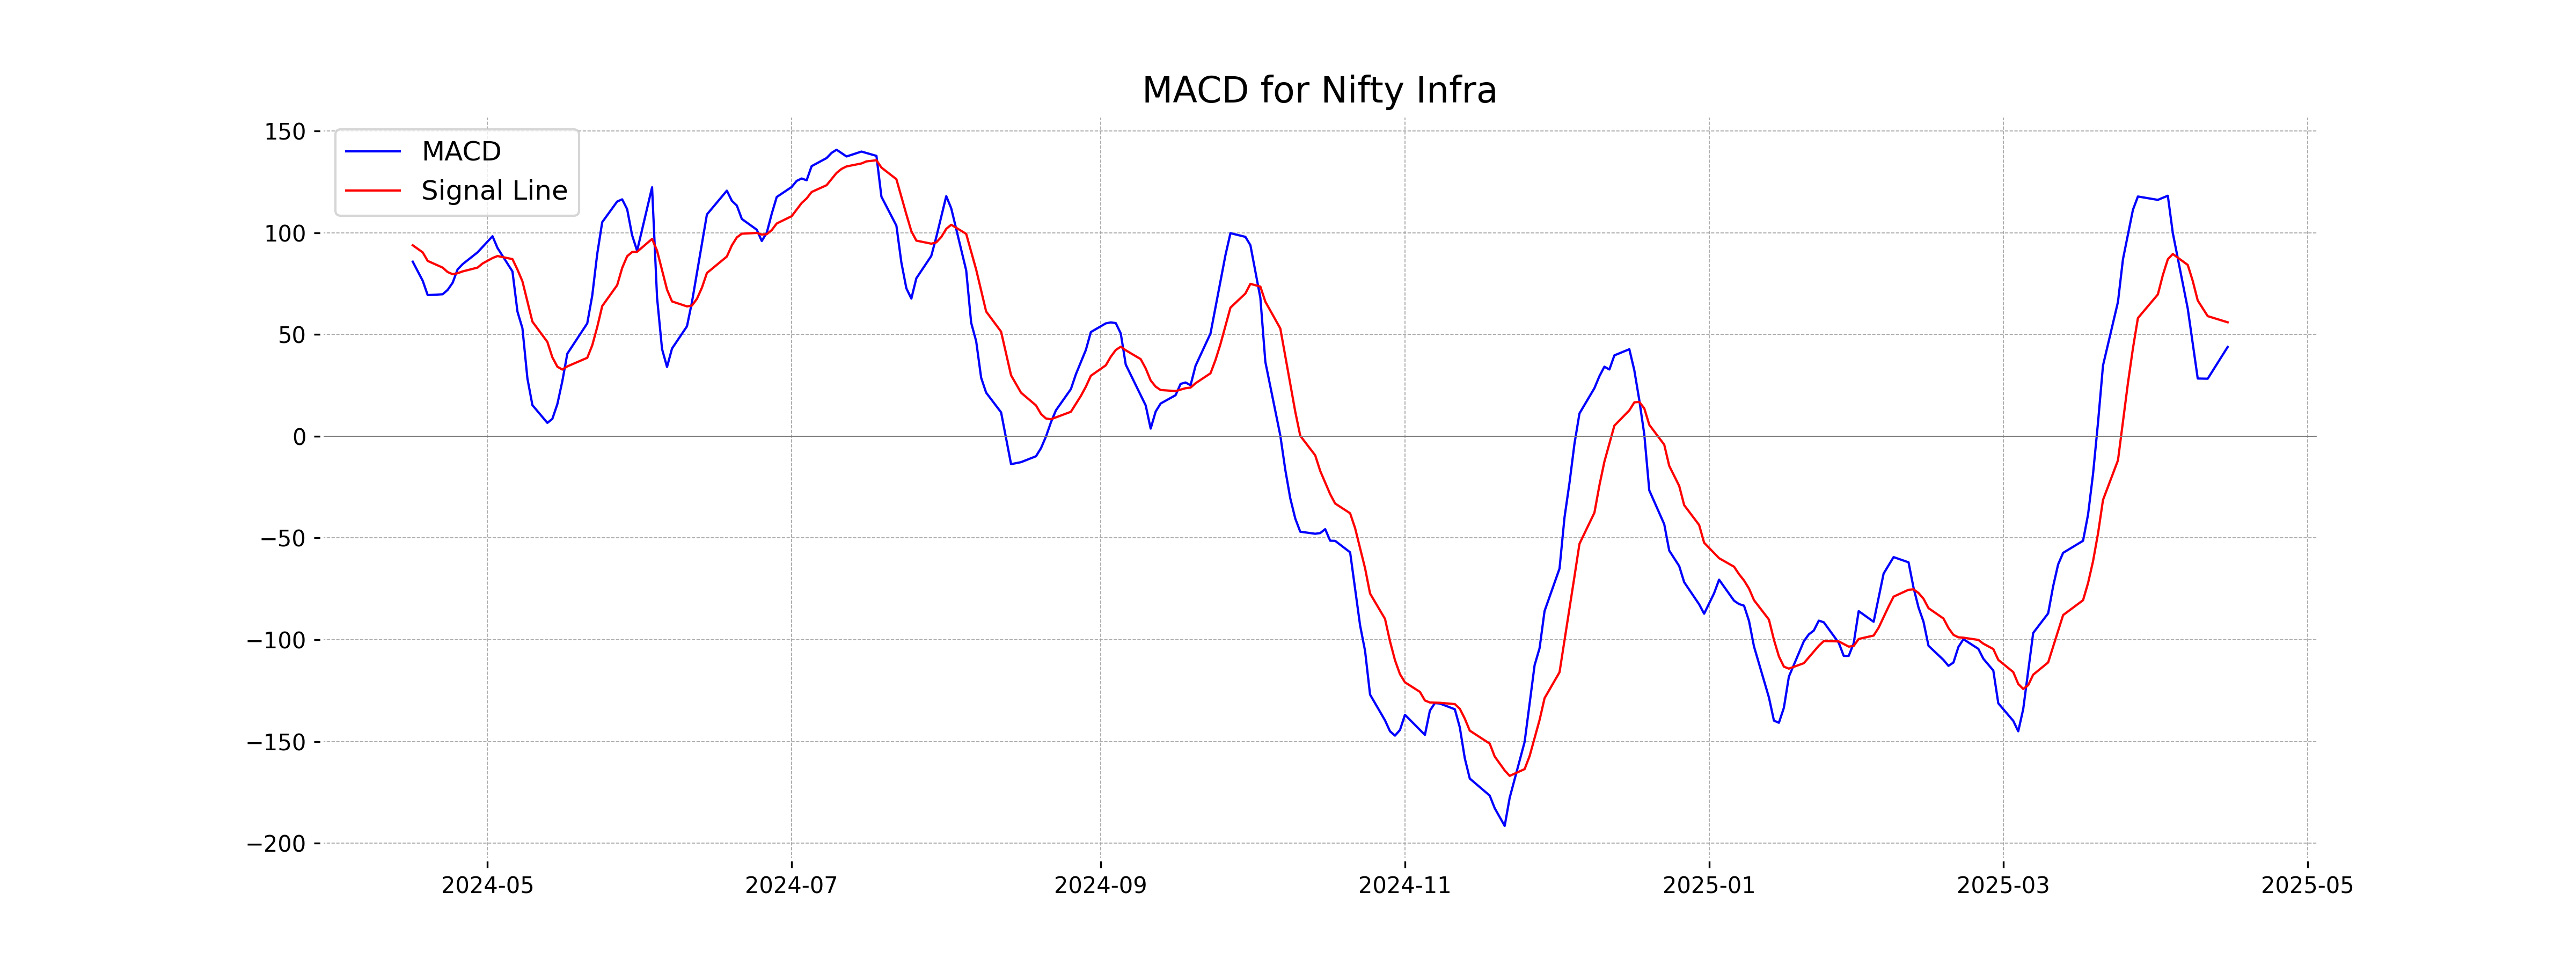
The MACD for Nifty Infra is currently at 43.88, which is below the MACD Signal line at 56.01. This crossover indicates potential bearish momentum, suggesting the stock's upward movement may be slowing down or reversing.
RSI Analysis
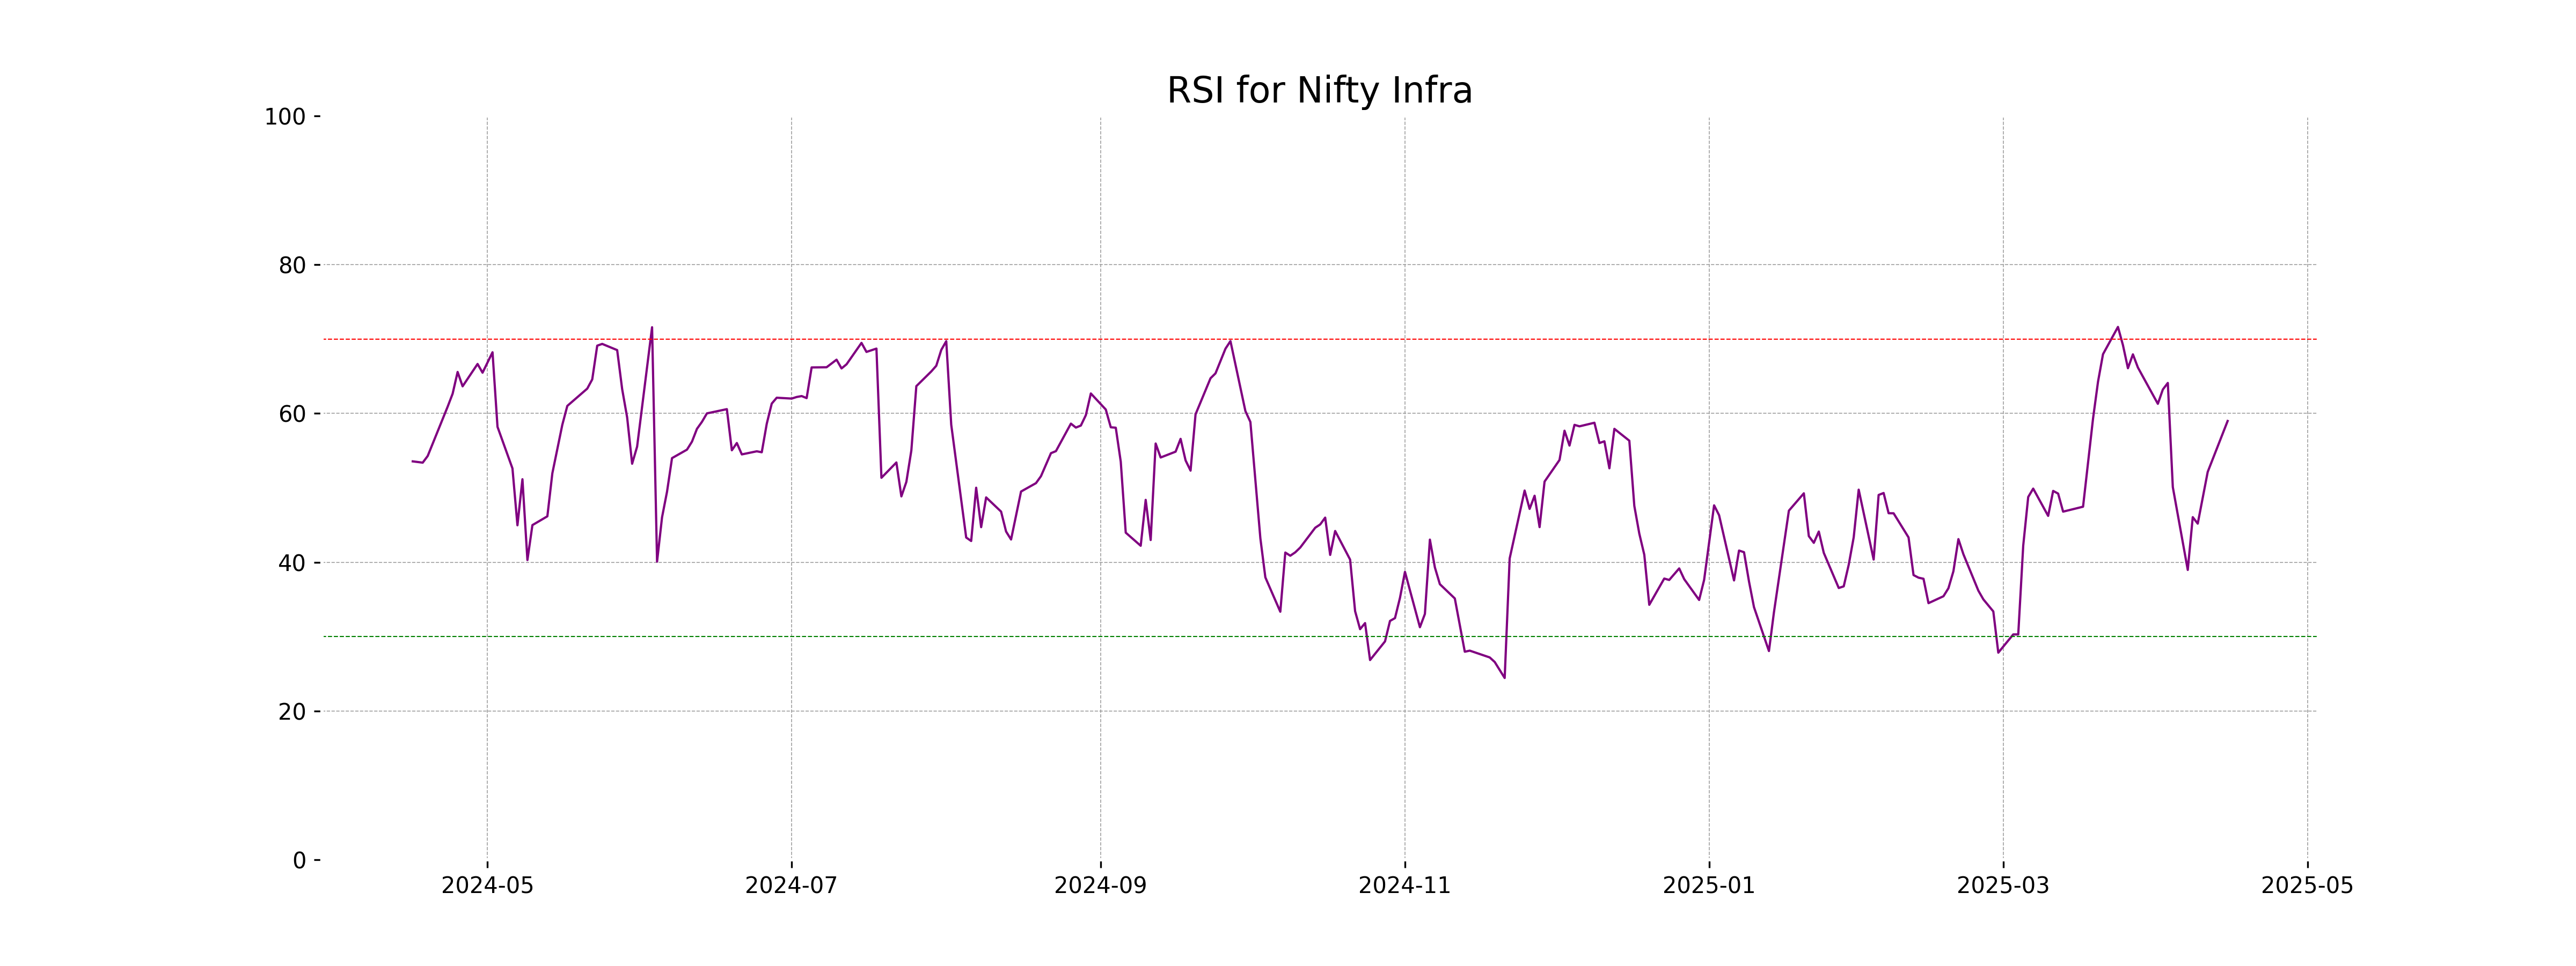
The Relative Strength Index (RSI) for Nifty Infra is 58.99, which suggests that the index is currently experiencing moderate momentum. It is not in the overbought or oversold territory, indicating a neutral to mildly bullish market sentiment.
Analysis for Nifty IT - April 15, 2025
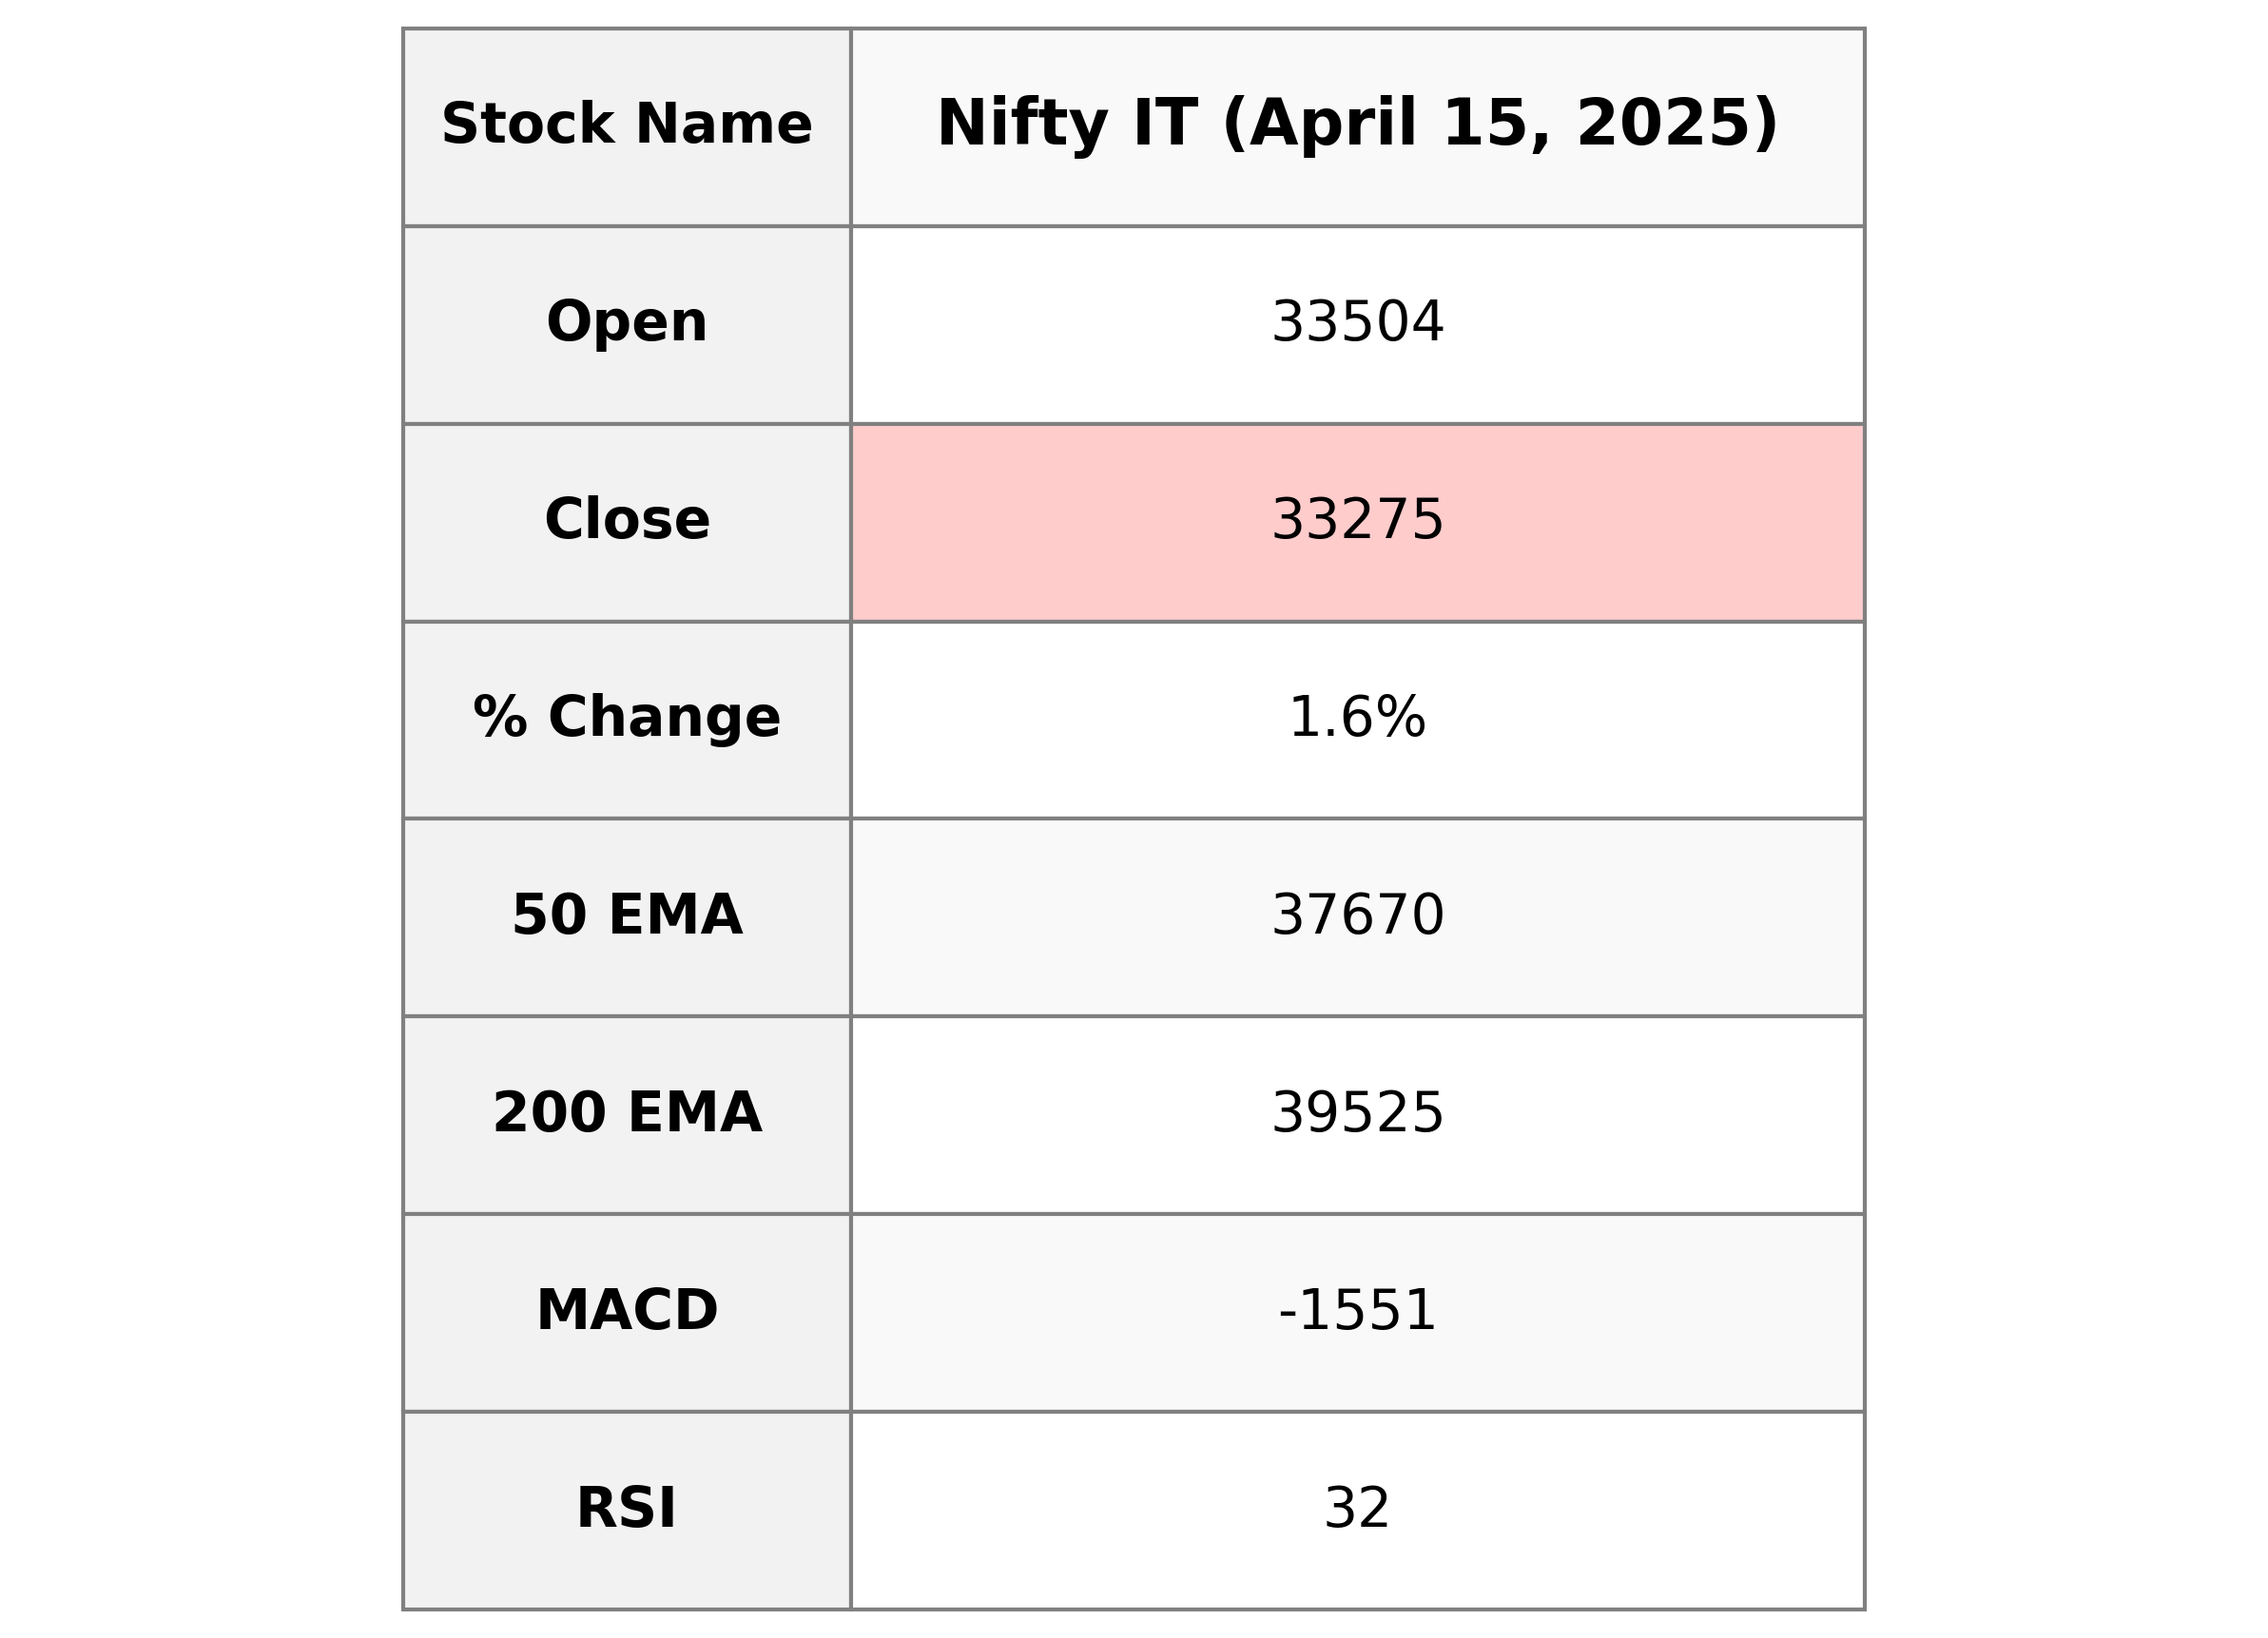
Nifty IT opened at 33504.15 and closed at 33275.30, with a percentage change of 1.63% from the previous close. Despite the increase of 534.45 points, Nifty IT's RSI is at 31.88, indicating it is approaching oversold territory. The MACD value of -1551.40 suggests bearish momentum as it is below the signal line.
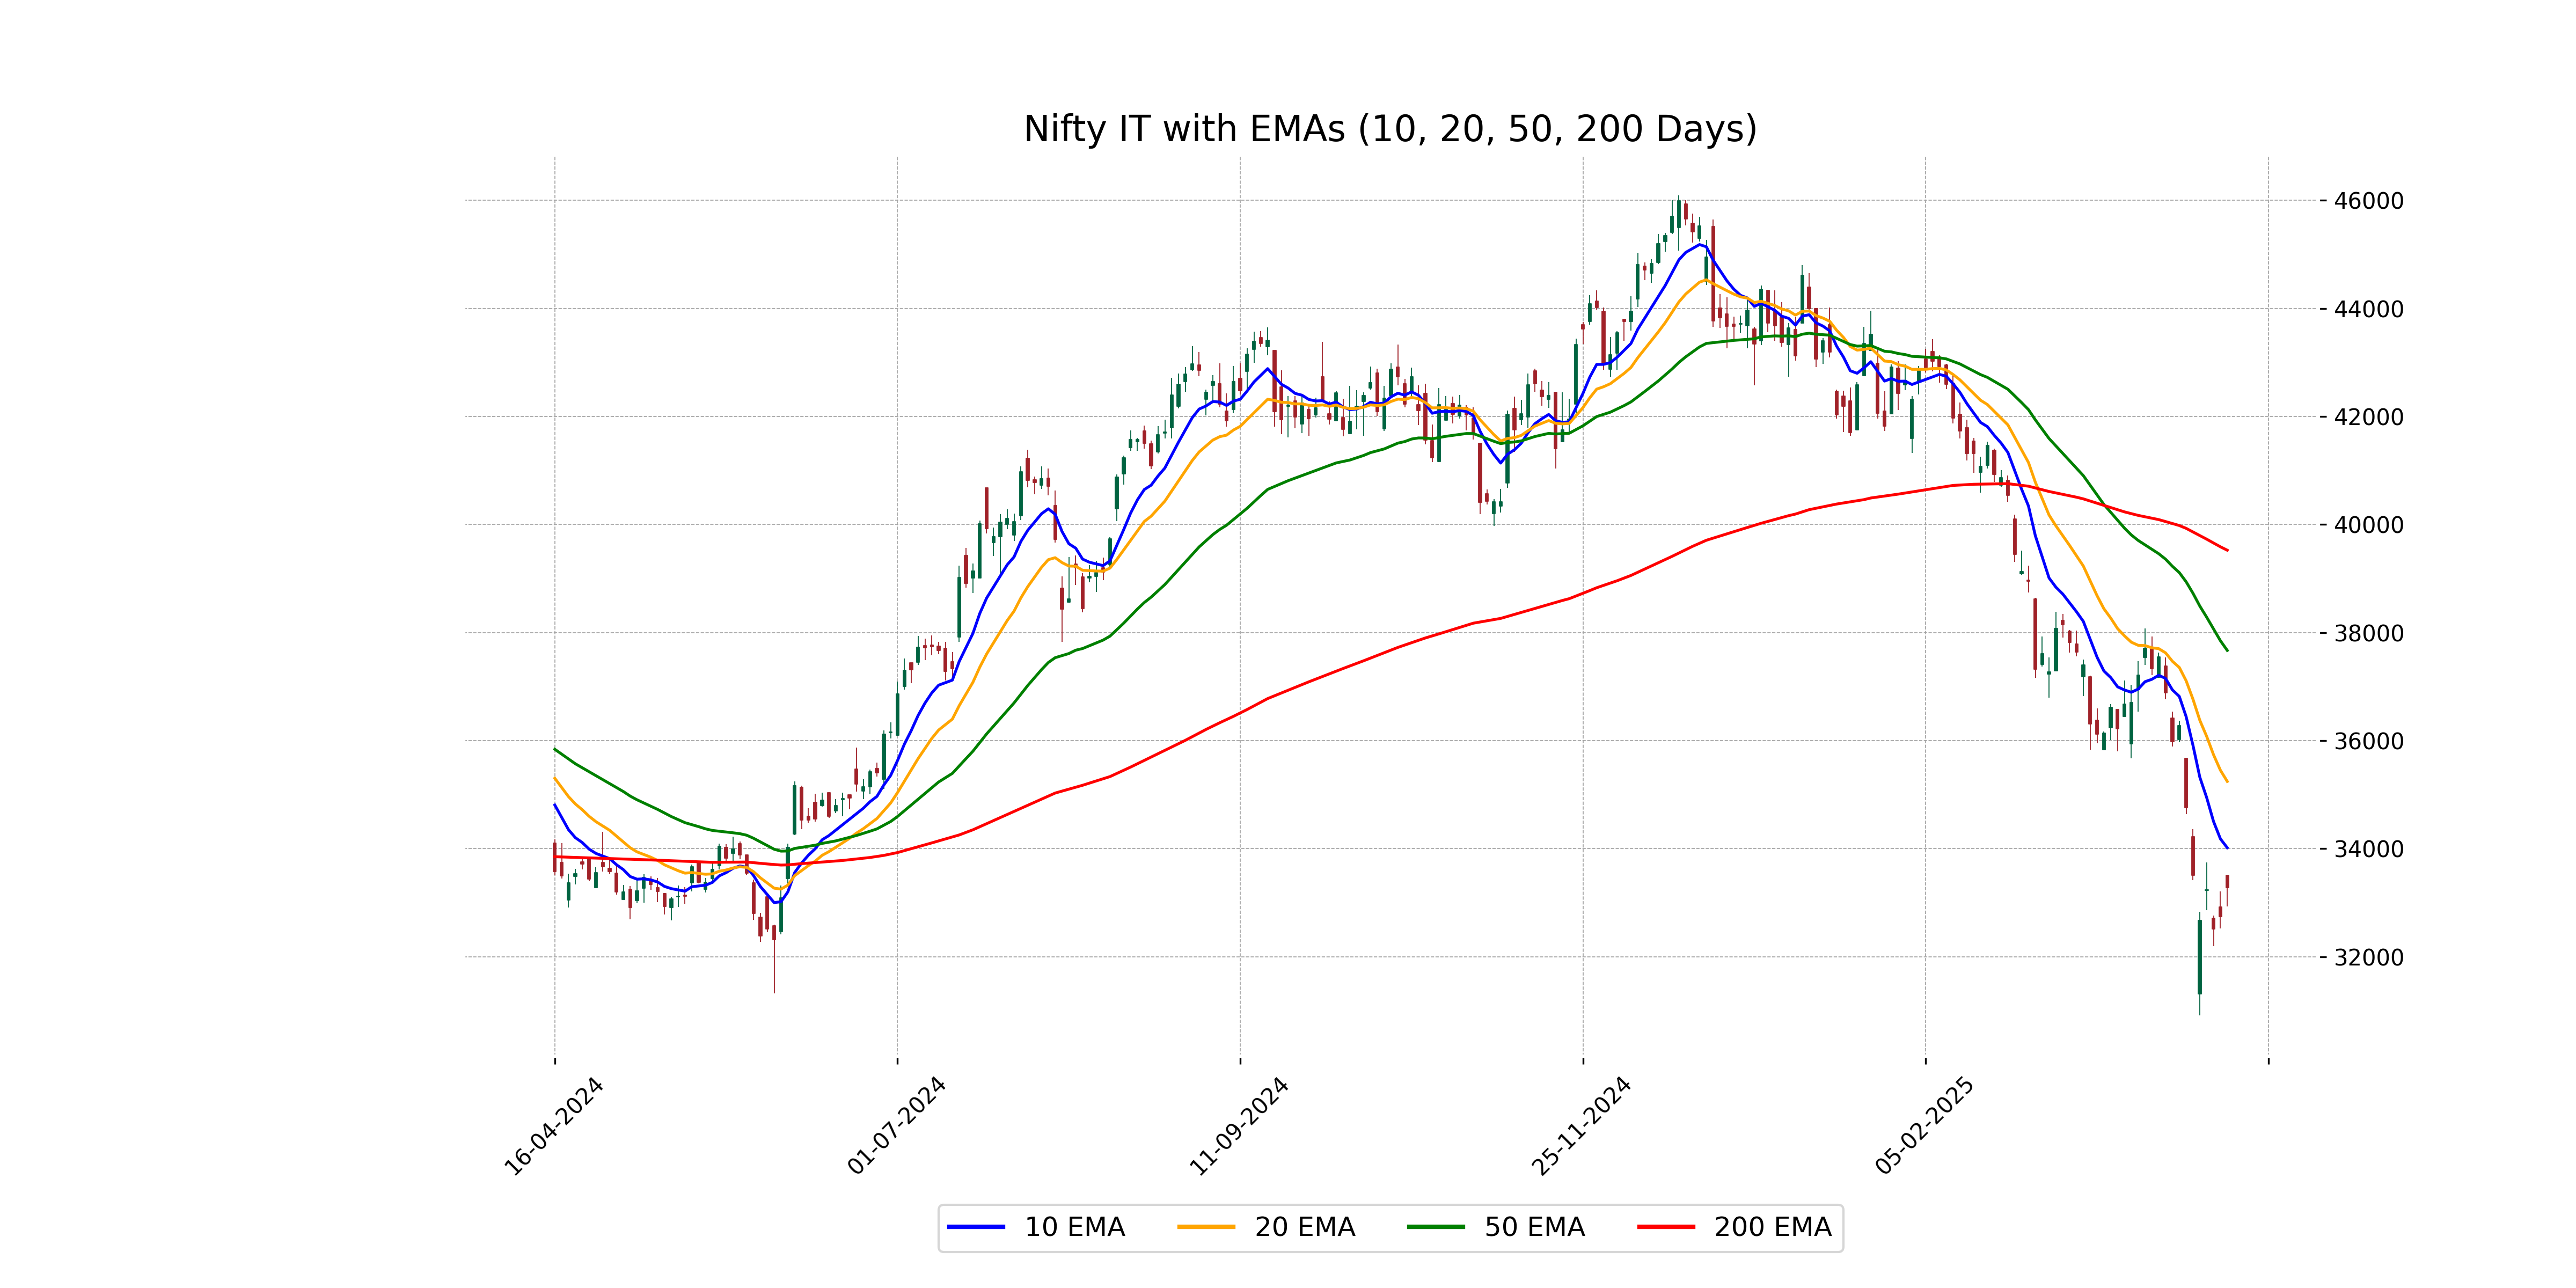
Relationship with Key Moving Averages
Nifty IT's closing price is below its 50-day and 200-day EMAs, indicating a bearish trend. However, it is above the 10-day EMA but below the 20-day EMA, suggesting short-term upward momentum within a longer-term downtrend.
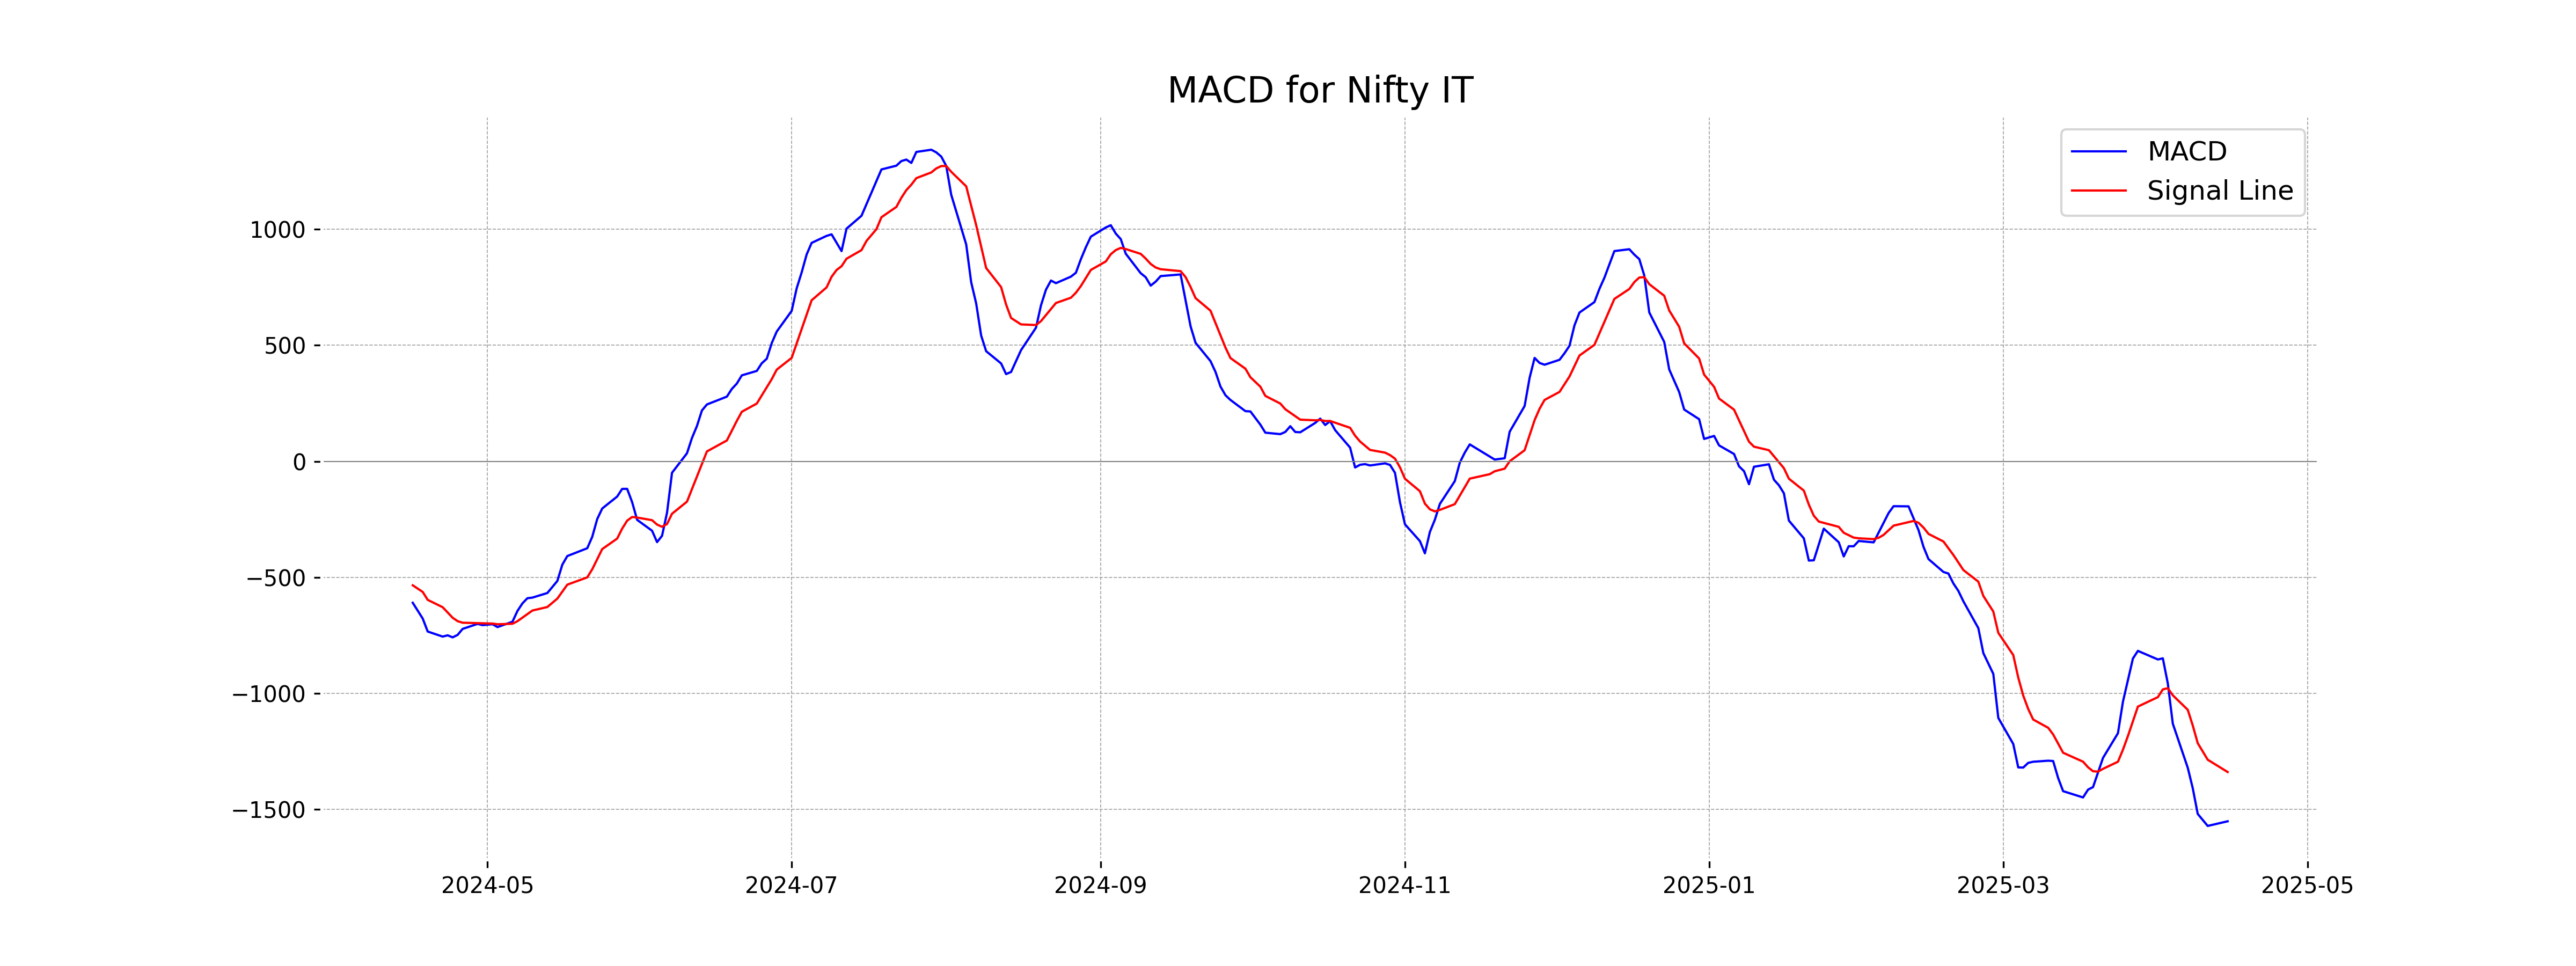
Moving Averages Trend (MACD)
The MACD for Nifty IT is -1551.40, while the MACD Signal is -1339.15. This indicates a bearish momentum, as the MACD line is below the signal line. The negative values suggest that the downward trend might continue unless there's a significant change in momentum.
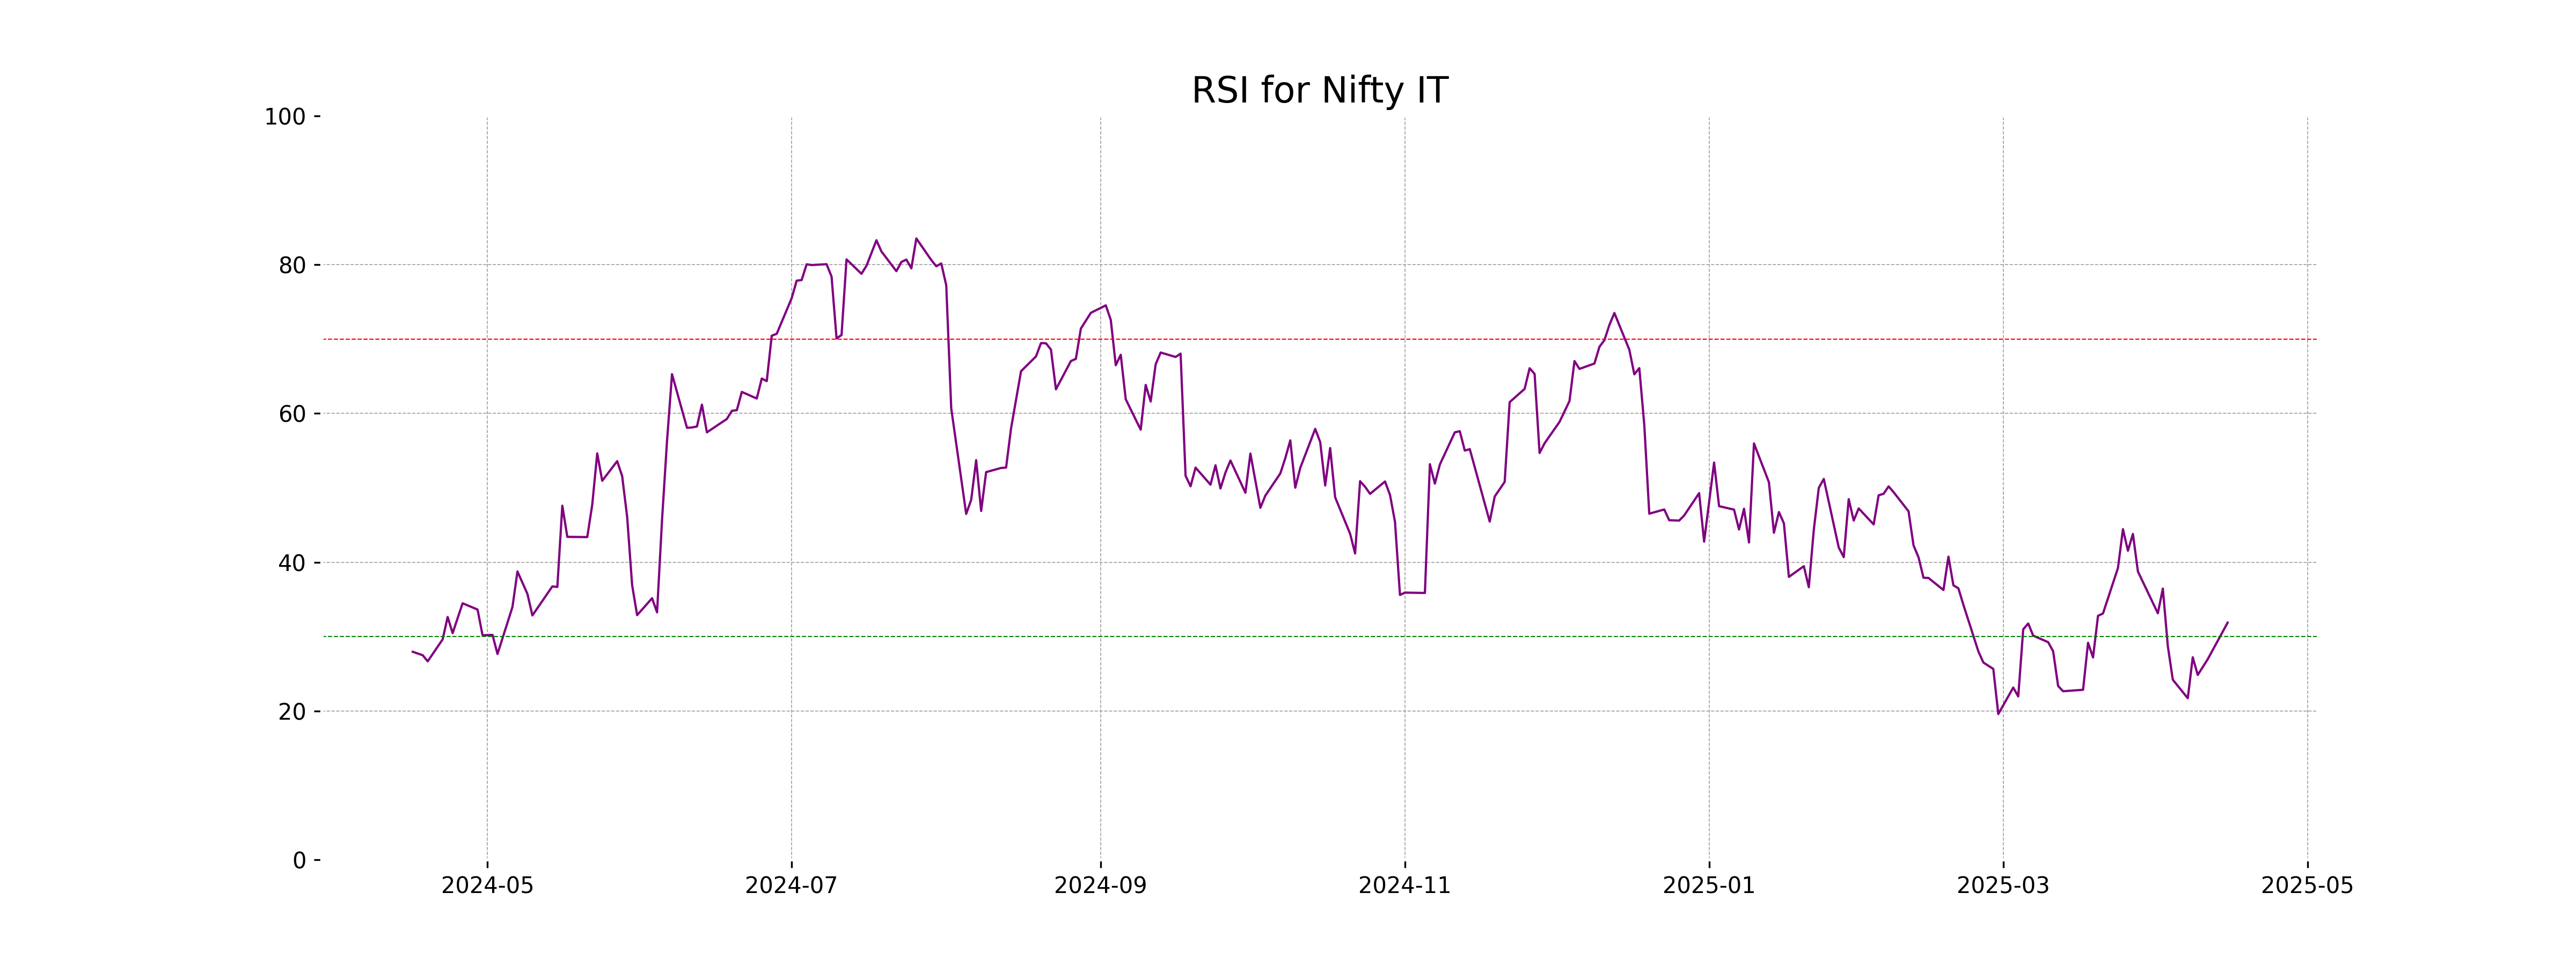
RSI Analysis
The RSI for Nifty IT is at 31.88, indicating that the stock is approaching oversold territory. This suggests that the stock may be undervalued at the moment, presenting a potential buying opportunity for investors if the trend reverses.
Analysis for Nifty Metal - April 15, 2025
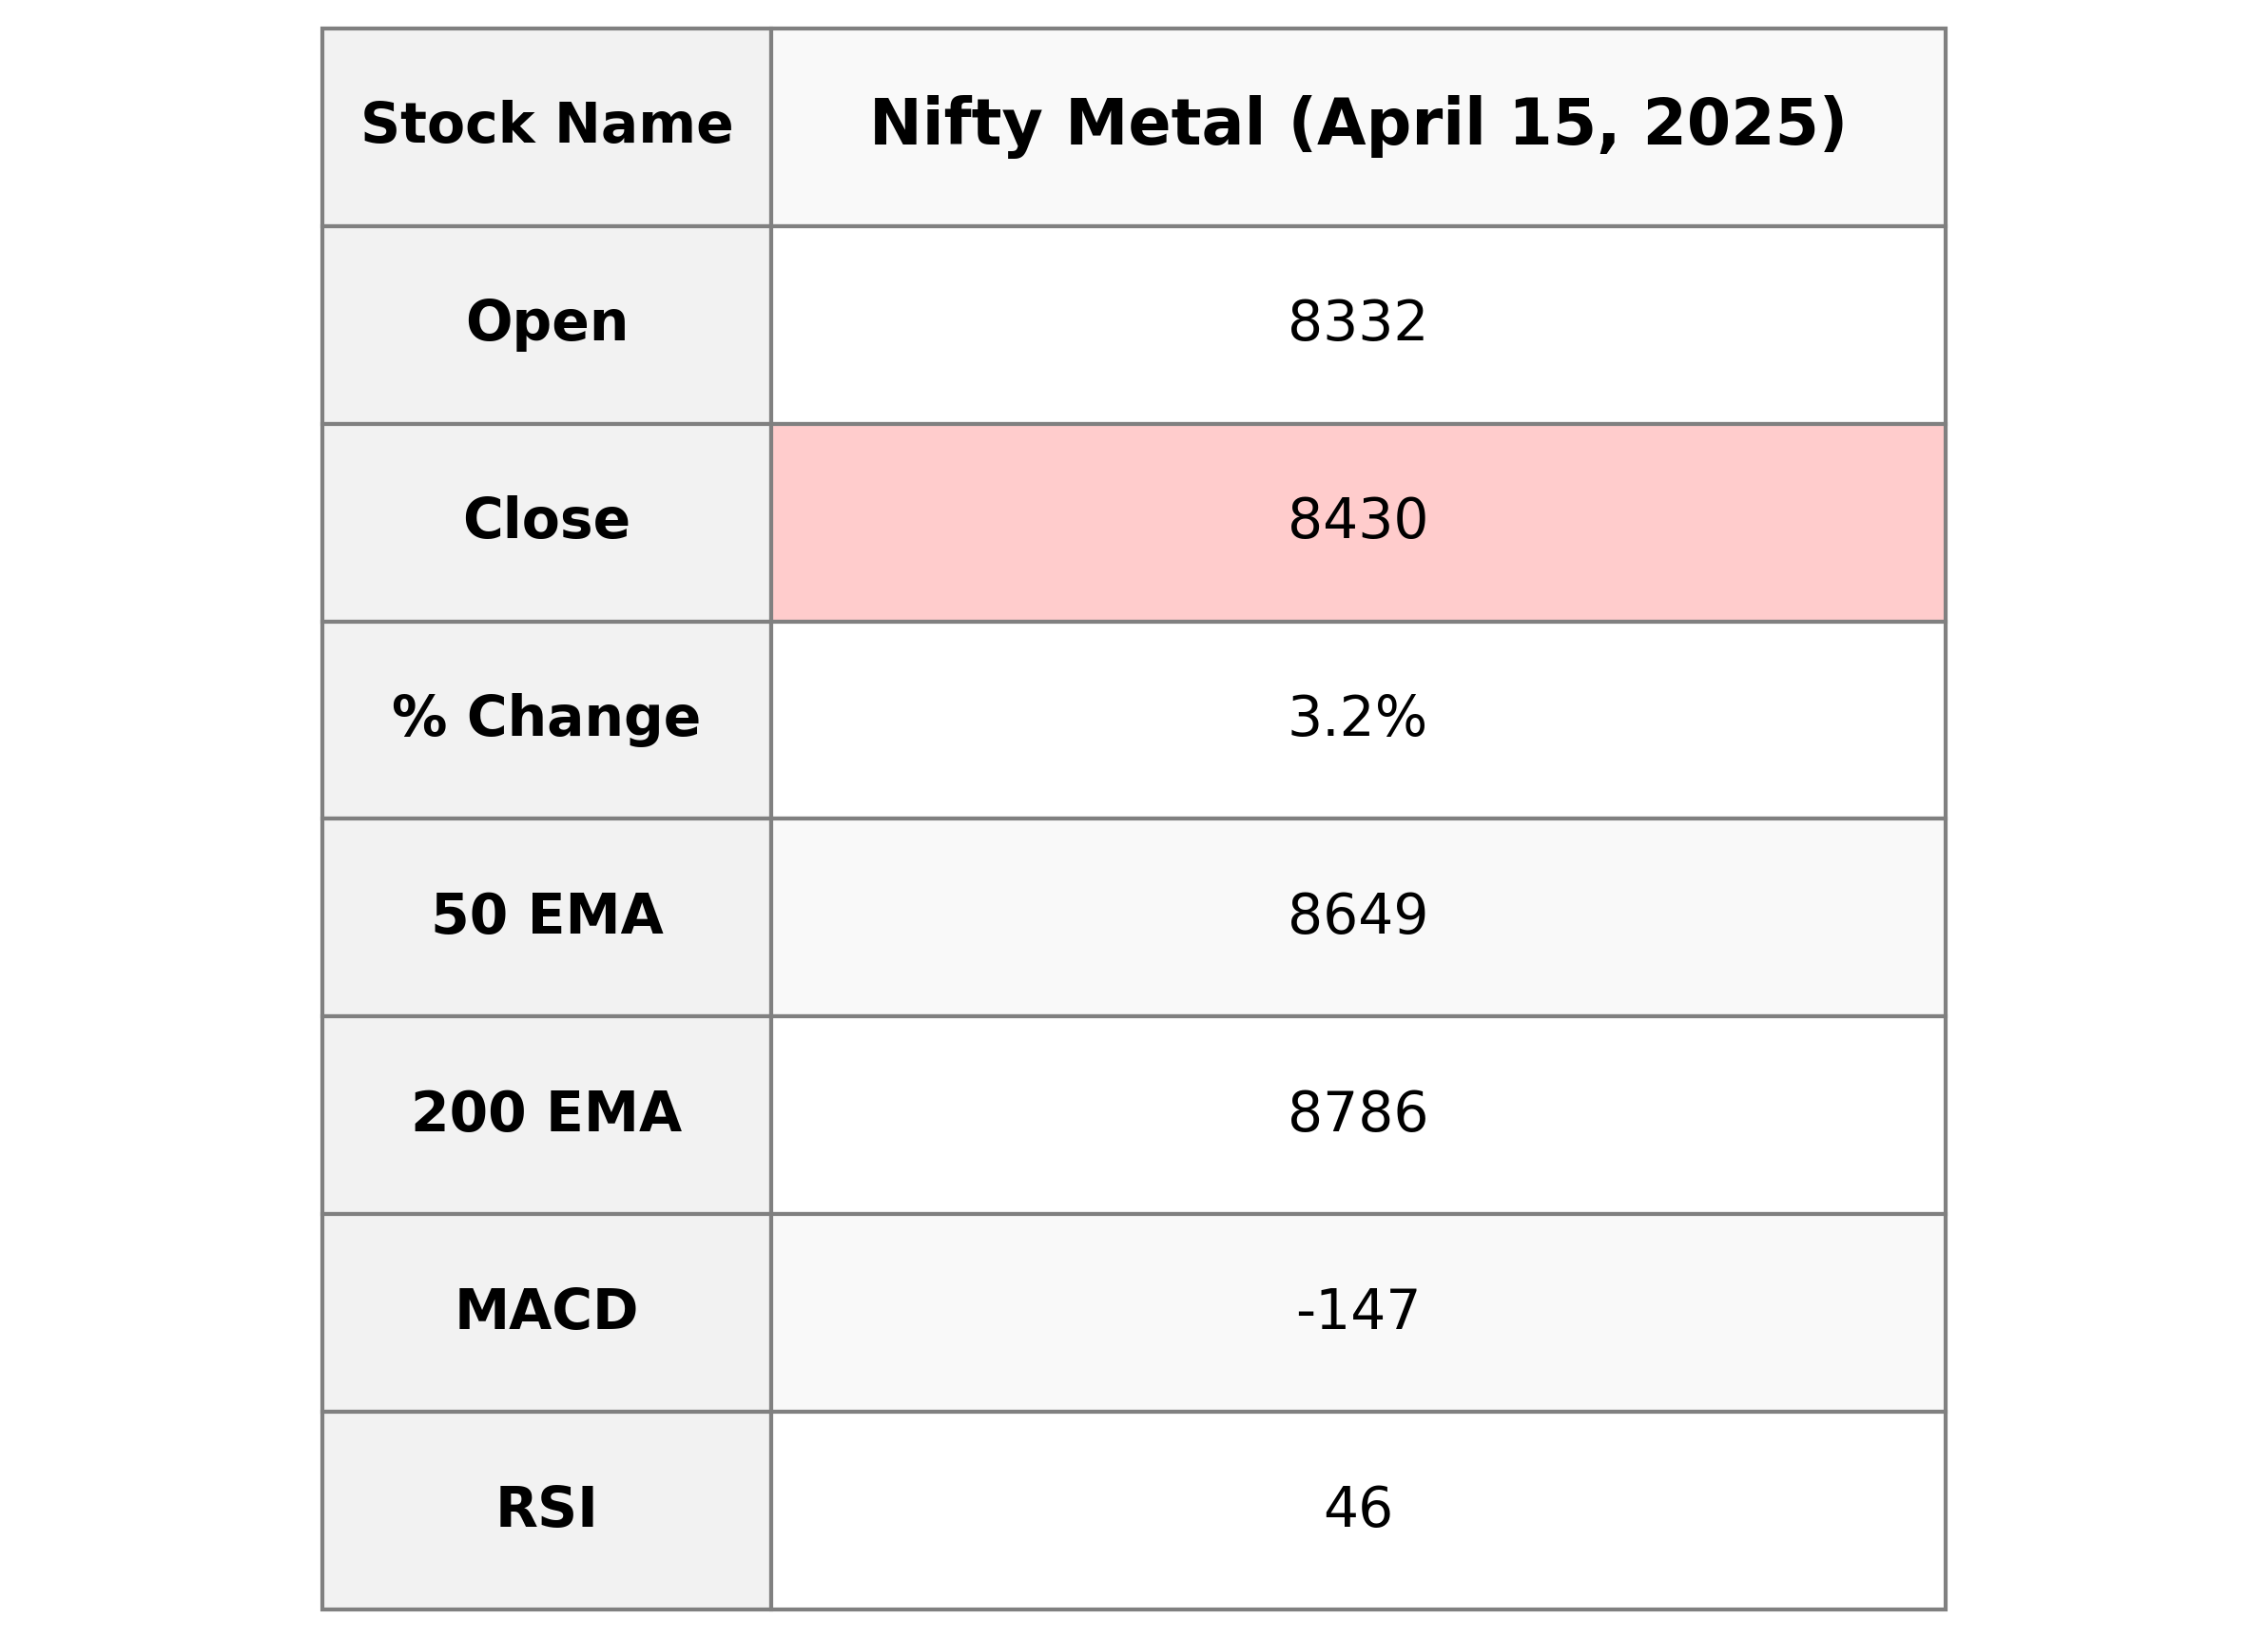
Nifty Metal opened at 8332.4, reached a high of 8446.3, and closed at 8429.85, showing a positive movement with a substantial percentage change of 3.20%. Despite the upward trend, the RSI at 45.79 suggests a neutral momentum, while the negative MACD value indicates bearish underlying strength.
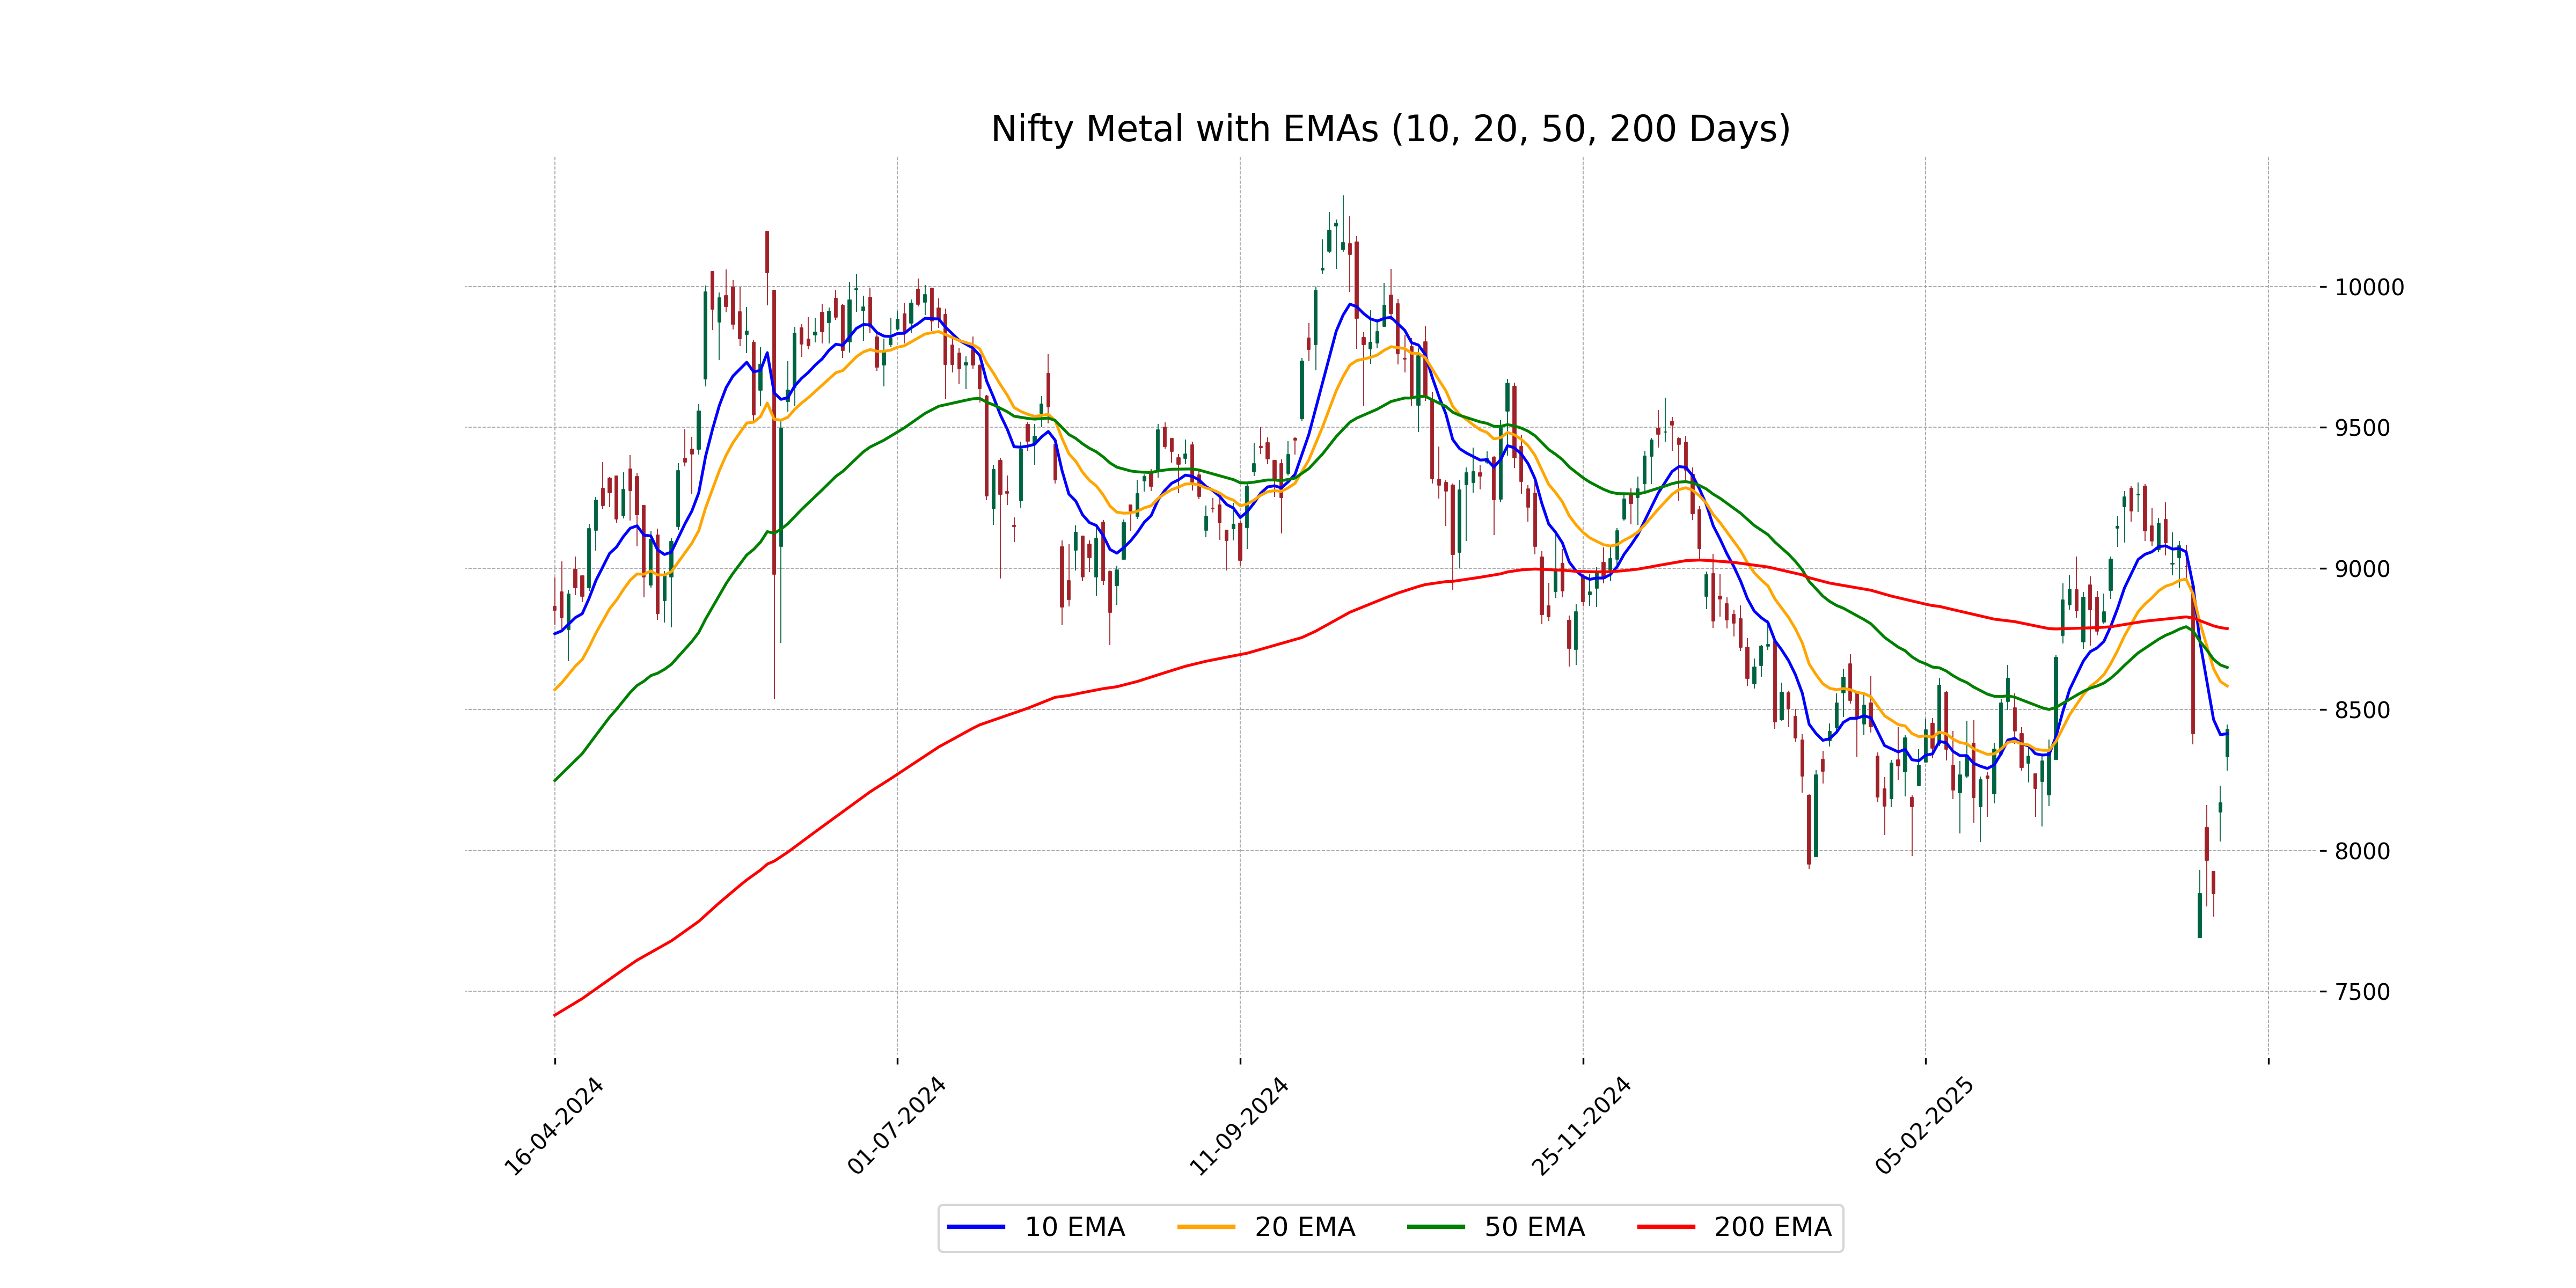
Relationship with Key Moving Averages
Nifty Metal closed at 8429.85, lying below the 50 EMA of 8648.64 and 200 EMA of 8786.38, indicating a potential bearish trend. However, it is slightly above the 10 EMA of 8413.89, suggesting minor recent upward momentum.
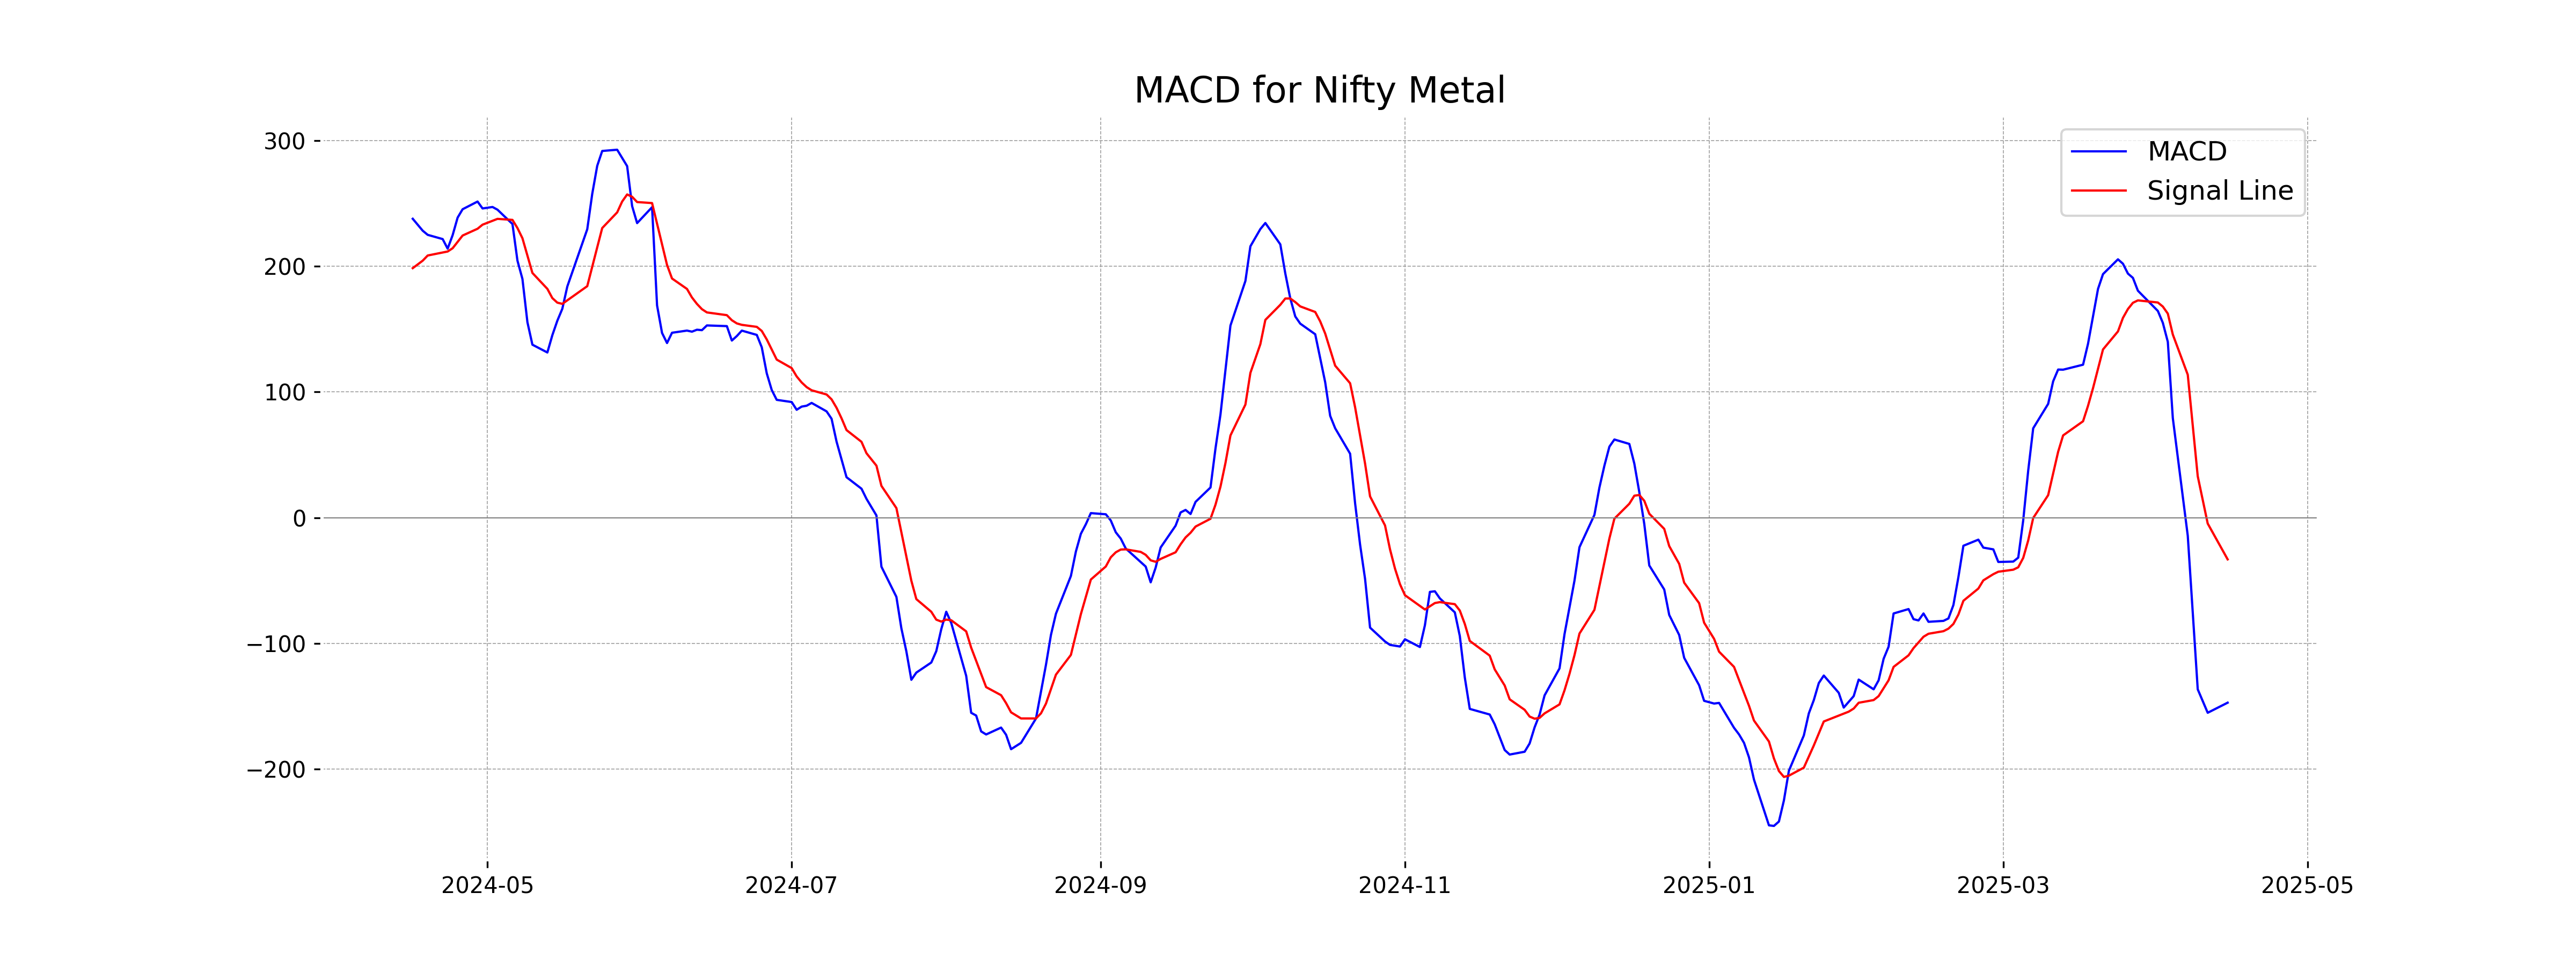
Moving Averages Trend (MACD)
The MACD for Nifty Metal is currently at -147.20, which is below the MACD Signal of -33.19. This suggests a bearish trend in momentum, as the MACD line is significantly lower than the signal line, indicating potential downward pressure on the stock.
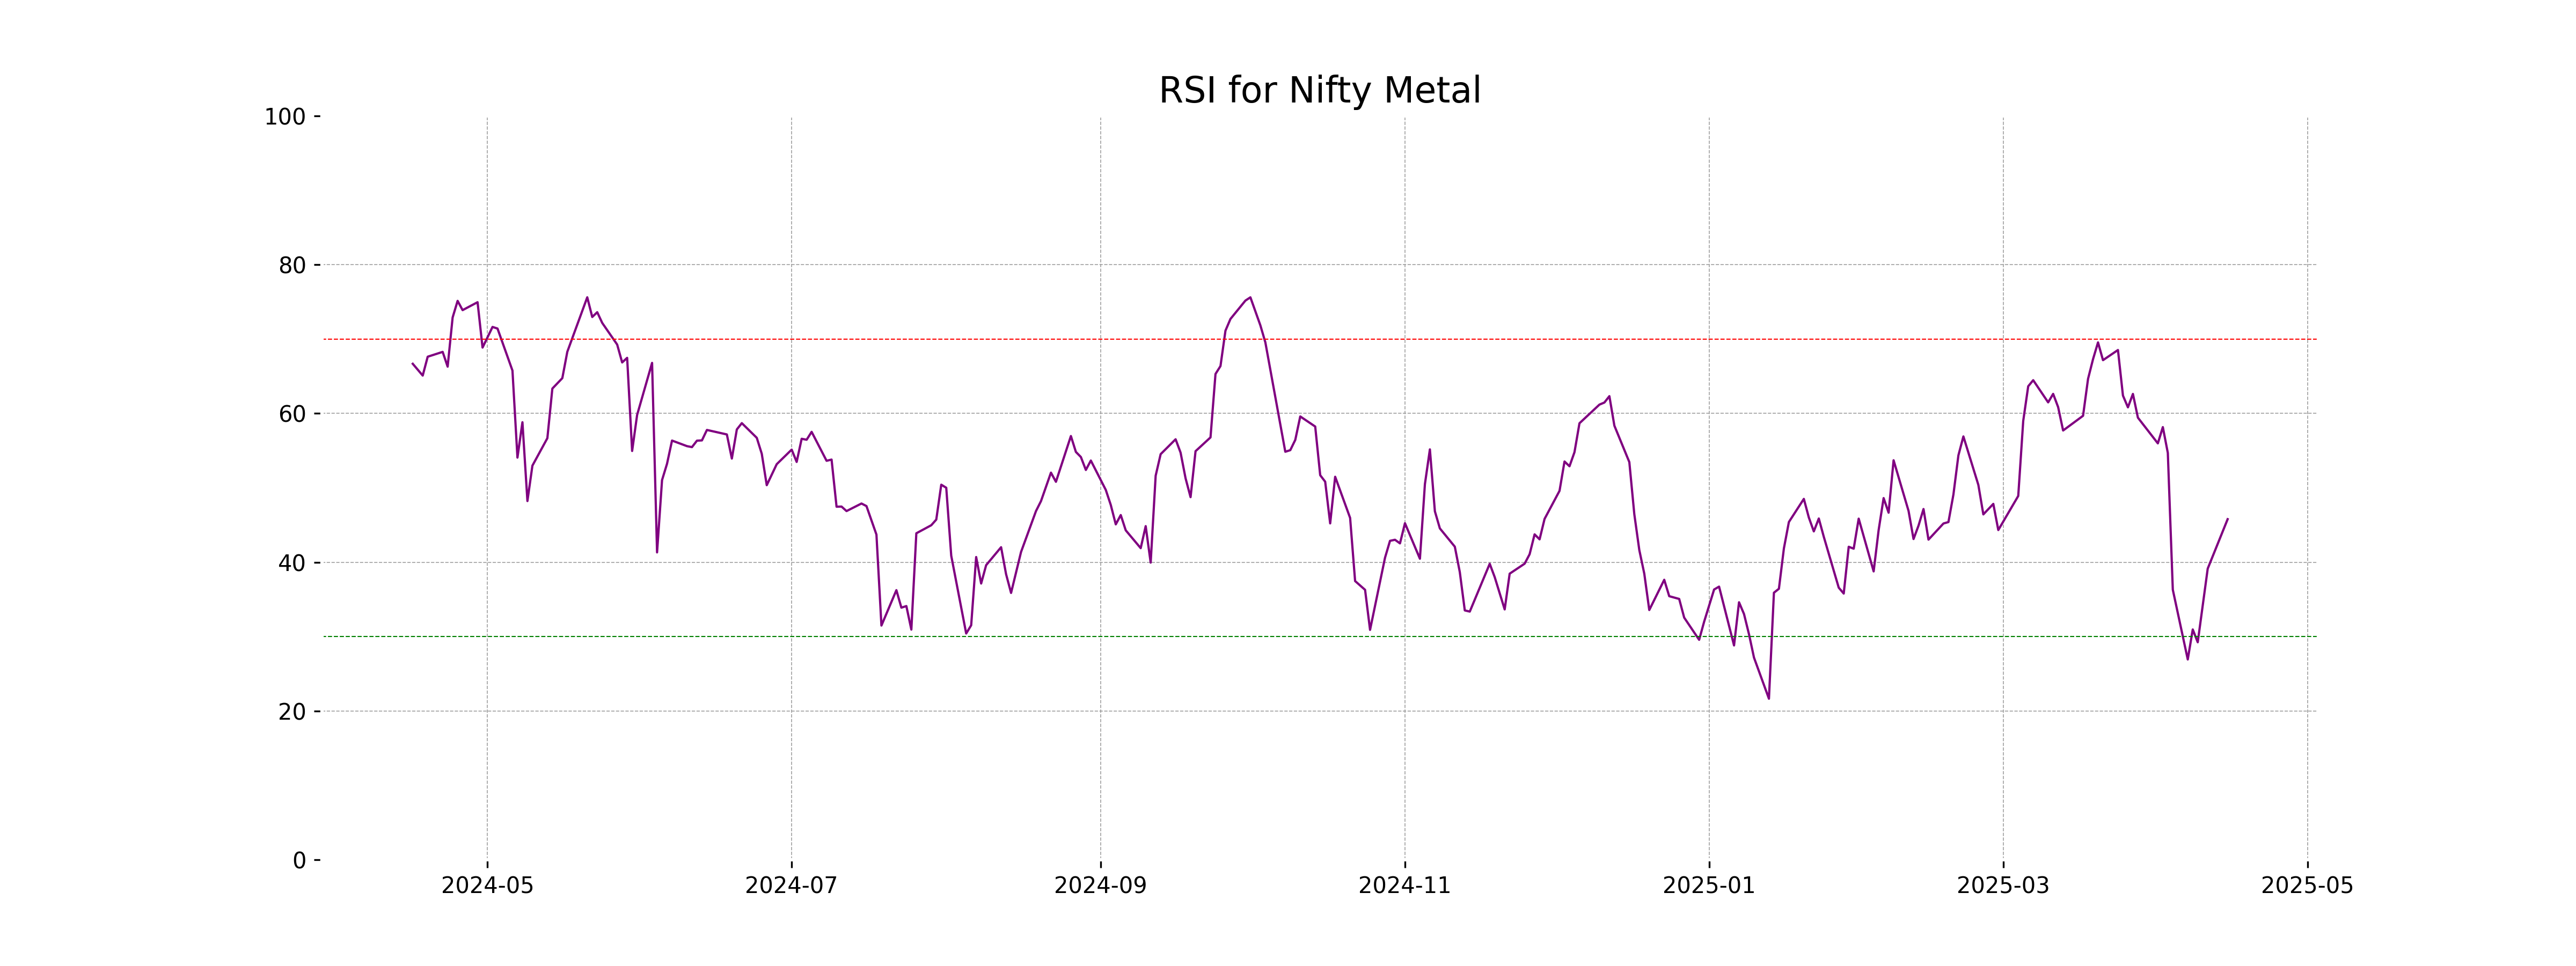
RSI Analysis
Based on the data provided, the RSI for Nifty Metal stands at 45.79. This indicates a neutral momentum, as it is neither in the overbought (above 70) nor in the oversold (below 30) range. It suggests that the index might continue to trade within its current range unless there is a significant change in market conditions.
Analysis for Nifty Bank - April 15, 2025
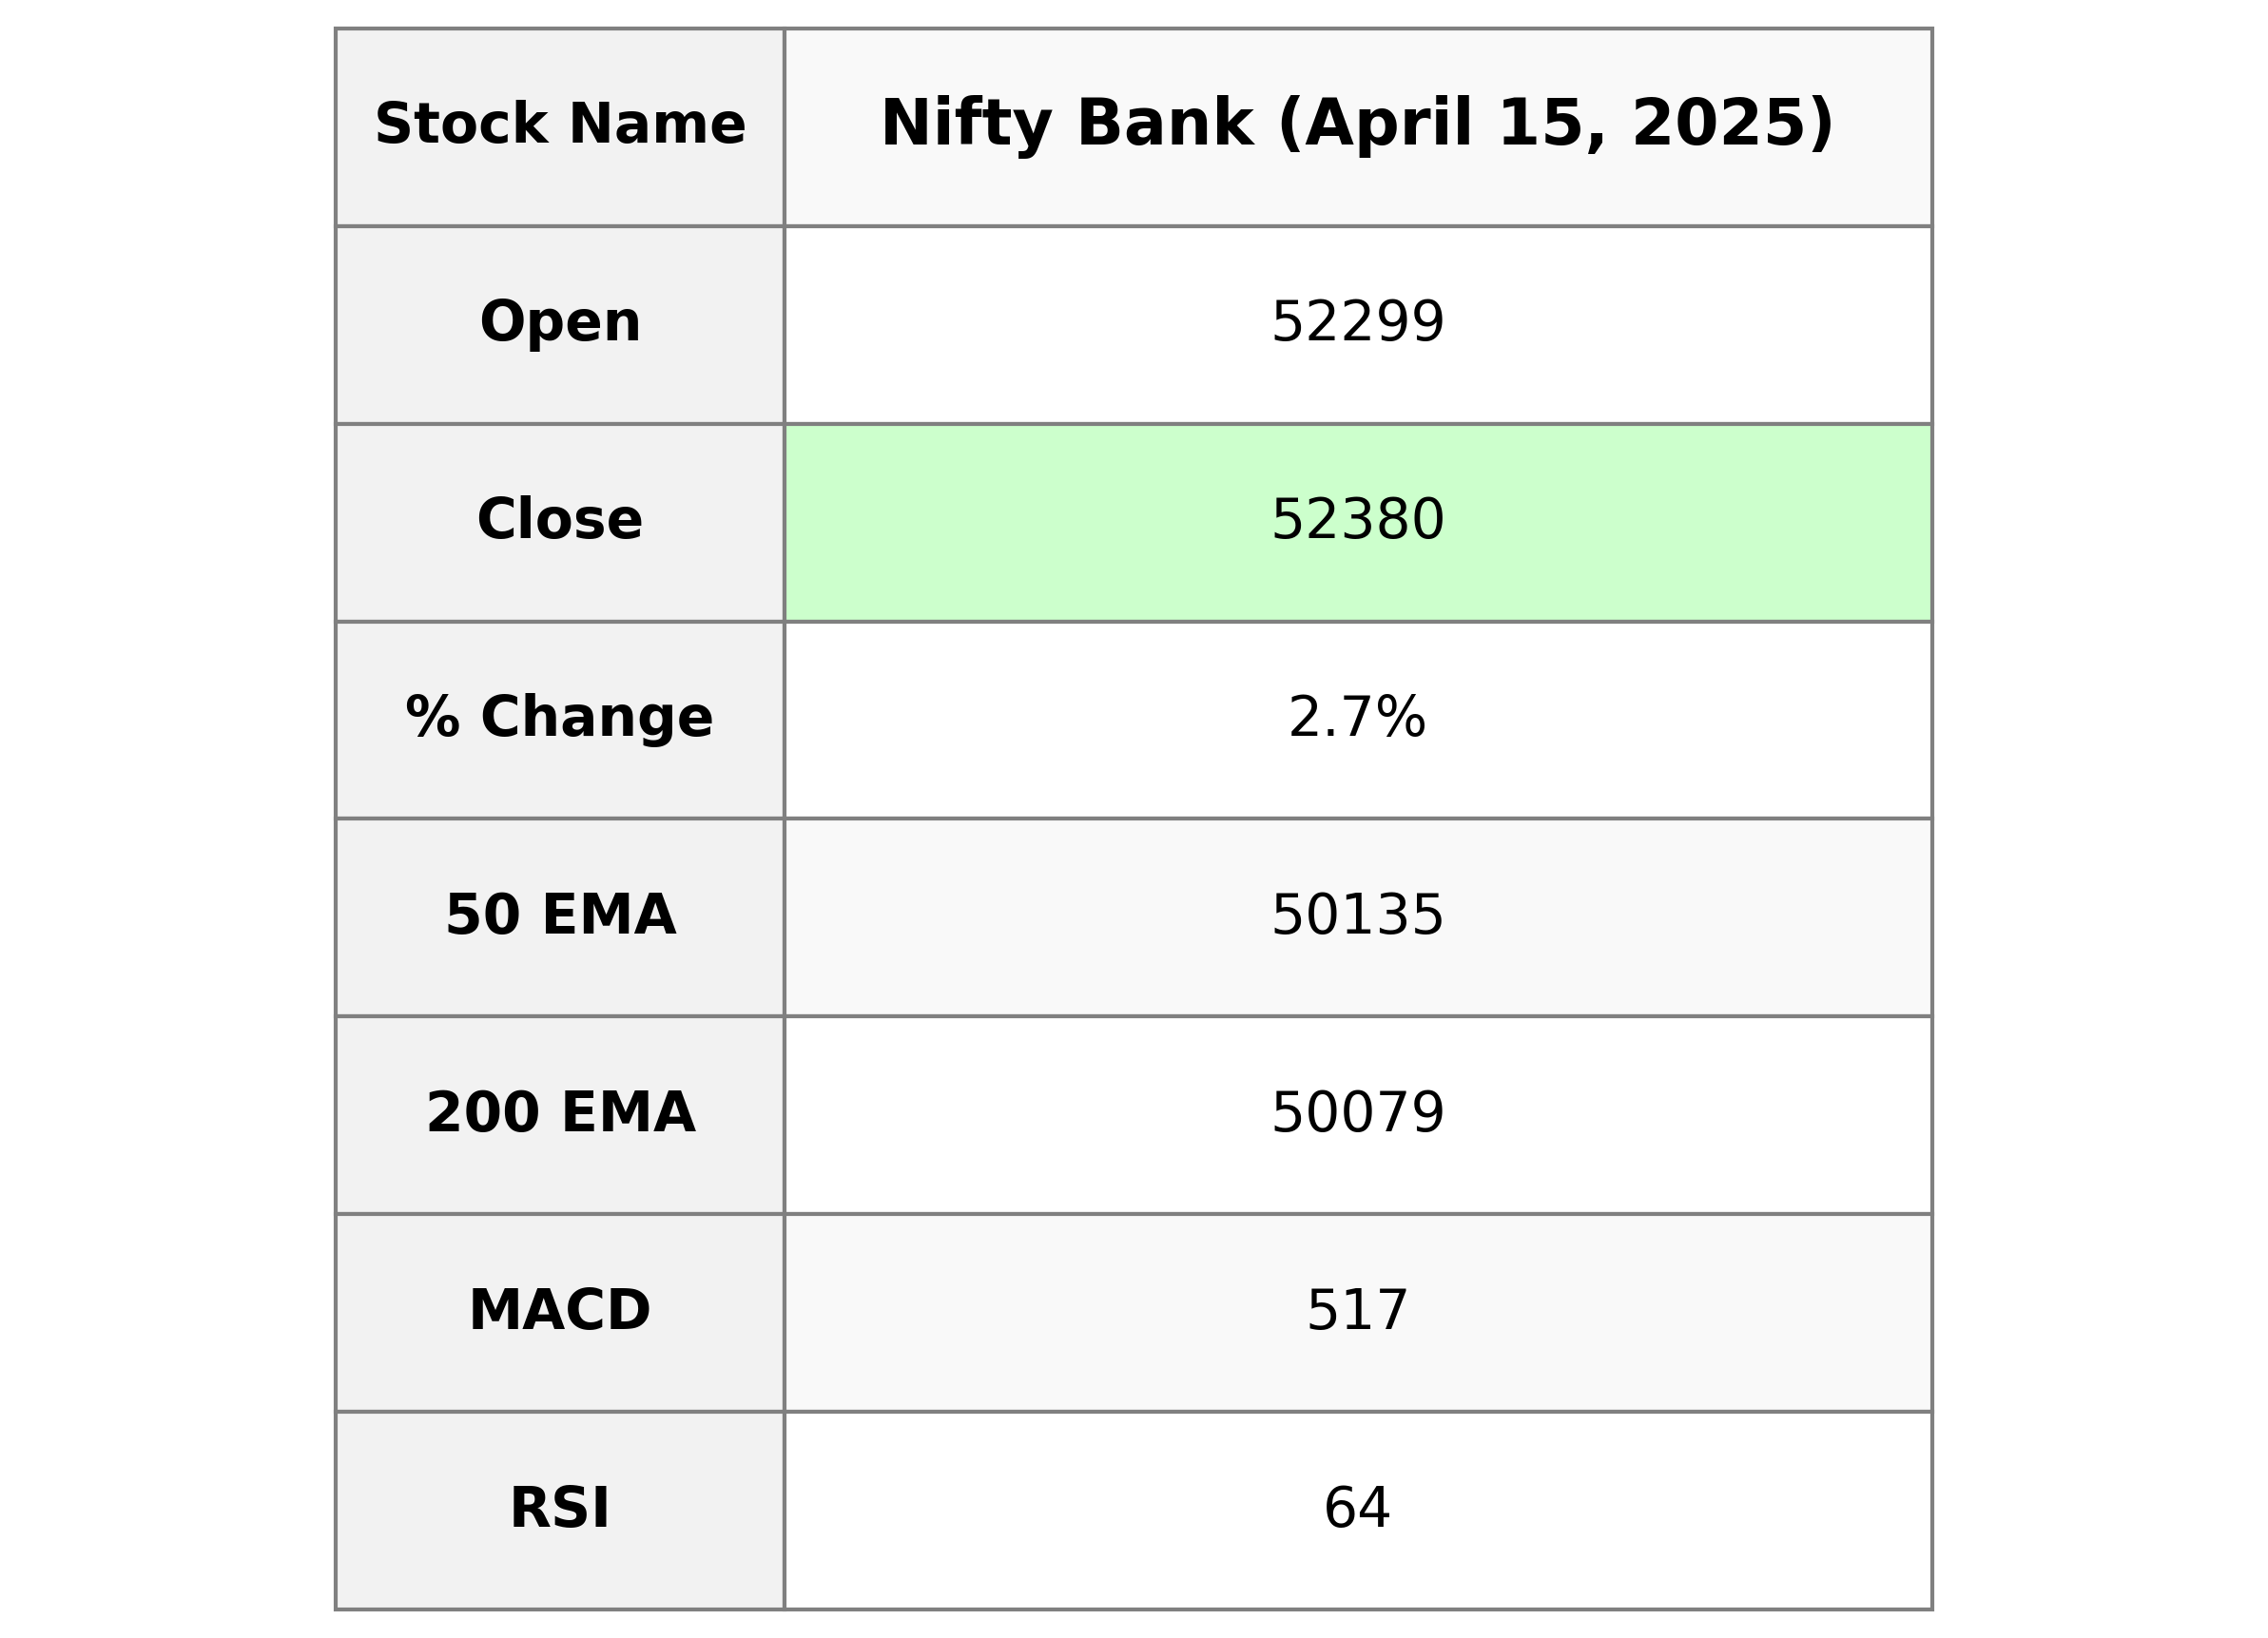
Nifty Bank opened at 52,299.0 and closed significantly higher at 52,379.5, showing a percentage change of 2.70%, with a points increase of 1,377.15 from its previous close of 51,002.35. The day's trading saw a high of 52,486.35 and a low of 51,863.30. The technical indicators reveal bullish momentum with its closing above several moving averages, including the 50 EMA and 200 EMA, and an RSI of 64.20, indicating a possible overbought situation.
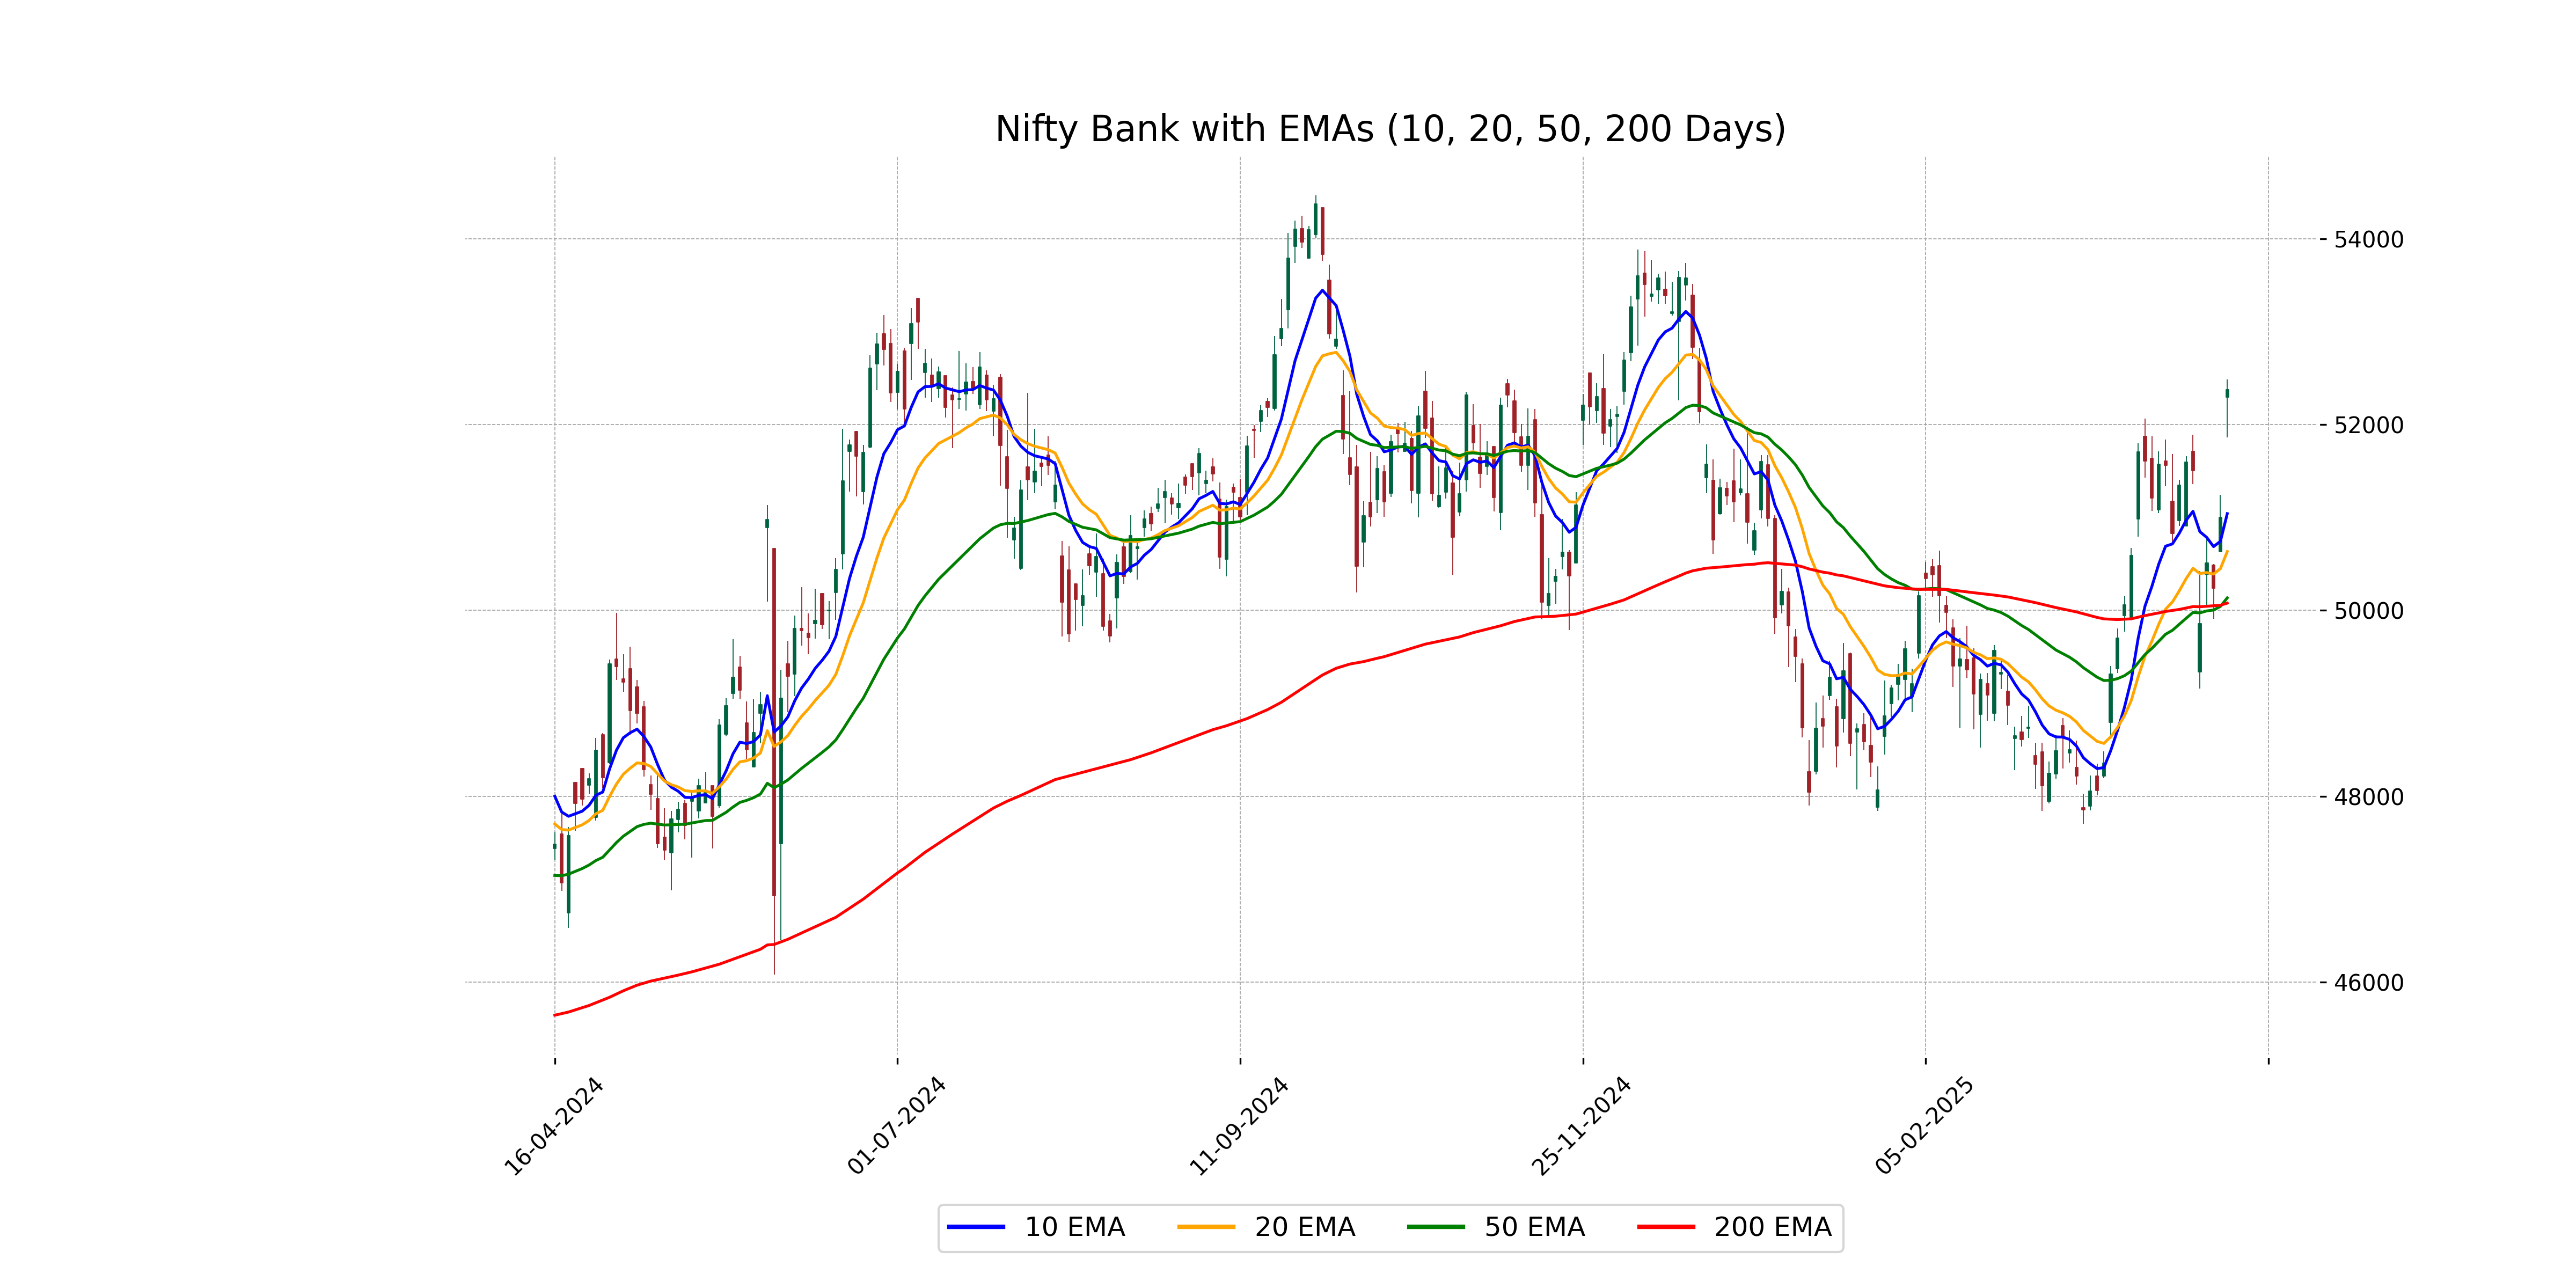
Relationship with Key Moving Averages
The closing price of Nifty Bank at 52,379.5 is above its 50-day EMA (50,134.93) and 200-day EMA (50,078.78), indicating a strong upward trend. Additionally, it is significantly higher than the 10-day EMA (51,041.79) and 20-day EMA (50,633.71), reflecting short-term bullish momentum.
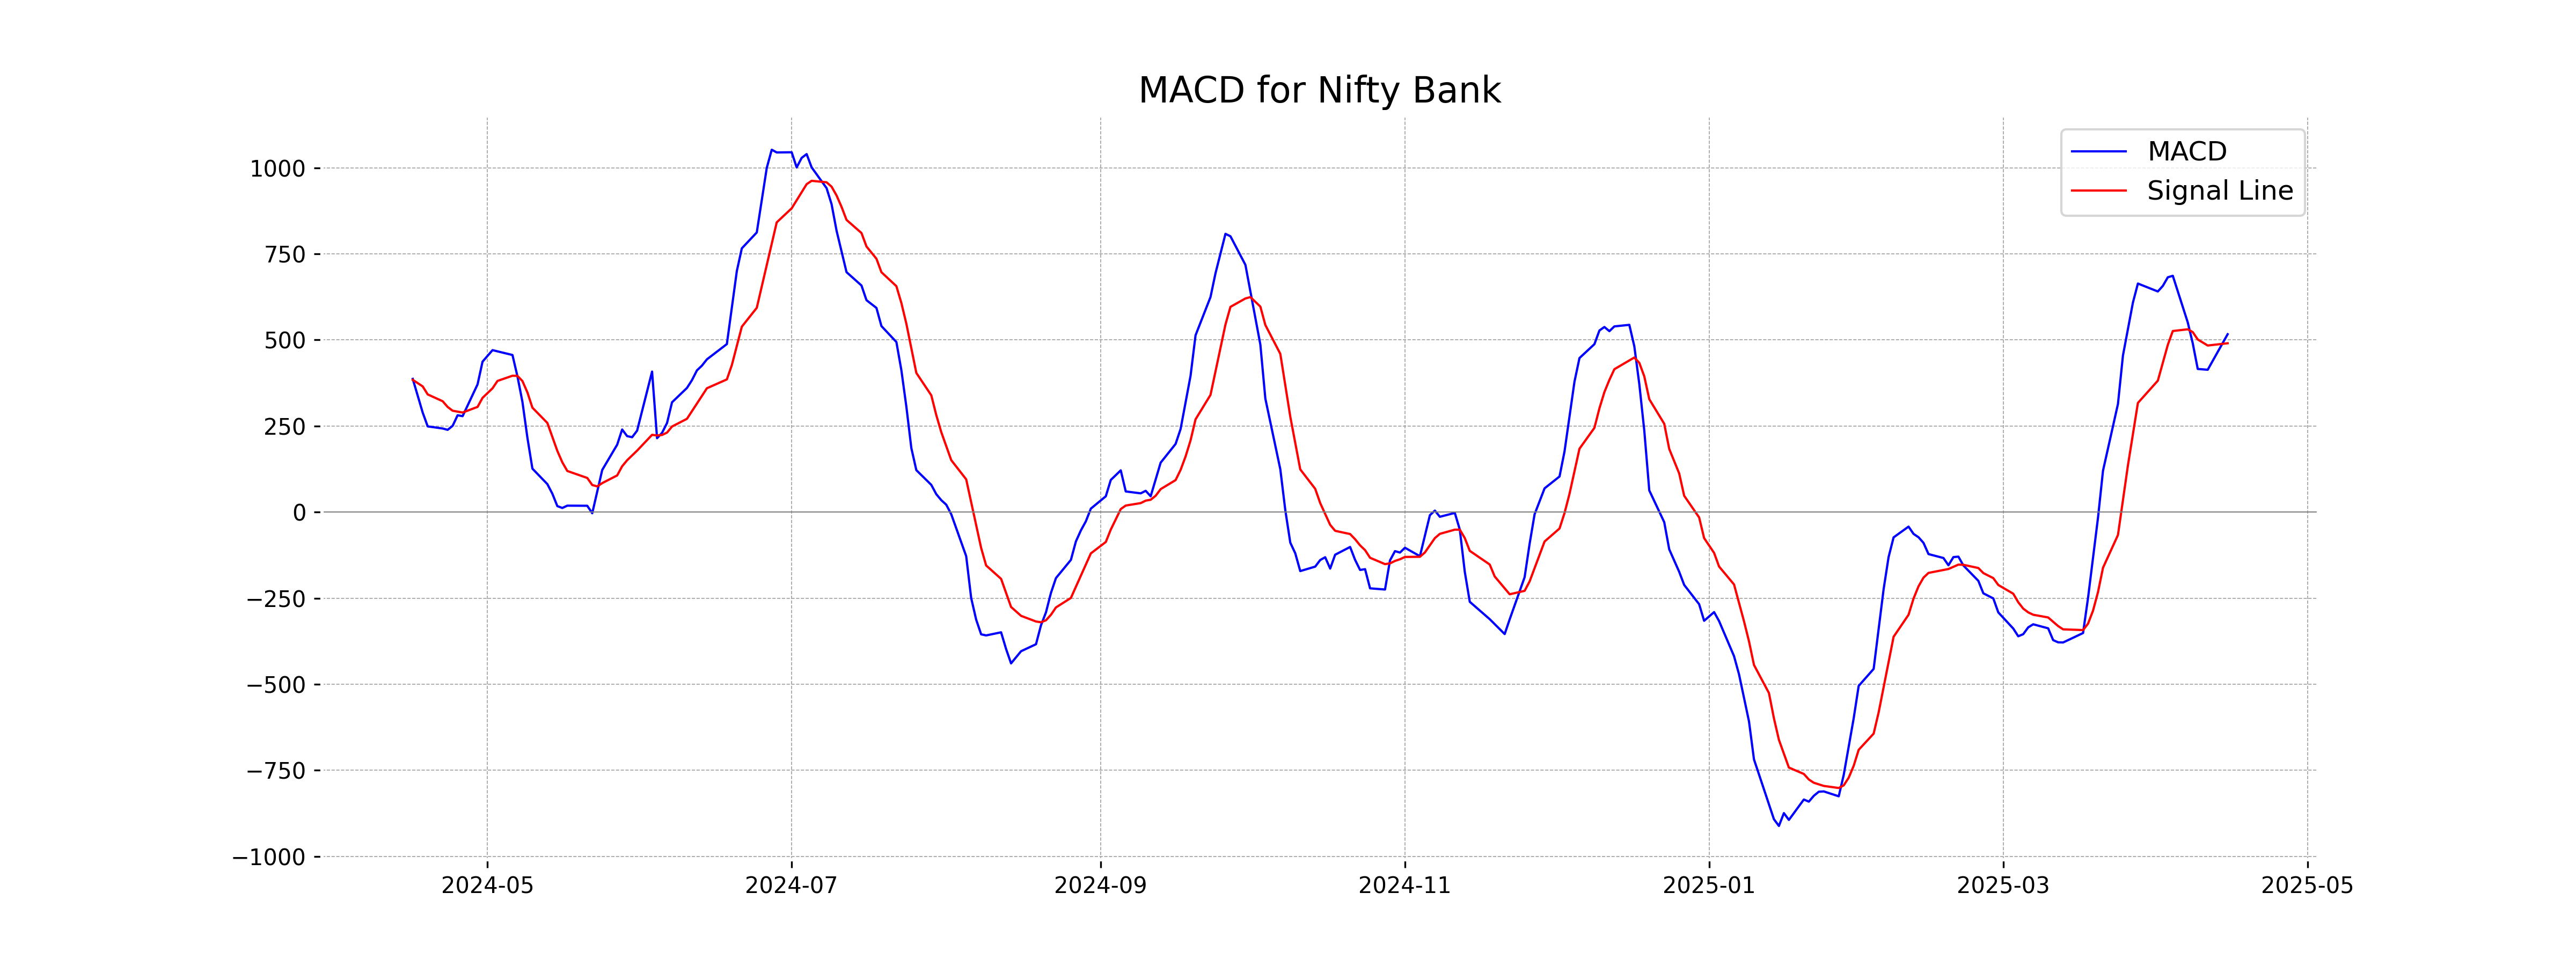
Moving Averages Trend (MACD)
Based on the given data, Nifty Bank's MACD is currently greater than the MACD Signal, with a value of 516.56 compared to 490.24. This indicates a potential bullish trend, suggesting that upward momentum may continue. Additionally, the % change shows a significant positive movement in the stock price, further supporting this bullish signal.
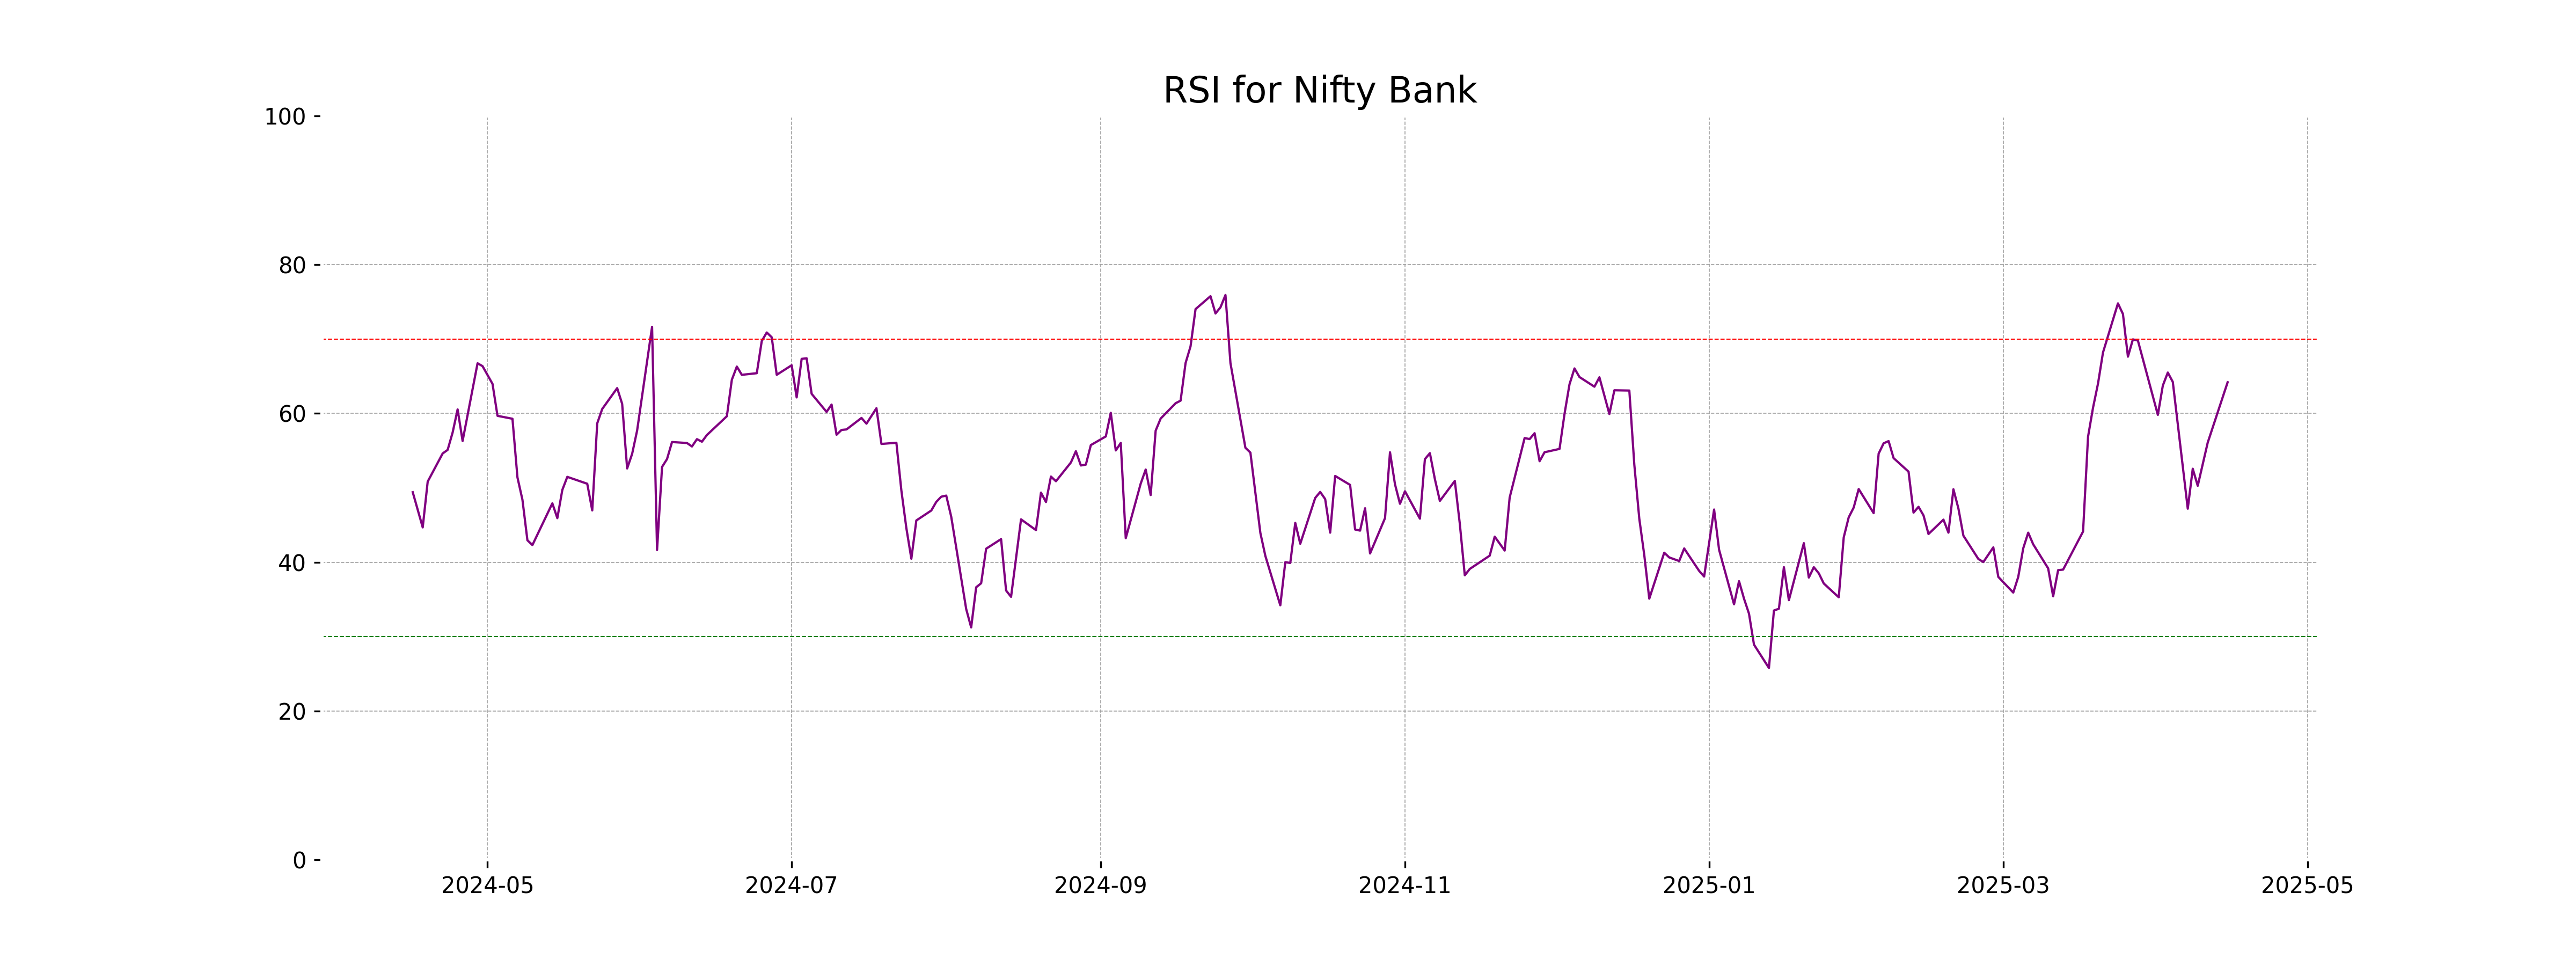
RSI Analysis
The RSI for Nifty Bank is 64.20, indicating it is in a moderately overbought condition. Typically, an RSI above 70 is considered overbought and below 30 is considered oversold. Monitor the RSI trend for possible shifts in market momentum.
Analysis for Nifty 50 - April 15, 2025
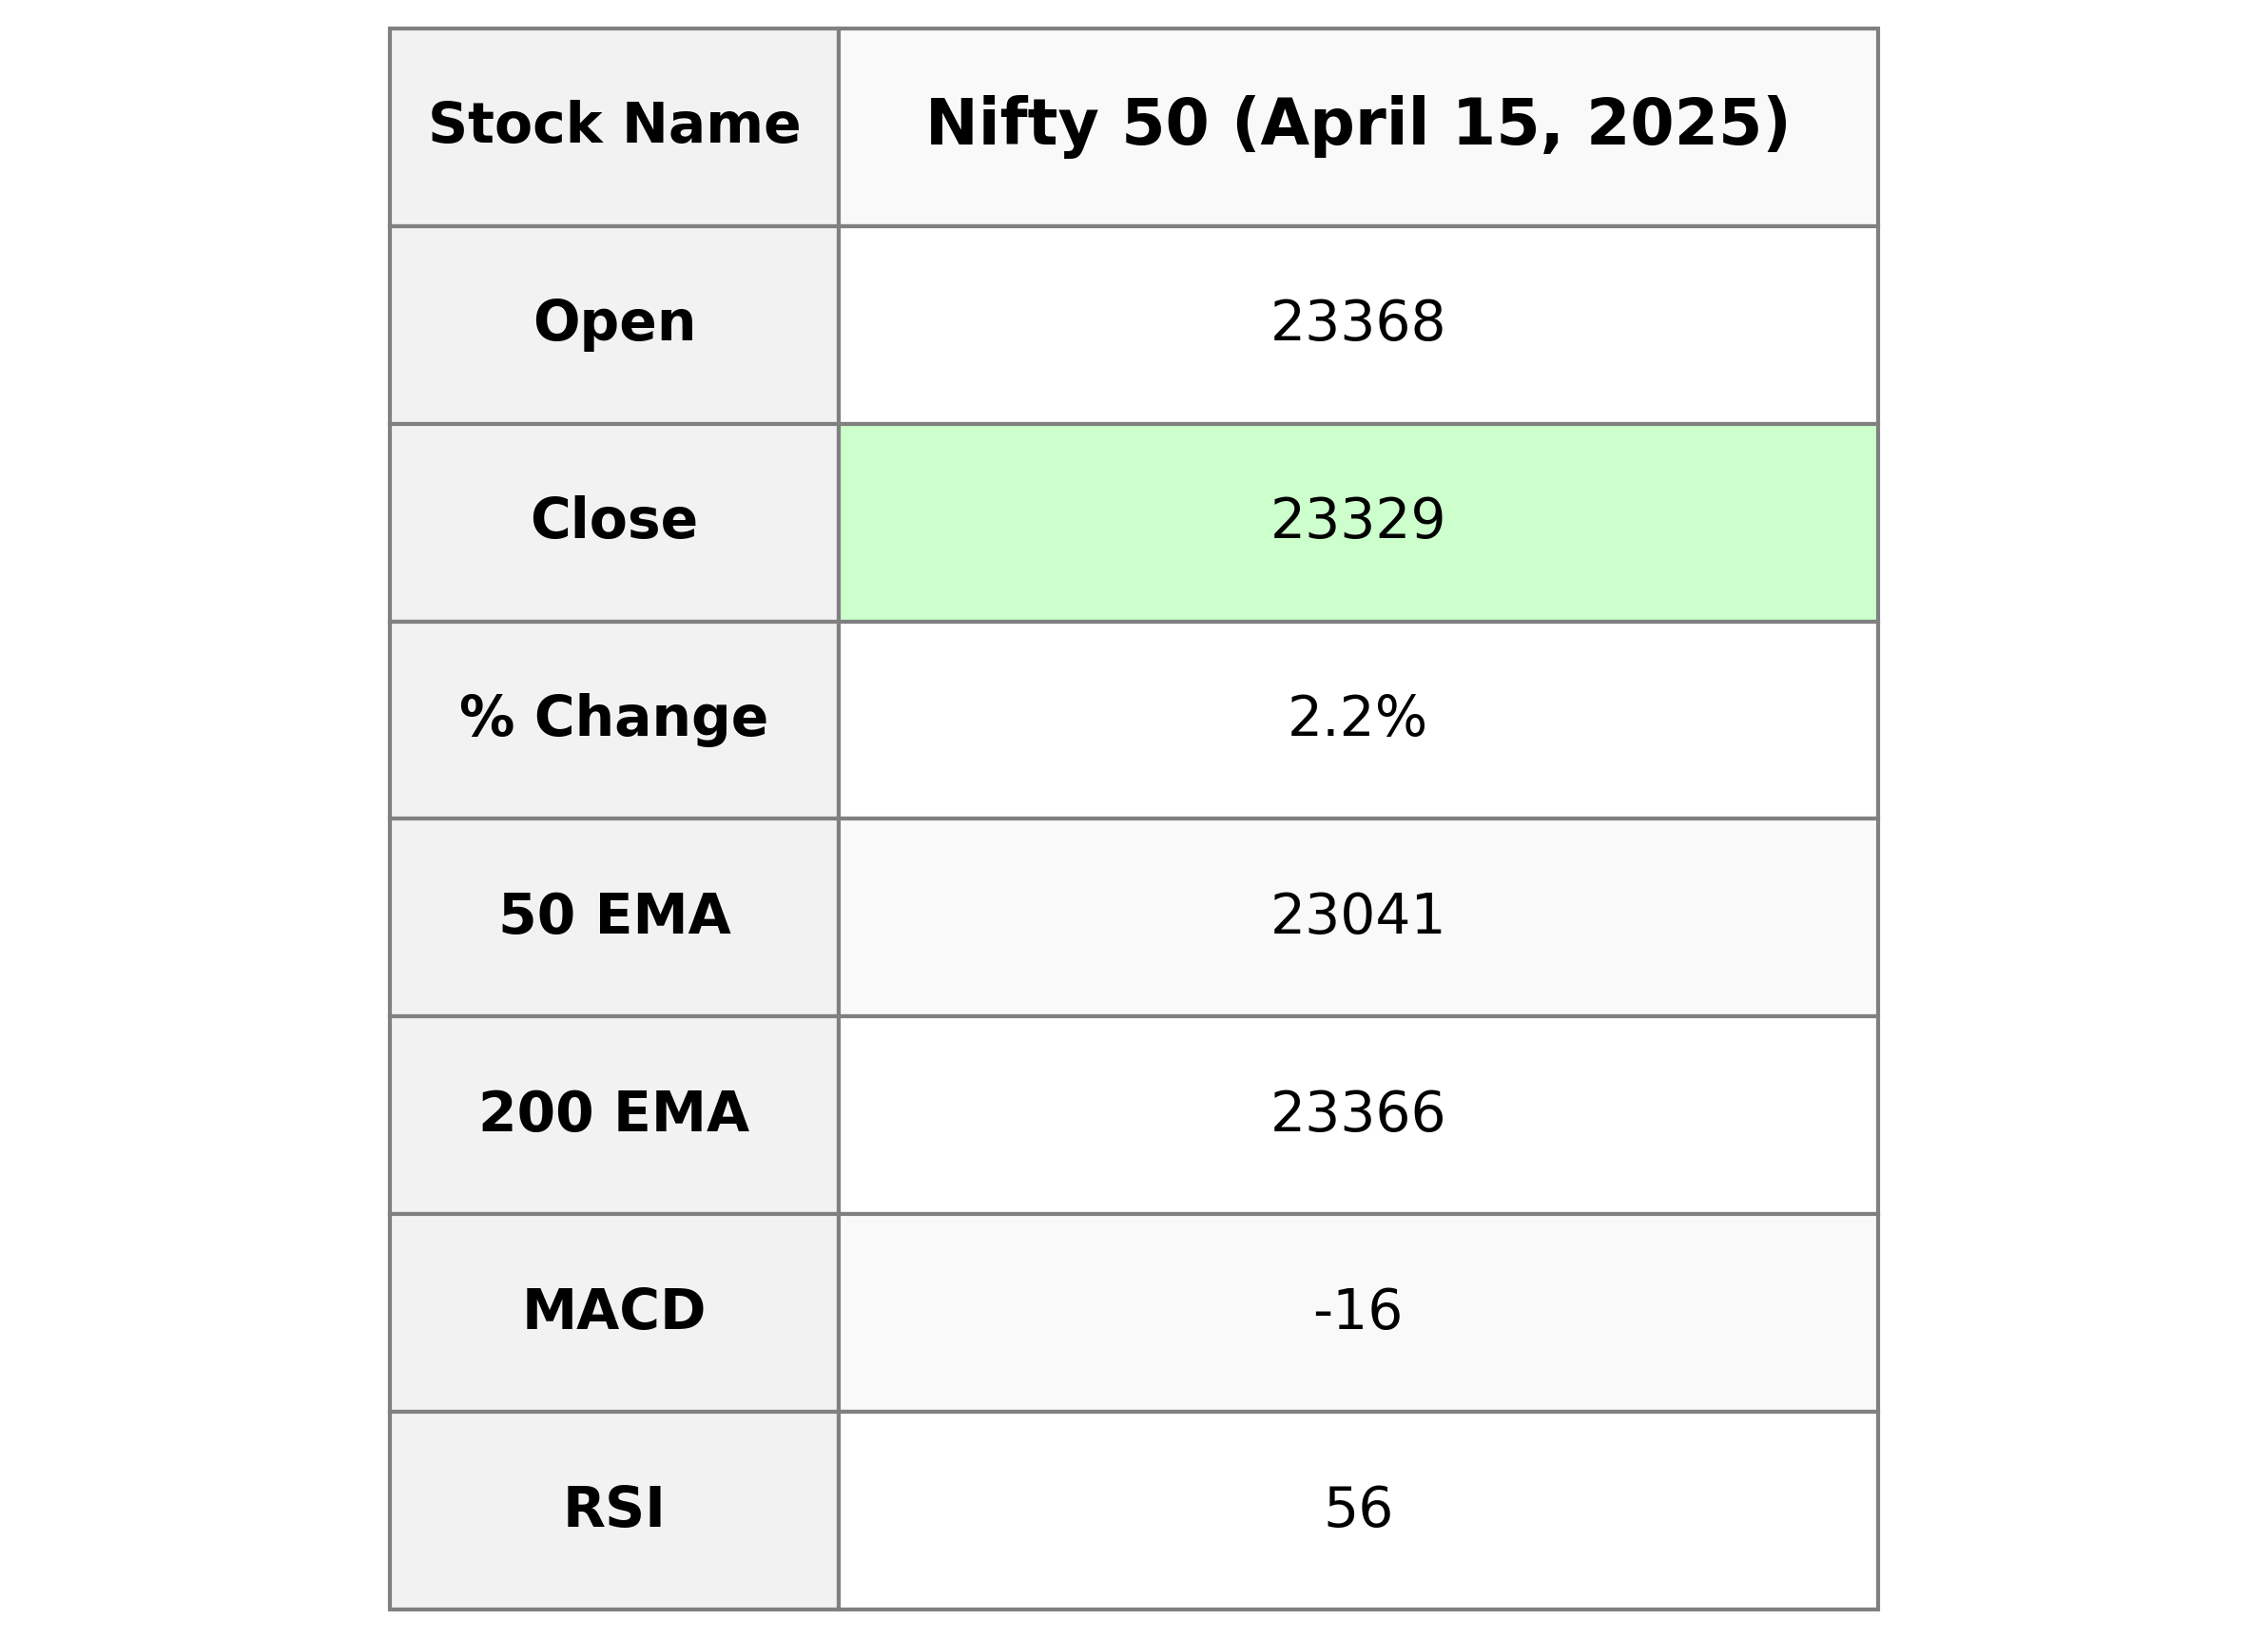
Nifty 50 Performance: The Nifty 50 opened at 23,368.35, reaching a high of the same value and a low of 23,207. It closed at 23,328.55, marking a 2.19% increase with a 500-point change from the previous close of 22,828.55. Key technical indicators show the index is trading above its 10 and 20 EMA but below the 200 EMA. RSI is 55.96, indicating a neutral market tendency, while MACD is -16.22, suggesting bearish momentum.
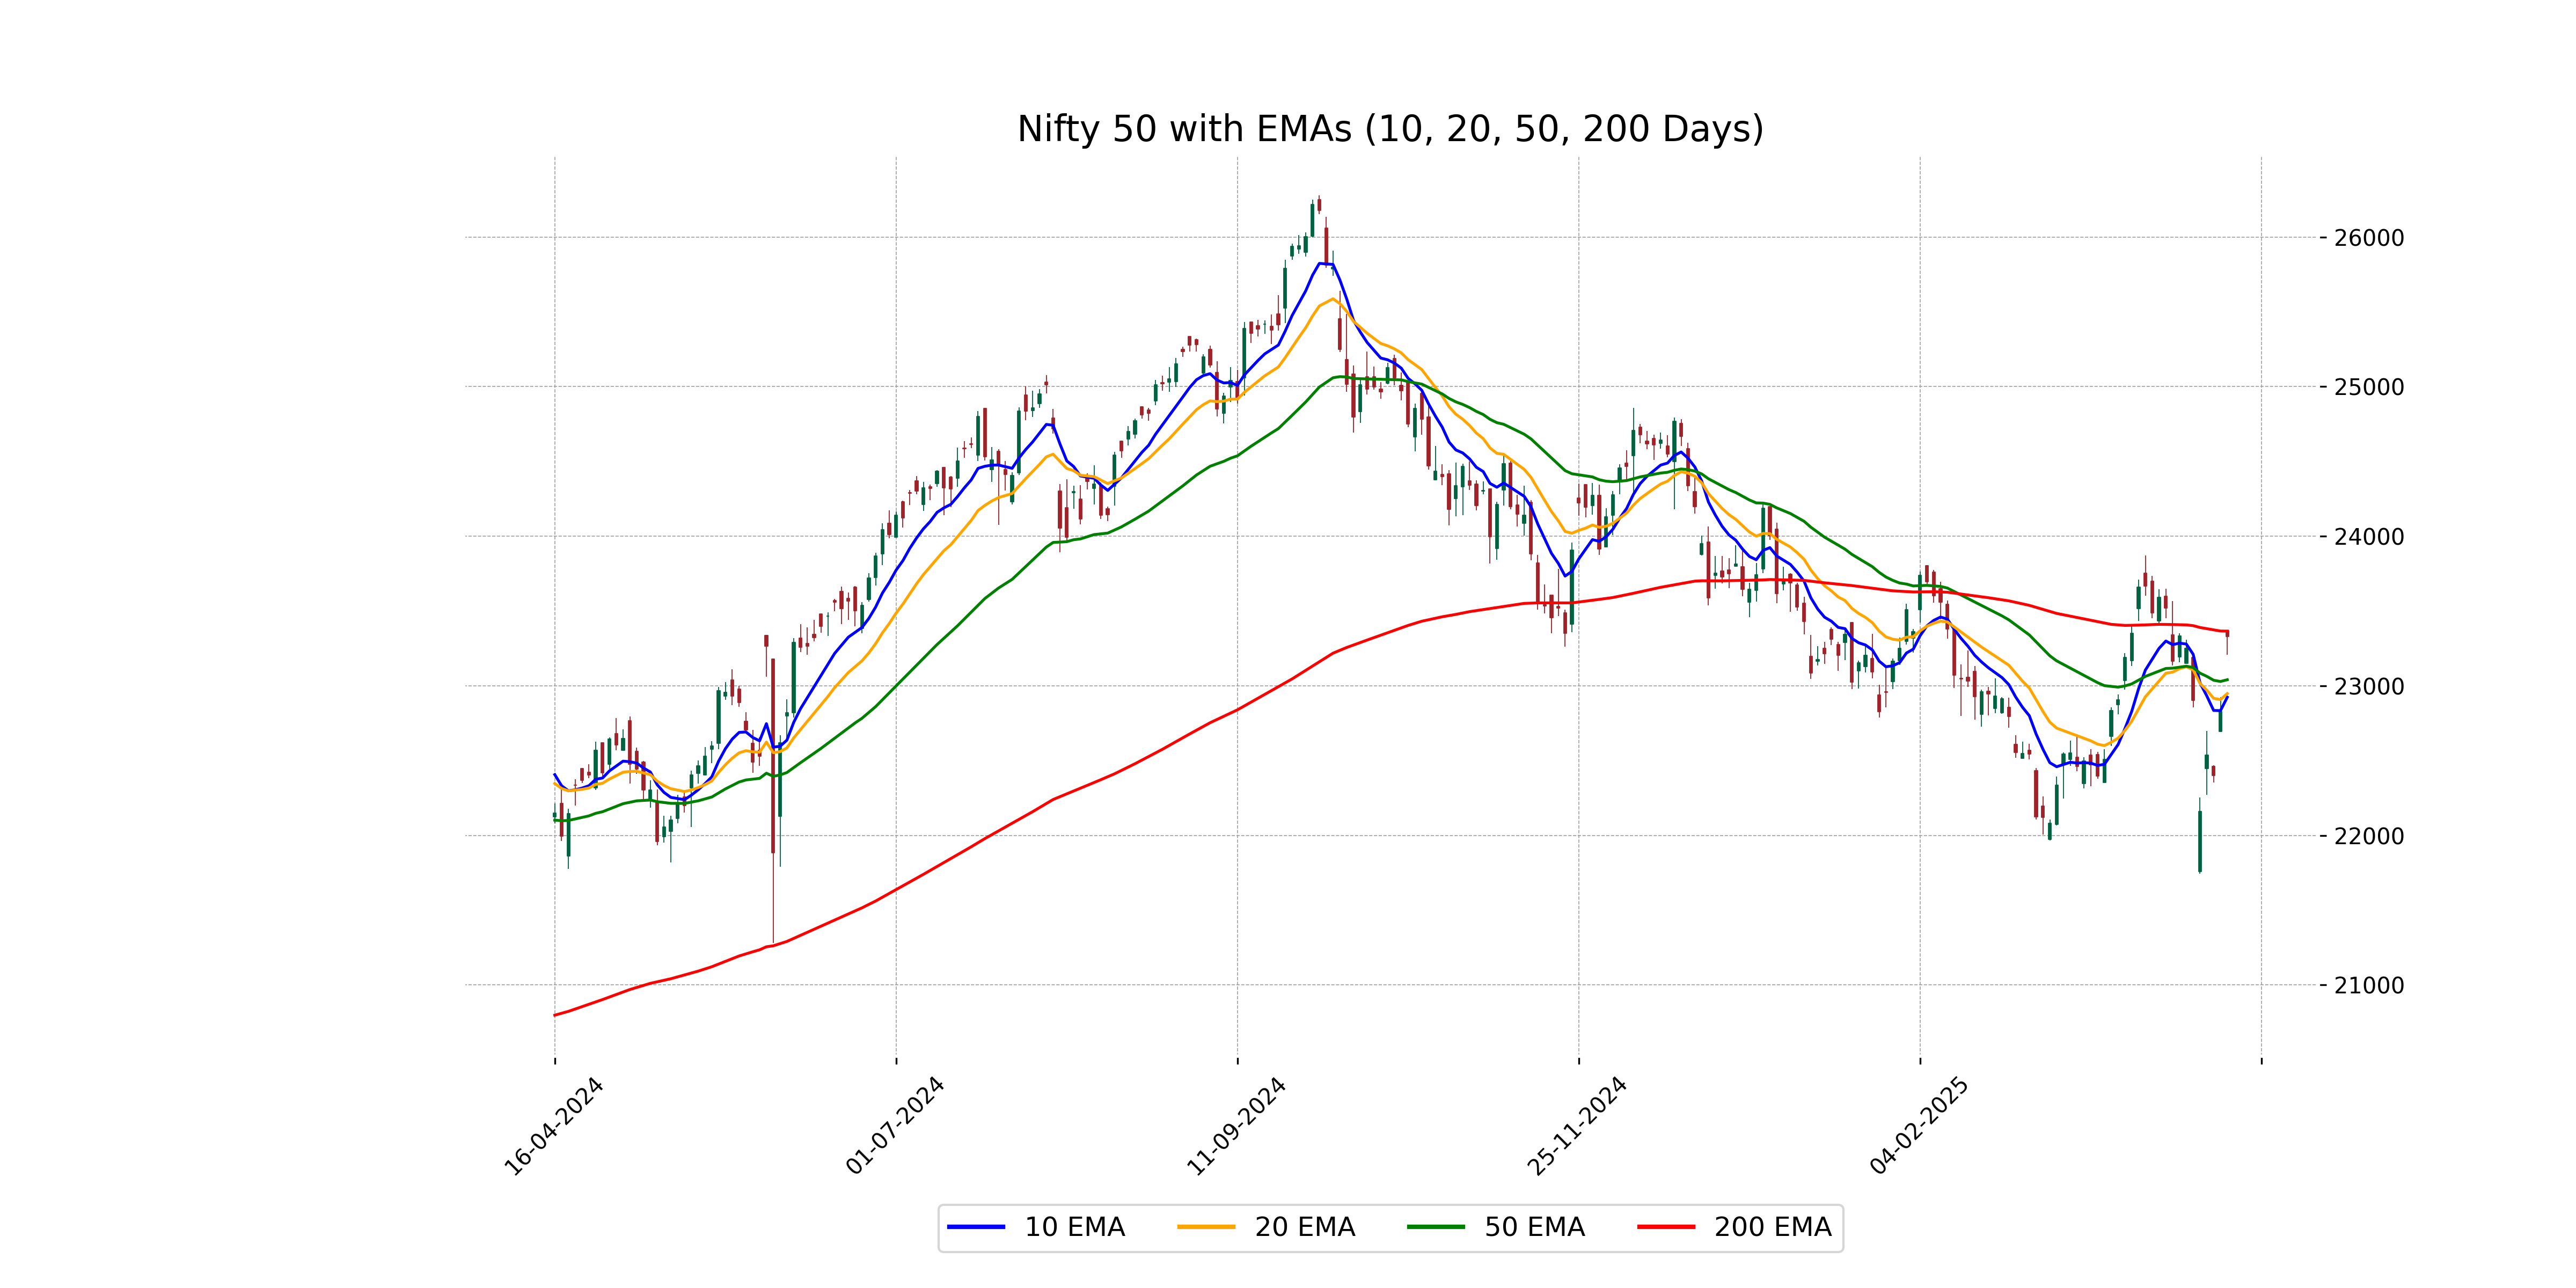
Relationship with Key Moving Averages
For Nifty 50, the closing price of 23,328.55 is above the 50-day EMA of 23,040.62, which suggests a short-term uptrend. However, it is slightly below the 200-day EMA of 23,365.70, indicating a potential long-term bearish sentiment. The stock is also above both the 10-day EMA of 22,923.90 and the 20-day EMA of 22,947.86, suggesting strength over shorter time frames.
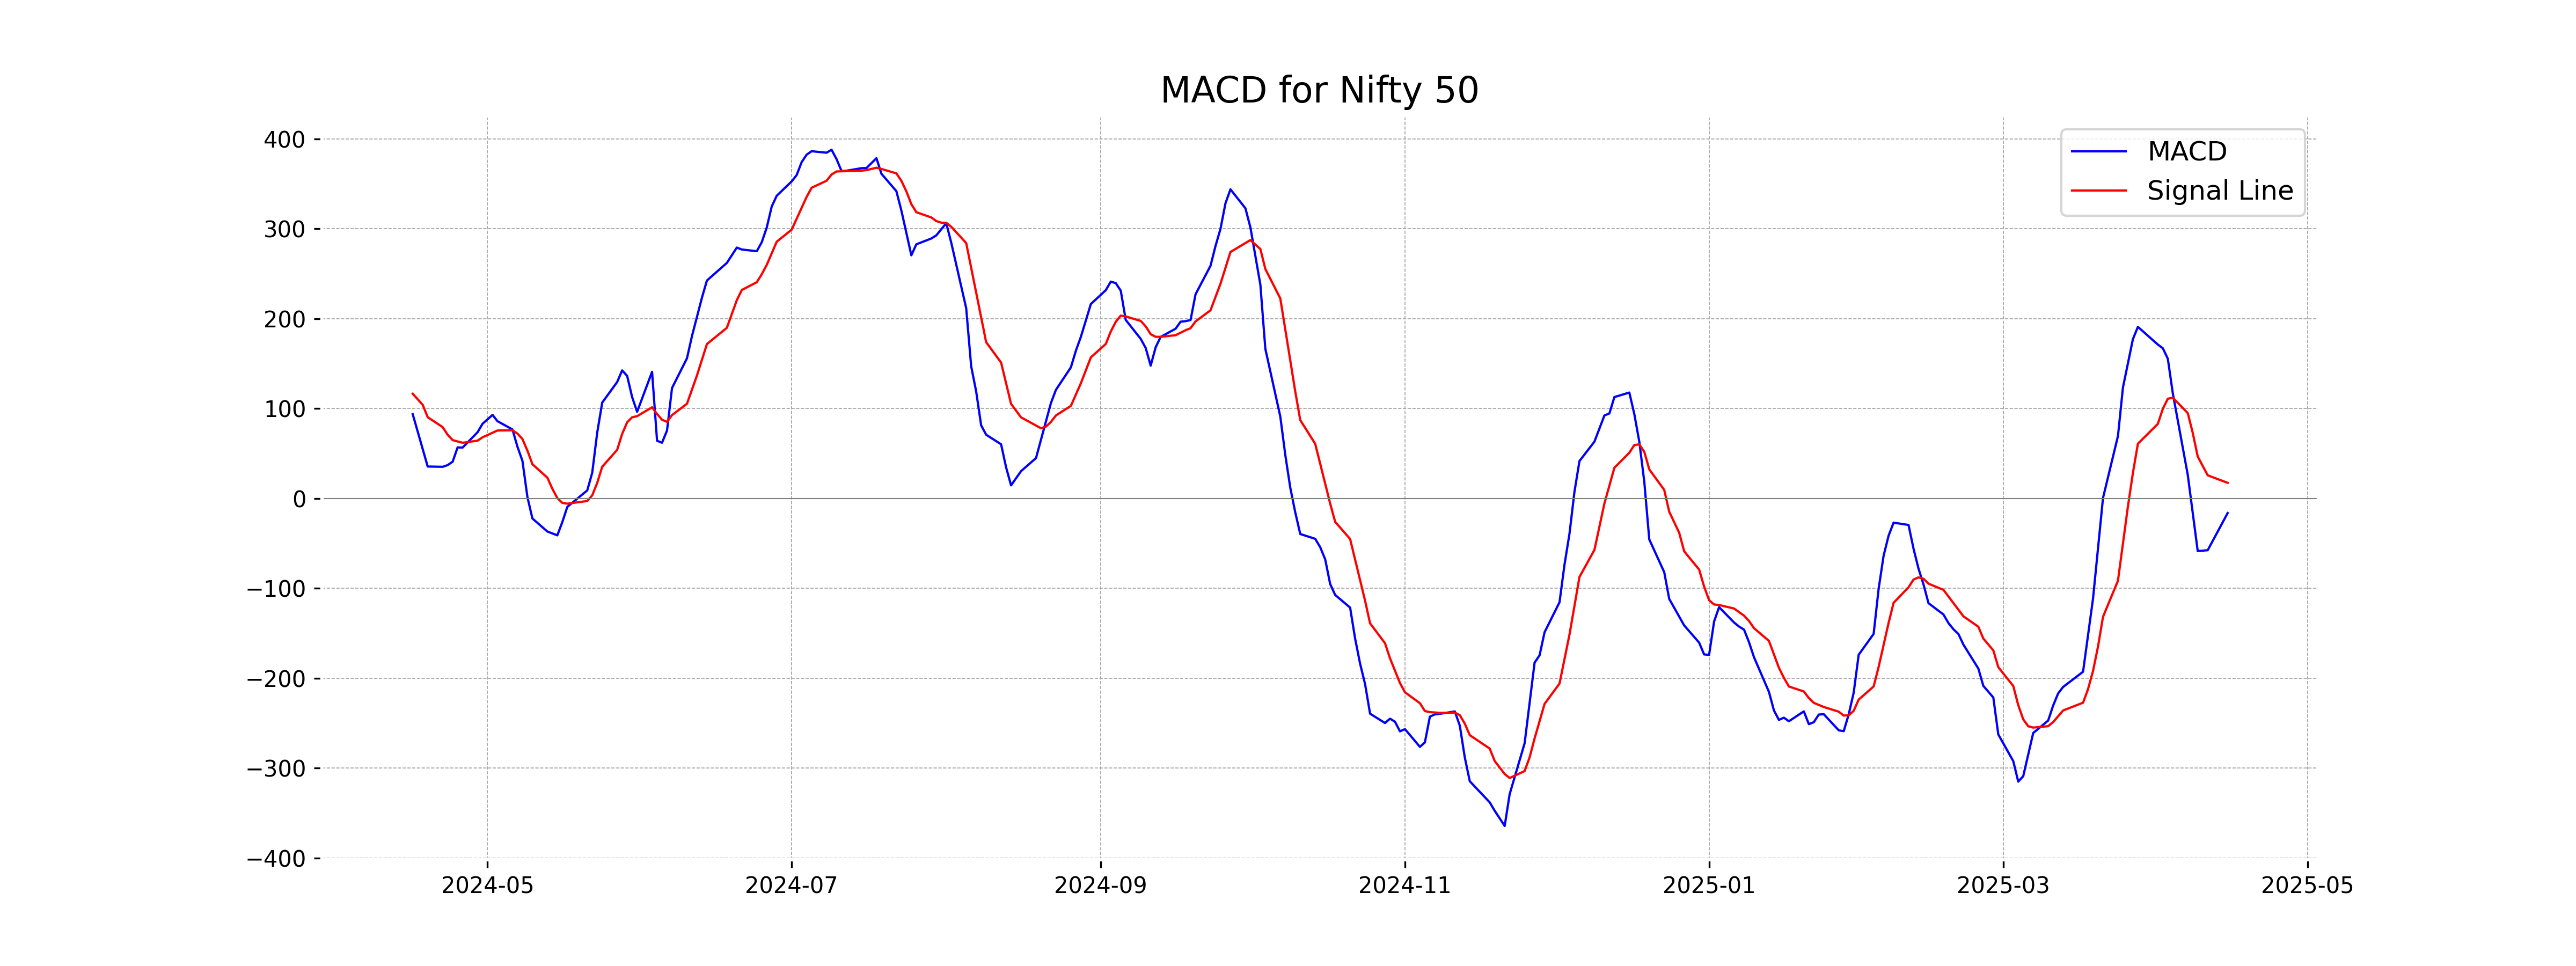
Moving Averages Trend (MACD)
The MACD value for Nifty 50 is -16.22, indicating a bearish signal as it's below the MACD signal line of 17.39. This suggests a potential for continued downward momentum in the short term.
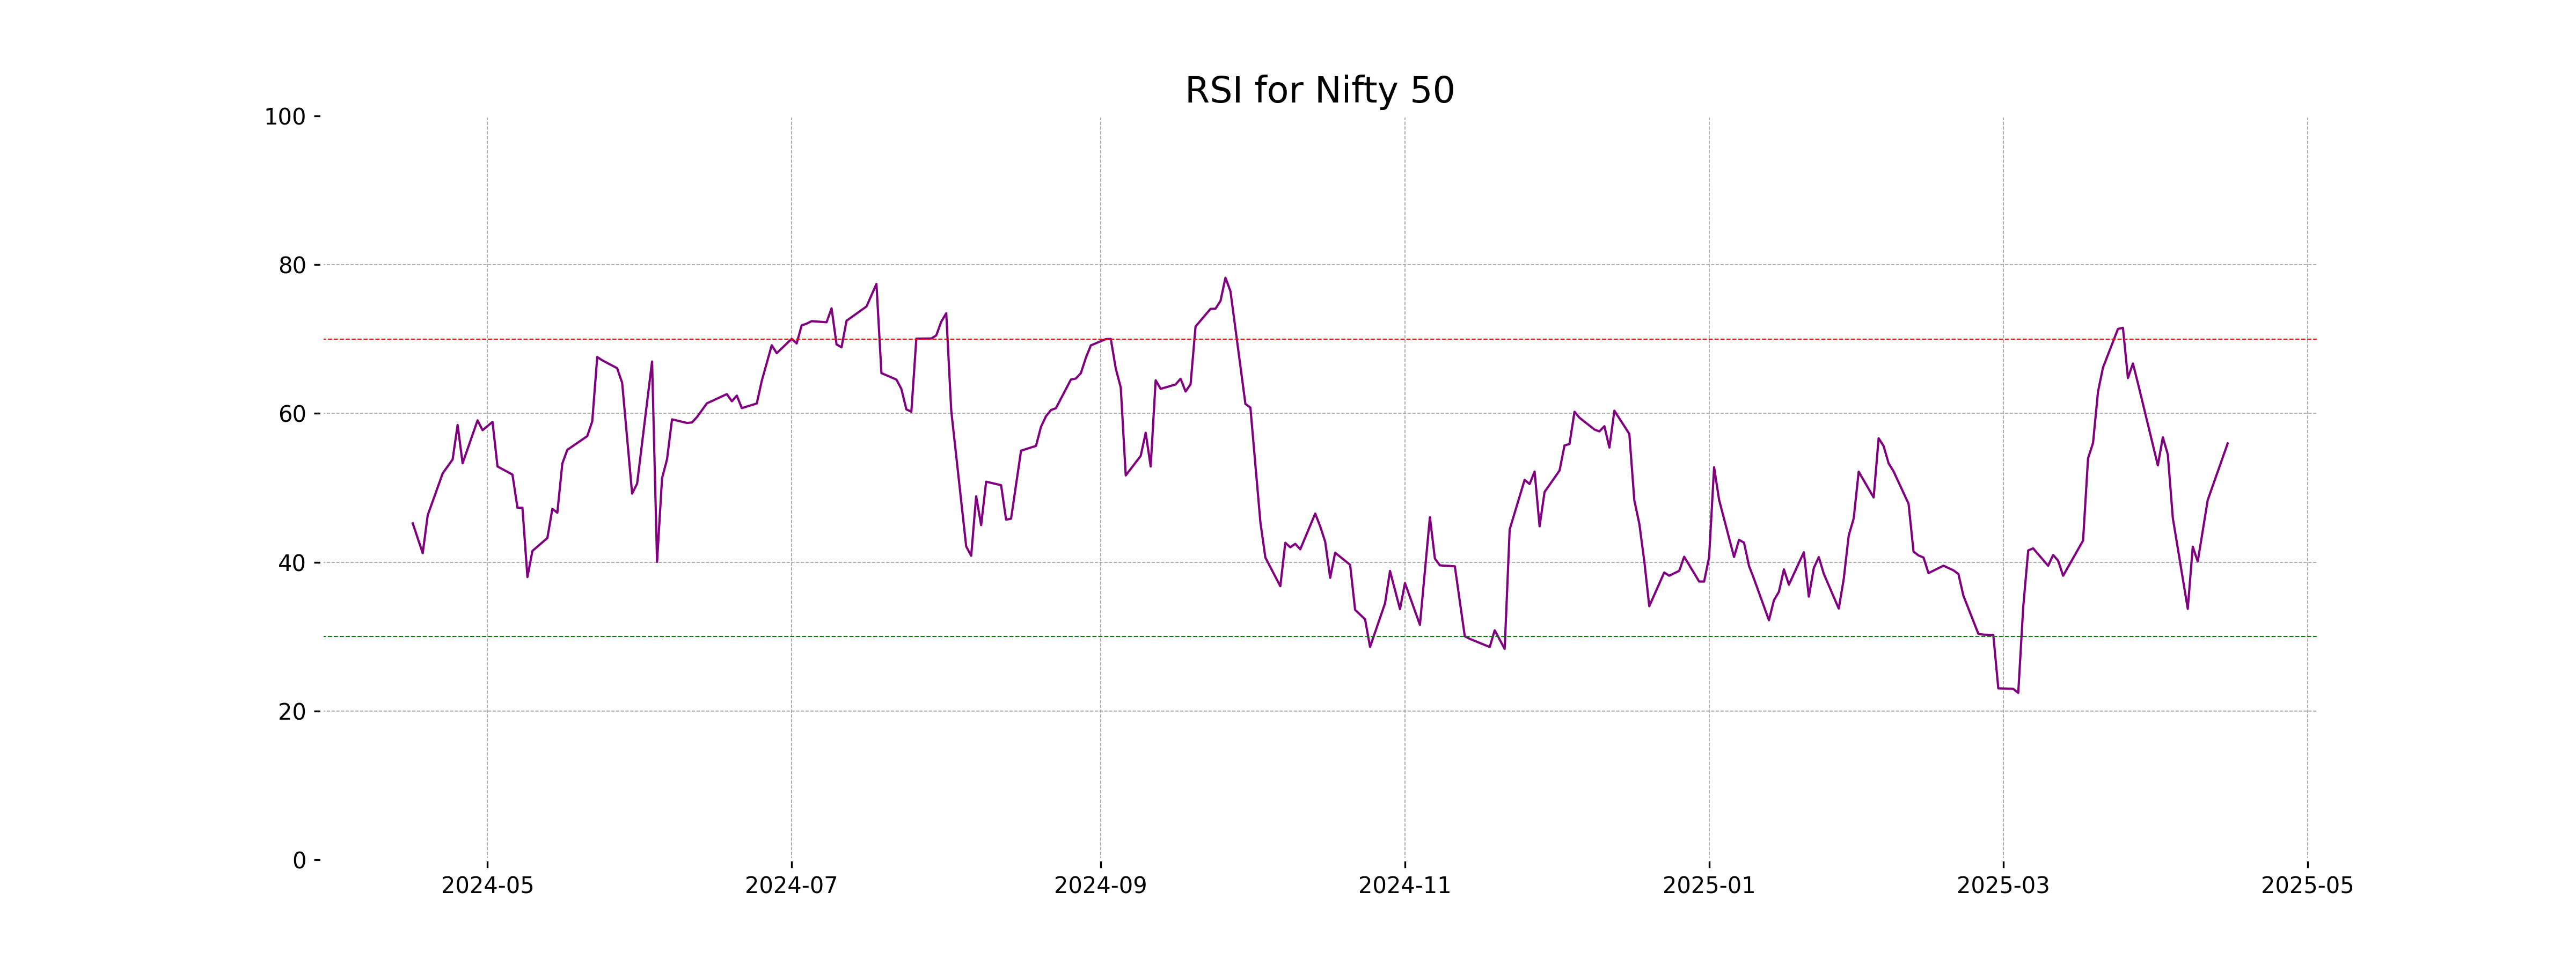
RSI Analysis
The Relative Strength Index (RSI) for Nifty 50 is 55.96, which indicates that the market is in a neutral zone. An RSI value between 30 and 70 suggests that the stock is neither overbought nor oversold, providing no strong momentum in either direction.
Up Next

Indian Stock Market Sector-wise Performance: Which Sector is performed Well Today - April 15, 2025

Rupee breaches 91-mark against US dollar for first time in intra-day trade

Microsoft commits USD 17.5 billion investment in India: CEO Satya Nadella

CBI books Anil Ambani's son, Reliance Home Finance Ltd. in Rs 228 crore bank fraud case

RBI raises FY26 GDP growth projection to 7.3 pc

RBI trims policy interest rate by 25bps to 5.25pc, loans to get cheaper

More videos

Rupee slumps to all-time low of 90.25 against US dollar in intra-day trade

Reliance completes merger of Star Television Productions with Jiostar

India to lead emerging market growth with 7pc GDP rise in 2025: Moody’s

Nifty hits record high after 14 months; Sensex nears all-time peak

Reliance stops Russian oil use at its only-for-export refinery to comply with EU sanctions

ED attaches fresh assets worth over Rs 1,400 cr in case against Anil Ambani's Reliance Group

India signs one-year deal to import 2.2 million tonnes of LPG from US

India International Trade Fair begins at Pragati Maidan amid tight security

Stock markets decline in initial trade on foreign fund outflows, weak Asian peers

Amazon to lay off 30,000 office workers amid AI-driven cost cuts