


Highlights
- Hero MotoCorp, IndusInd Bank post strong rallies
- Power Grid enters overbought zone, signals caution
- Tech Mahindra, Trent show mixed momentum trends
Latest news

Steve Smith aiming for a Boxing Day return after being ruled out of 3rd Ashes test

EAM Jaishankar holds talks with Israel PM Netanyahu on deepening bilateral ties

UP govt launches book on 8 years of state under CM Adityanath

Karan Johar’s ‘Homebound’ shortlisted for 98th Oscars International Feature category

India, Ethiopia elevate ties to strategic partnership as PM Modi holds talks with his counterpart

PM Modi conferred Ethiopia’s highest civilian honour in Addis Ababa

IPL 2026 auction wrap: Complete team squads and salary details

Trump imposes full travel bans on seven more countries, Palestinians
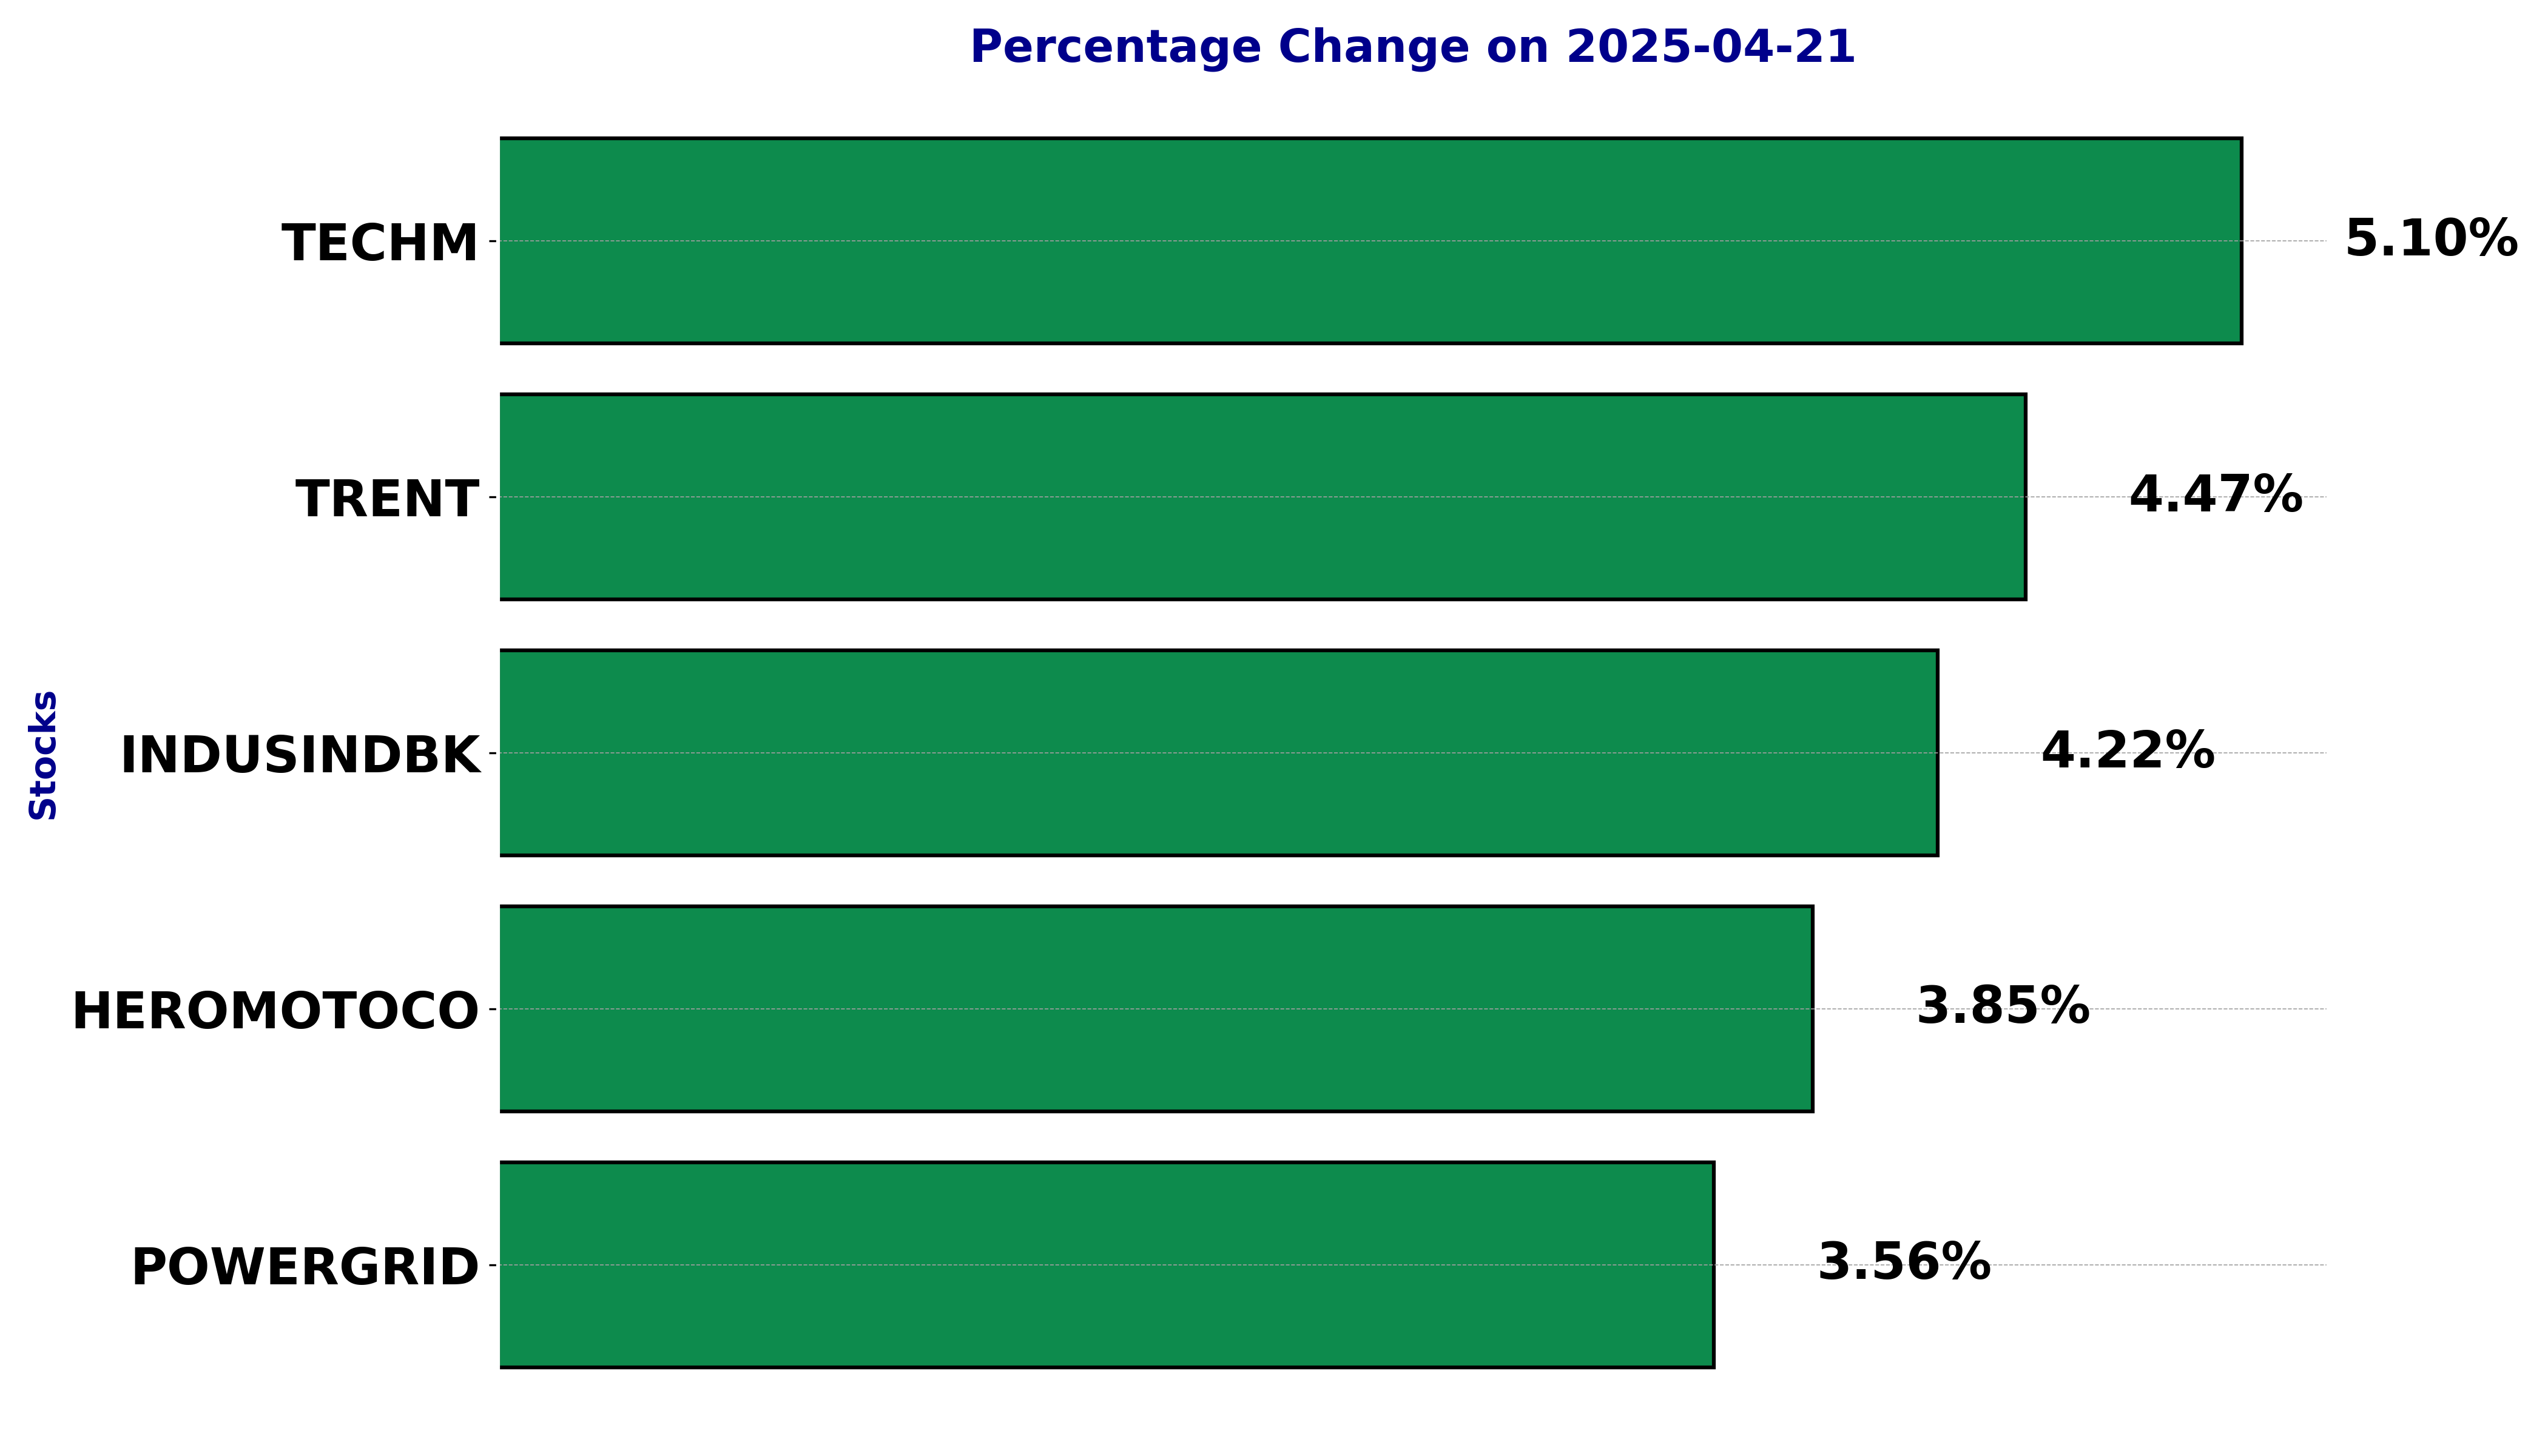
Top 5 Nifty 50 gainers today – April 21, 2025: Biggest stock moves


In this article, we will explore the technical indicators of some of the high-performing stocks on the Indian stock market, including HEROMOTOCO, INDUSINDBK, POWERGRID, TECHM, and TRENT.
By looking at these stocks through the lens of key technical factors, we aim to better understand their price movements, trends, and potential future performance.
Analysis for Hero MotoCorp - April 21, 2025
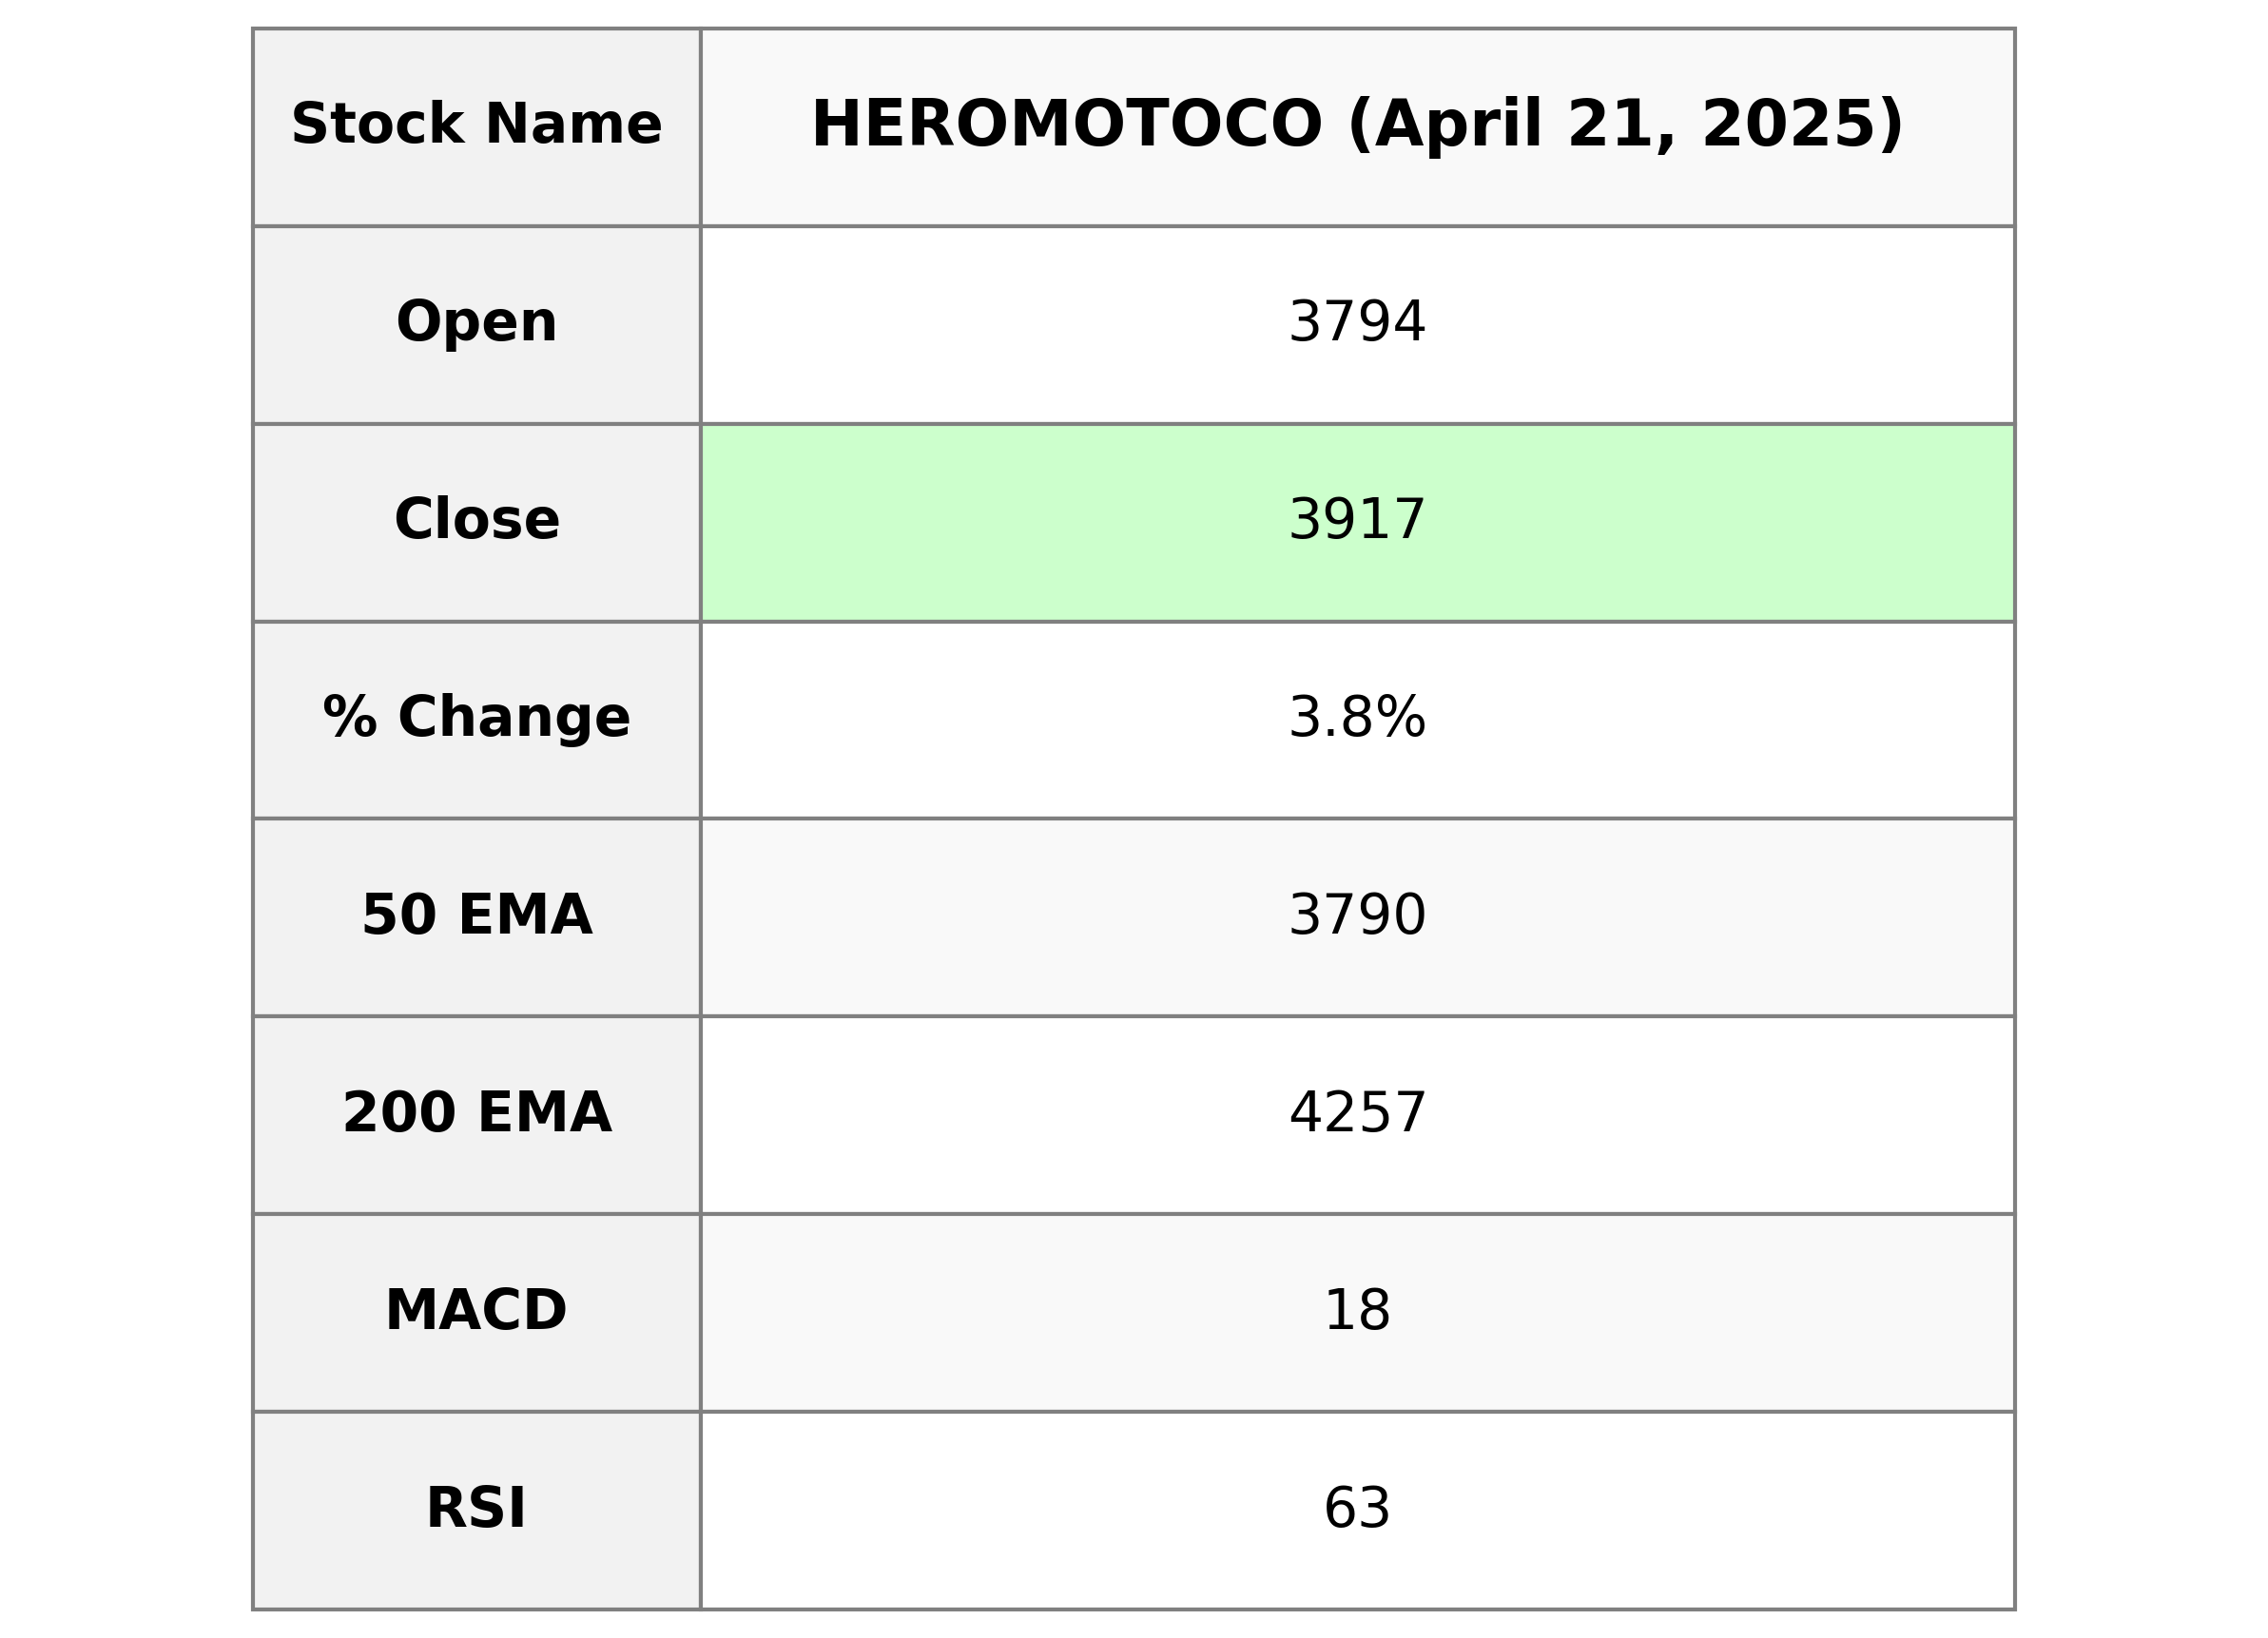
Hero MotoCorp Performance: Hero MotoCorp exhibited a daily gain of approximately 3.85%, closing at 3917.0 compared to the previous close of 3771.8. The stock has shown a strong upward trend, with an RSI of 62.86, indicating momentum in buying pressure. It trades above its 50-day EMA but below the 200-day EMA, suggesting a mixed long-term and short-term outlook, in the Consumer Cyclical sector, specifically in the Auto Manufacturers industry in India.
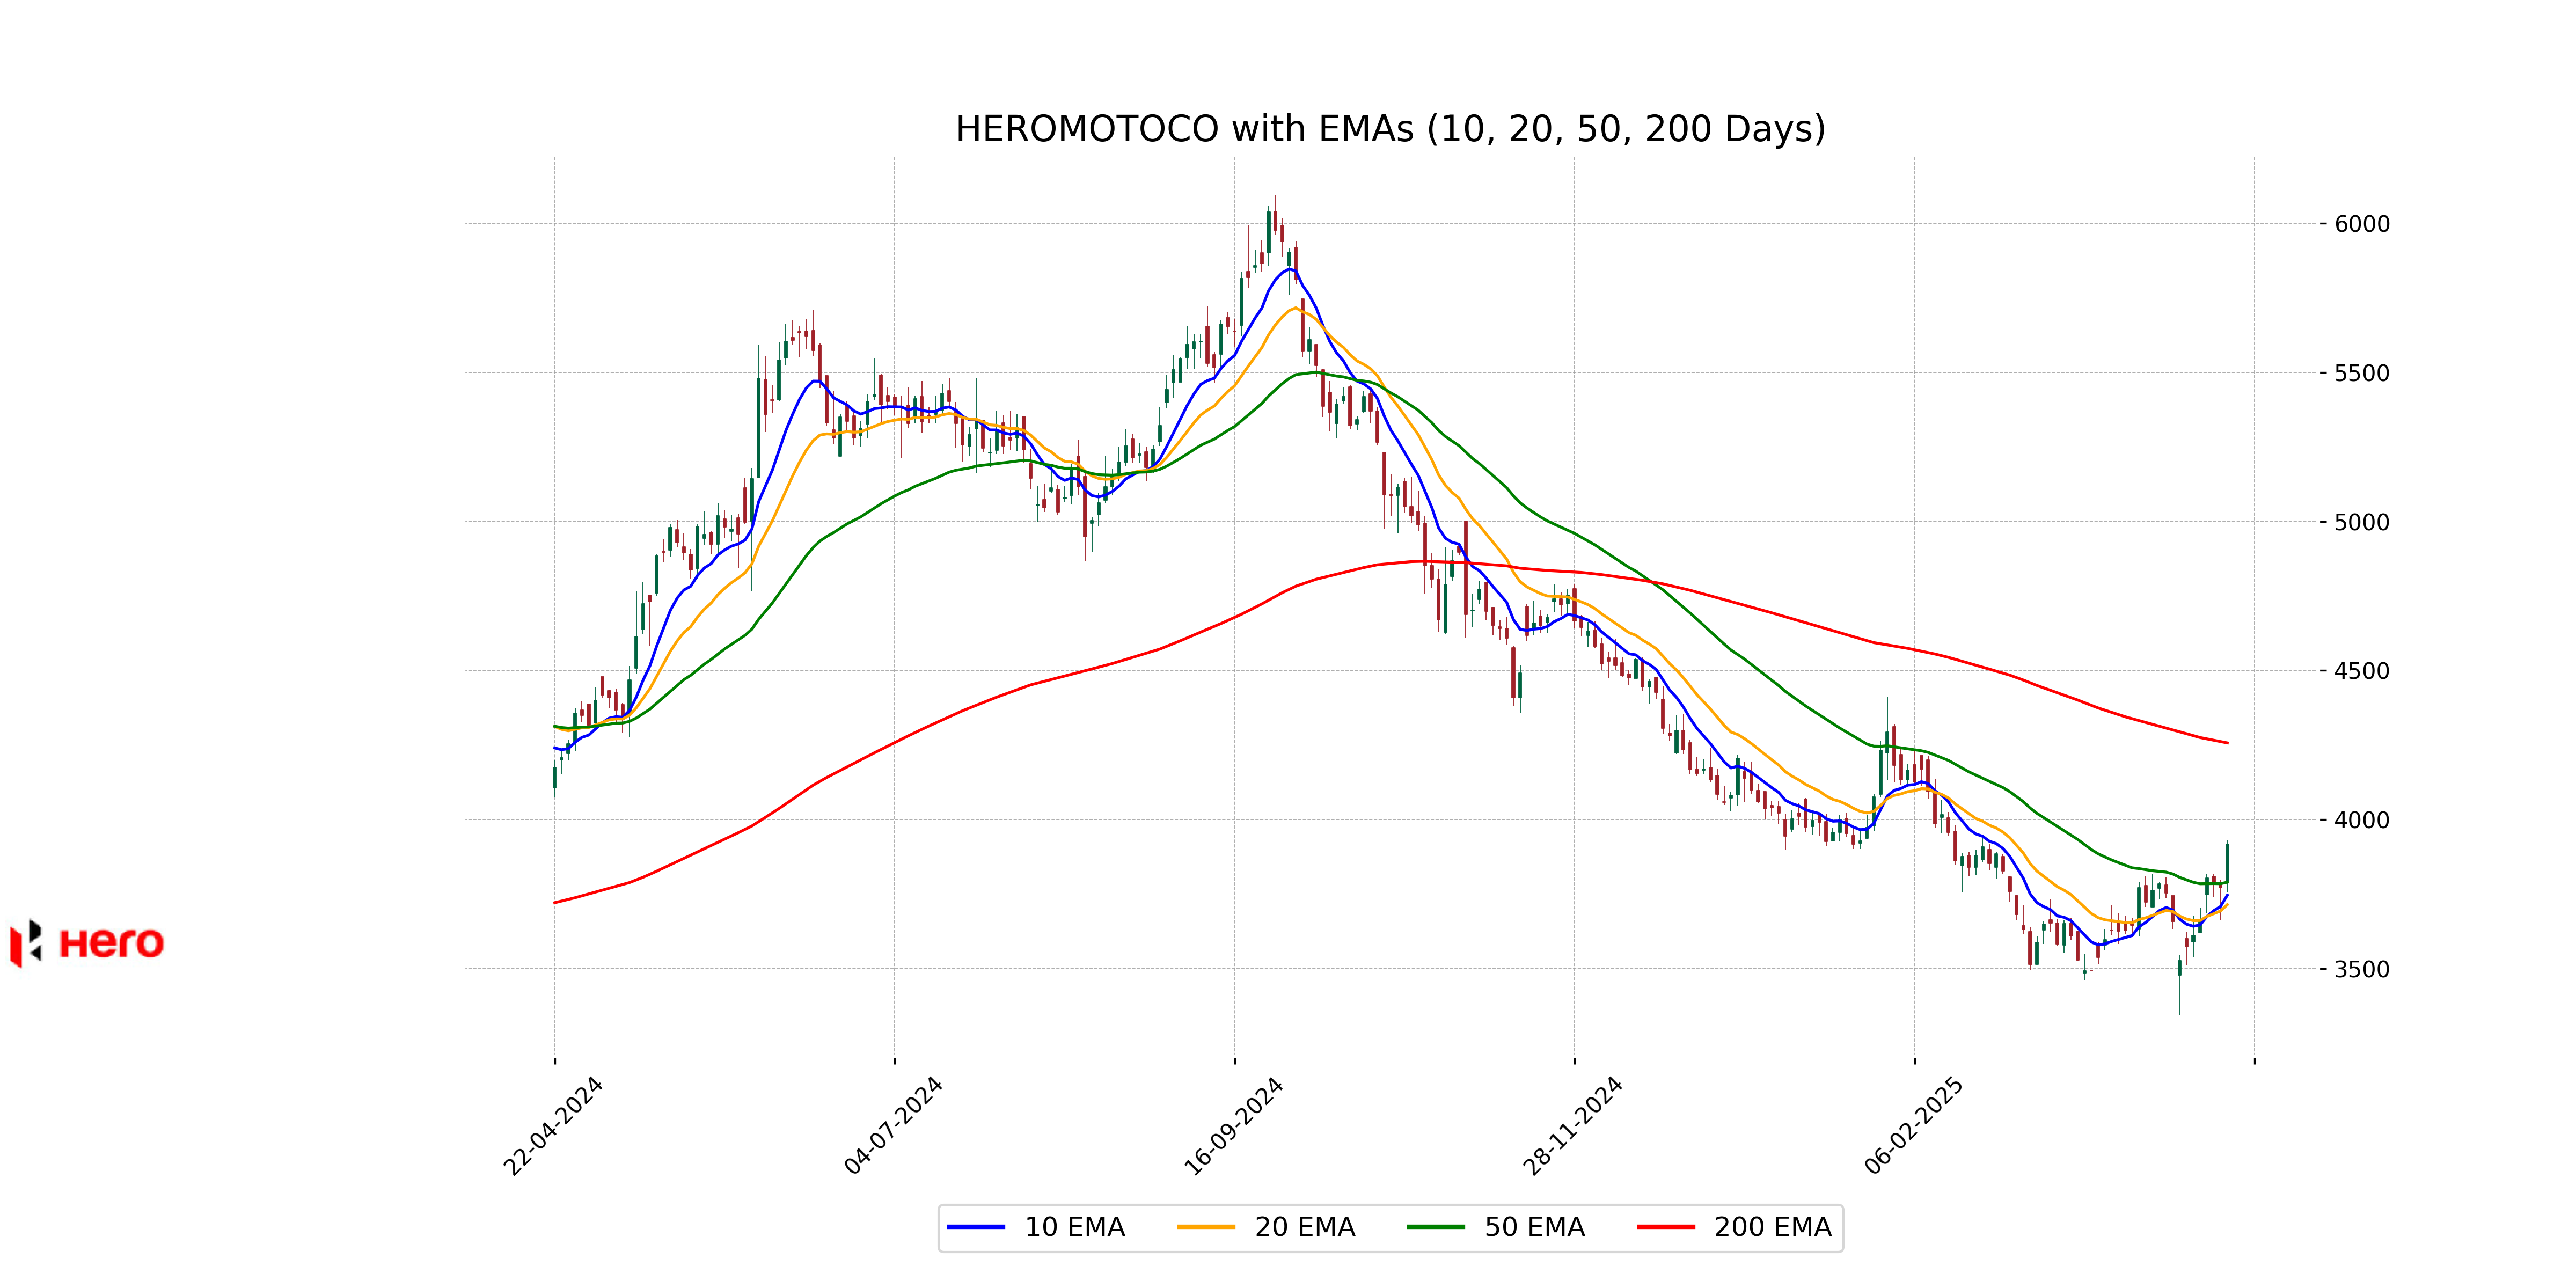
Relationship with Key Moving Averages
Hero MotoCorp's closing price is positioned above the 10 EMA, 20 EMA, and 50 EMA, indicating a strong short to mid-term bullish trend. However, the close remains below the 200 EMA, suggesting that the longer-term outlook might still be bearish or neutral.
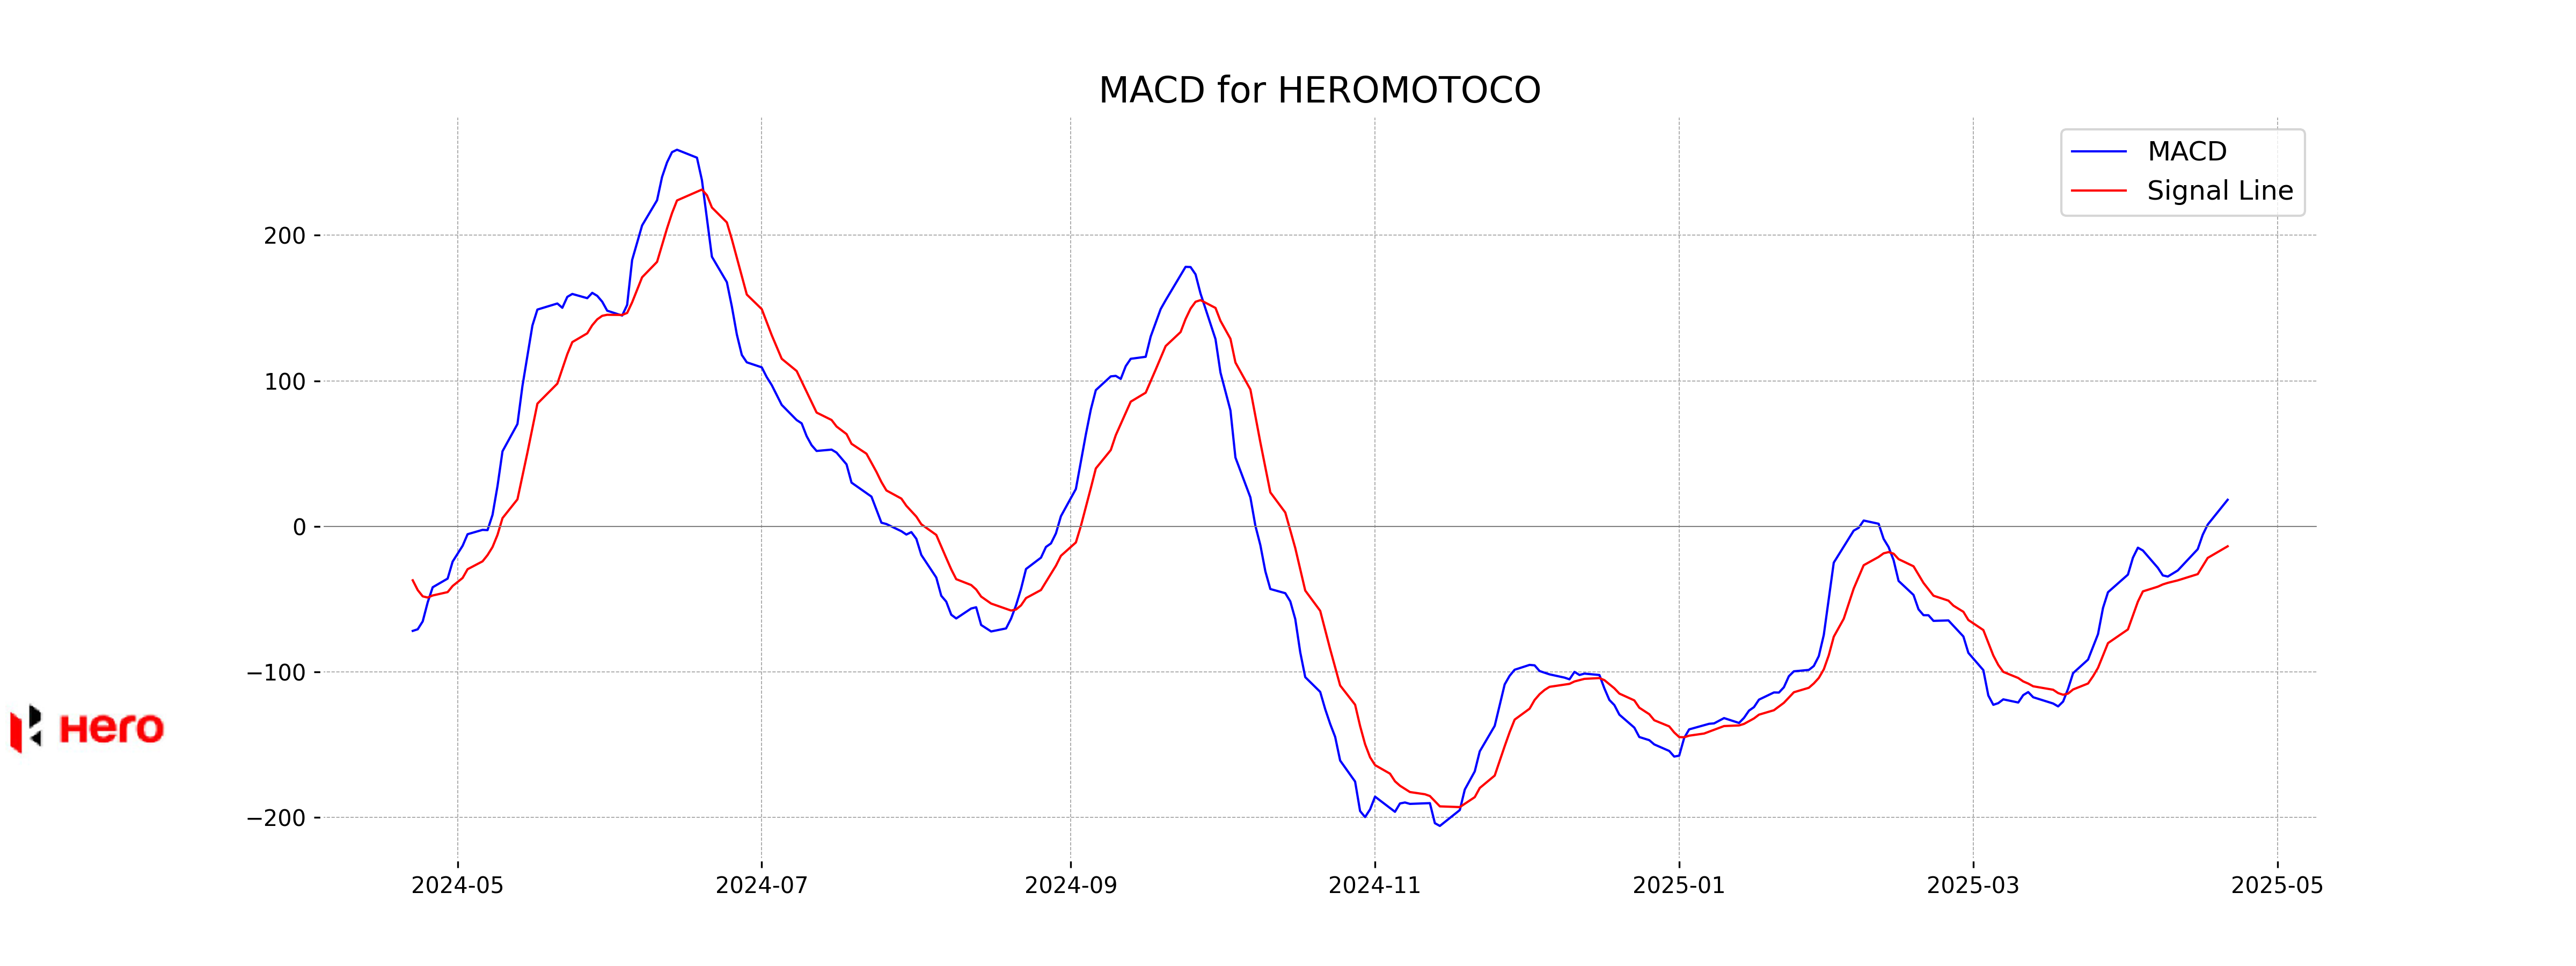
Moving Averages Trend (MACD)
Hero MotoCorp's MACD value is 18.27, which is above its MACD Signal value of -13.69. This indicates a bullish trend, suggesting that the stock may experience upward momentum. However, it's important to monitor other technical indicators and market conditions for a comprehensive analysis.
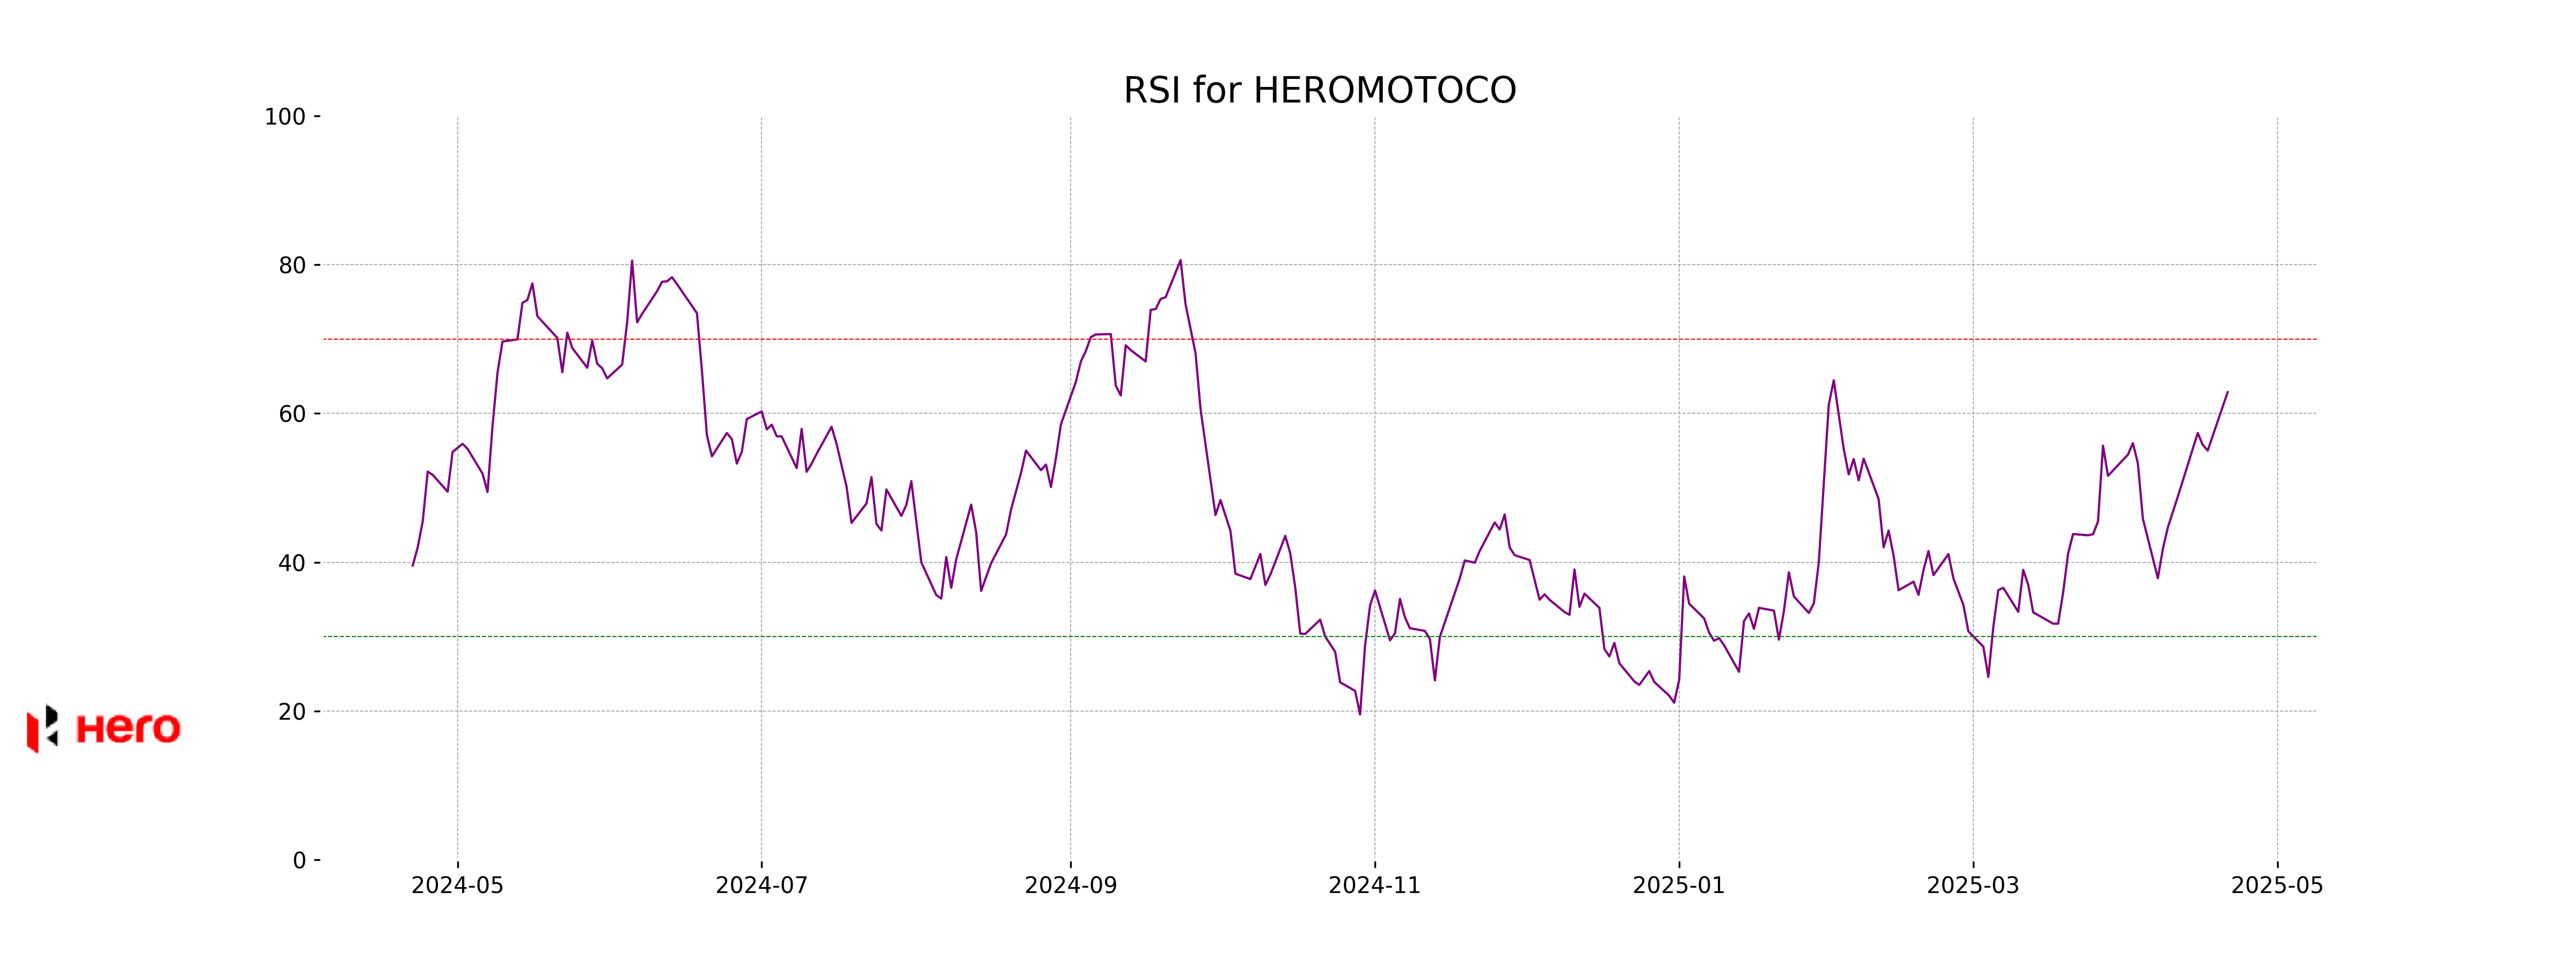
RSI Analysis
The RSI for Hero MotoCorp is 62.86, which is usually interpreted as neutral to slightly bullish. Generally, an RSI above 70 indicates that a stock is overbought, while an RSI below 30 suggests it is oversold. With an RSI near 63, Hero MotoCorp isn't in the overbought or oversold territory, suggesting balanced momentum.
Analysis for IndusInd Bank - April 21, 2025
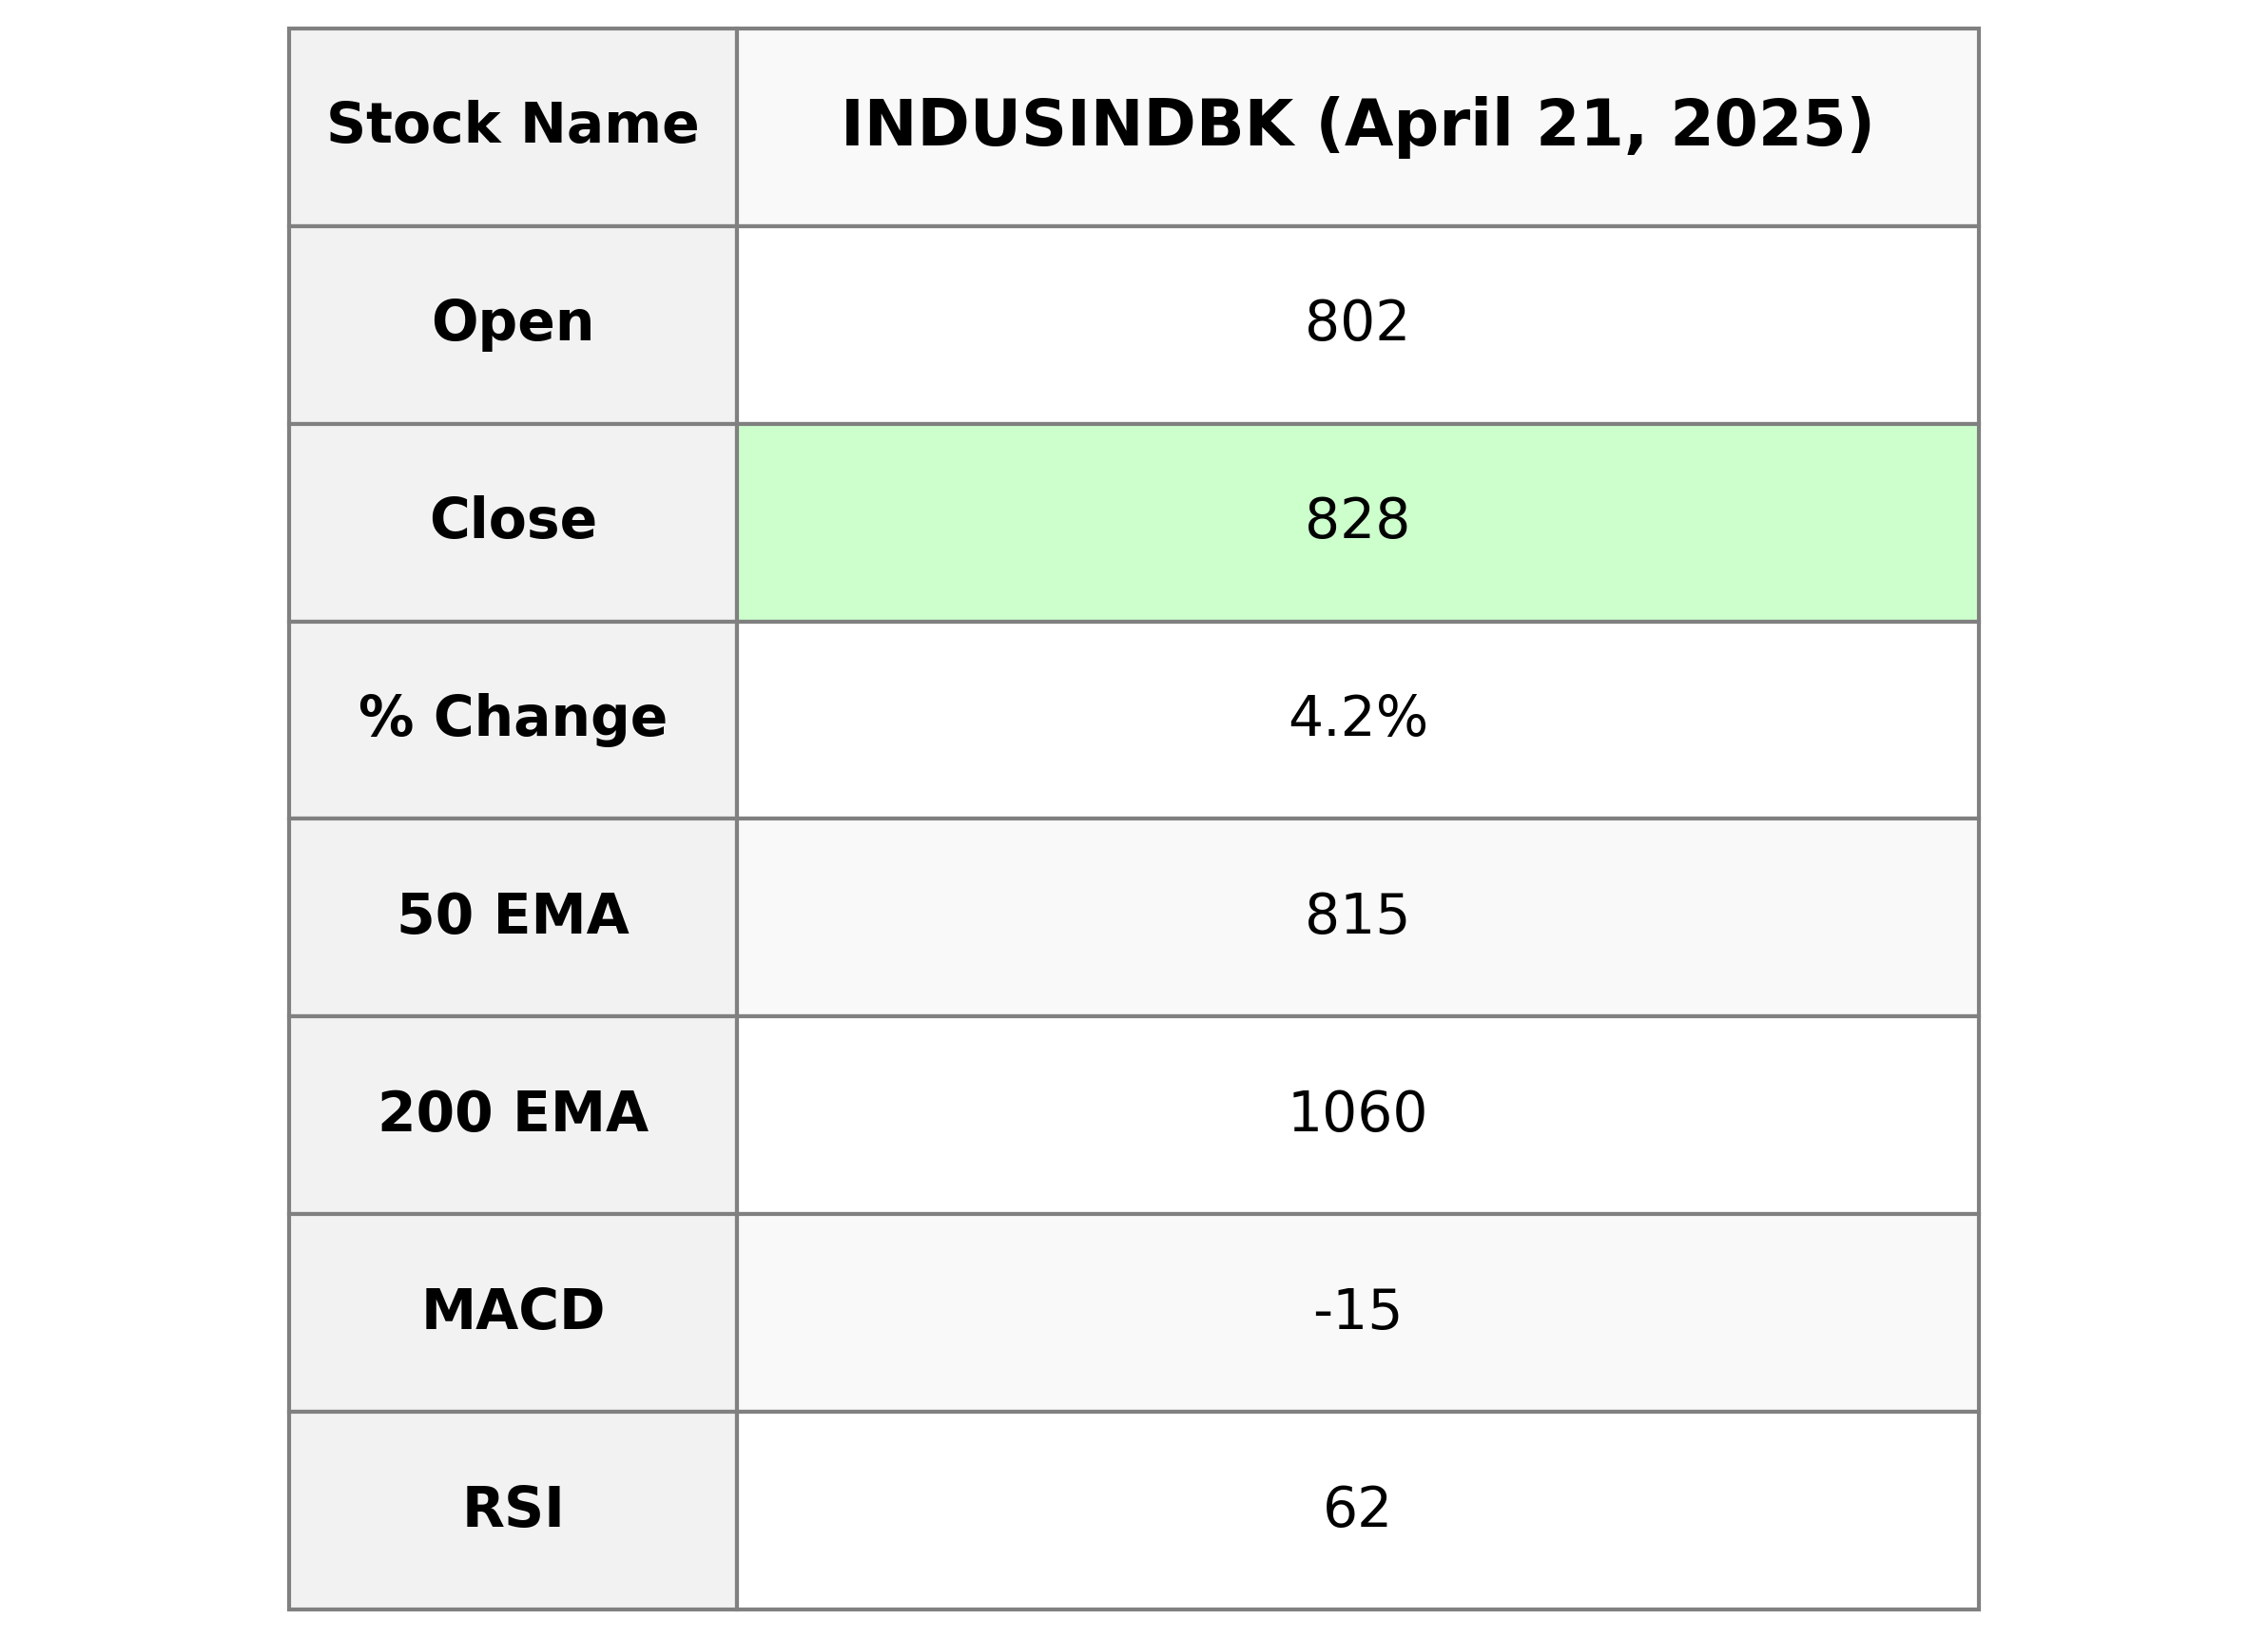
IndusInd Bank exhibited a strong performance with its stock closing at 828.20, representing a 4.22% increase from its previous close of 794.70. The volume traded was substantial at 15.64 million shares. The bank's market cap is approximately 645.21 billion INR, with a PE Ratio of 8.90, indicating a relatively low valuation compared to its earnings.
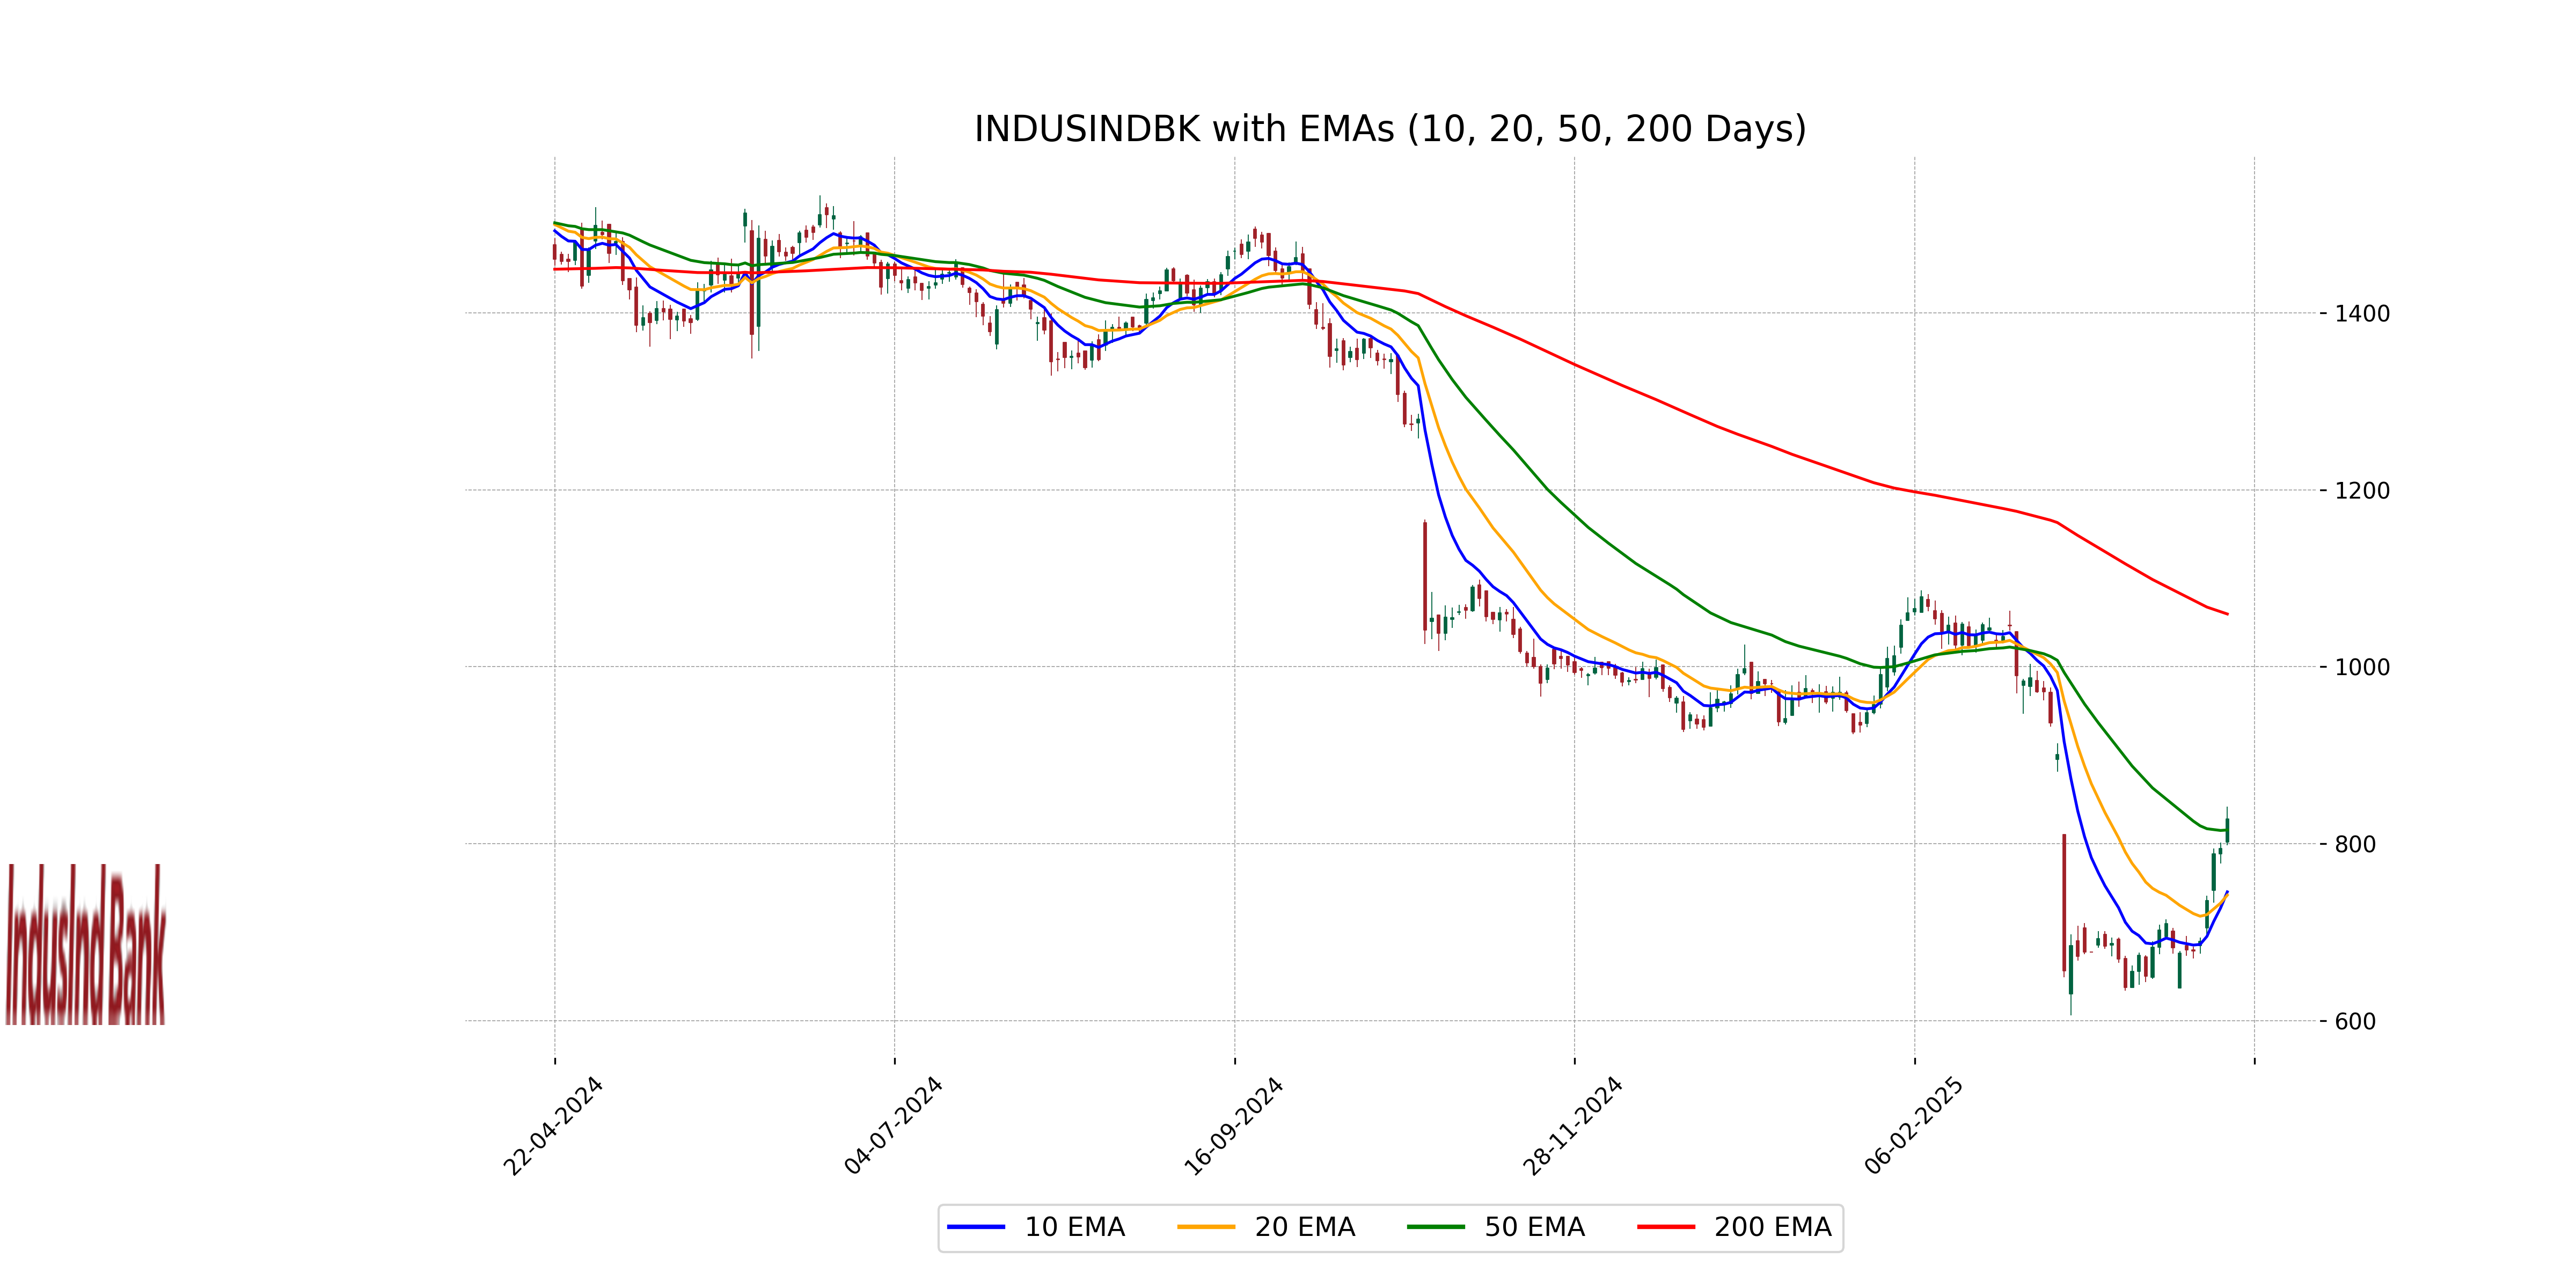
Relationship with Key Moving Averages
IndusInd Bank's current closing price of 828.20 is above its 10 EMA (745.46) and 20 EMA (741.80), suggesting a short-term bullish trend. However, it remains below the 50 EMA (815.44) and significantly below the 200 EMA (1059.73), indicating potential longer-term bearish pressure.
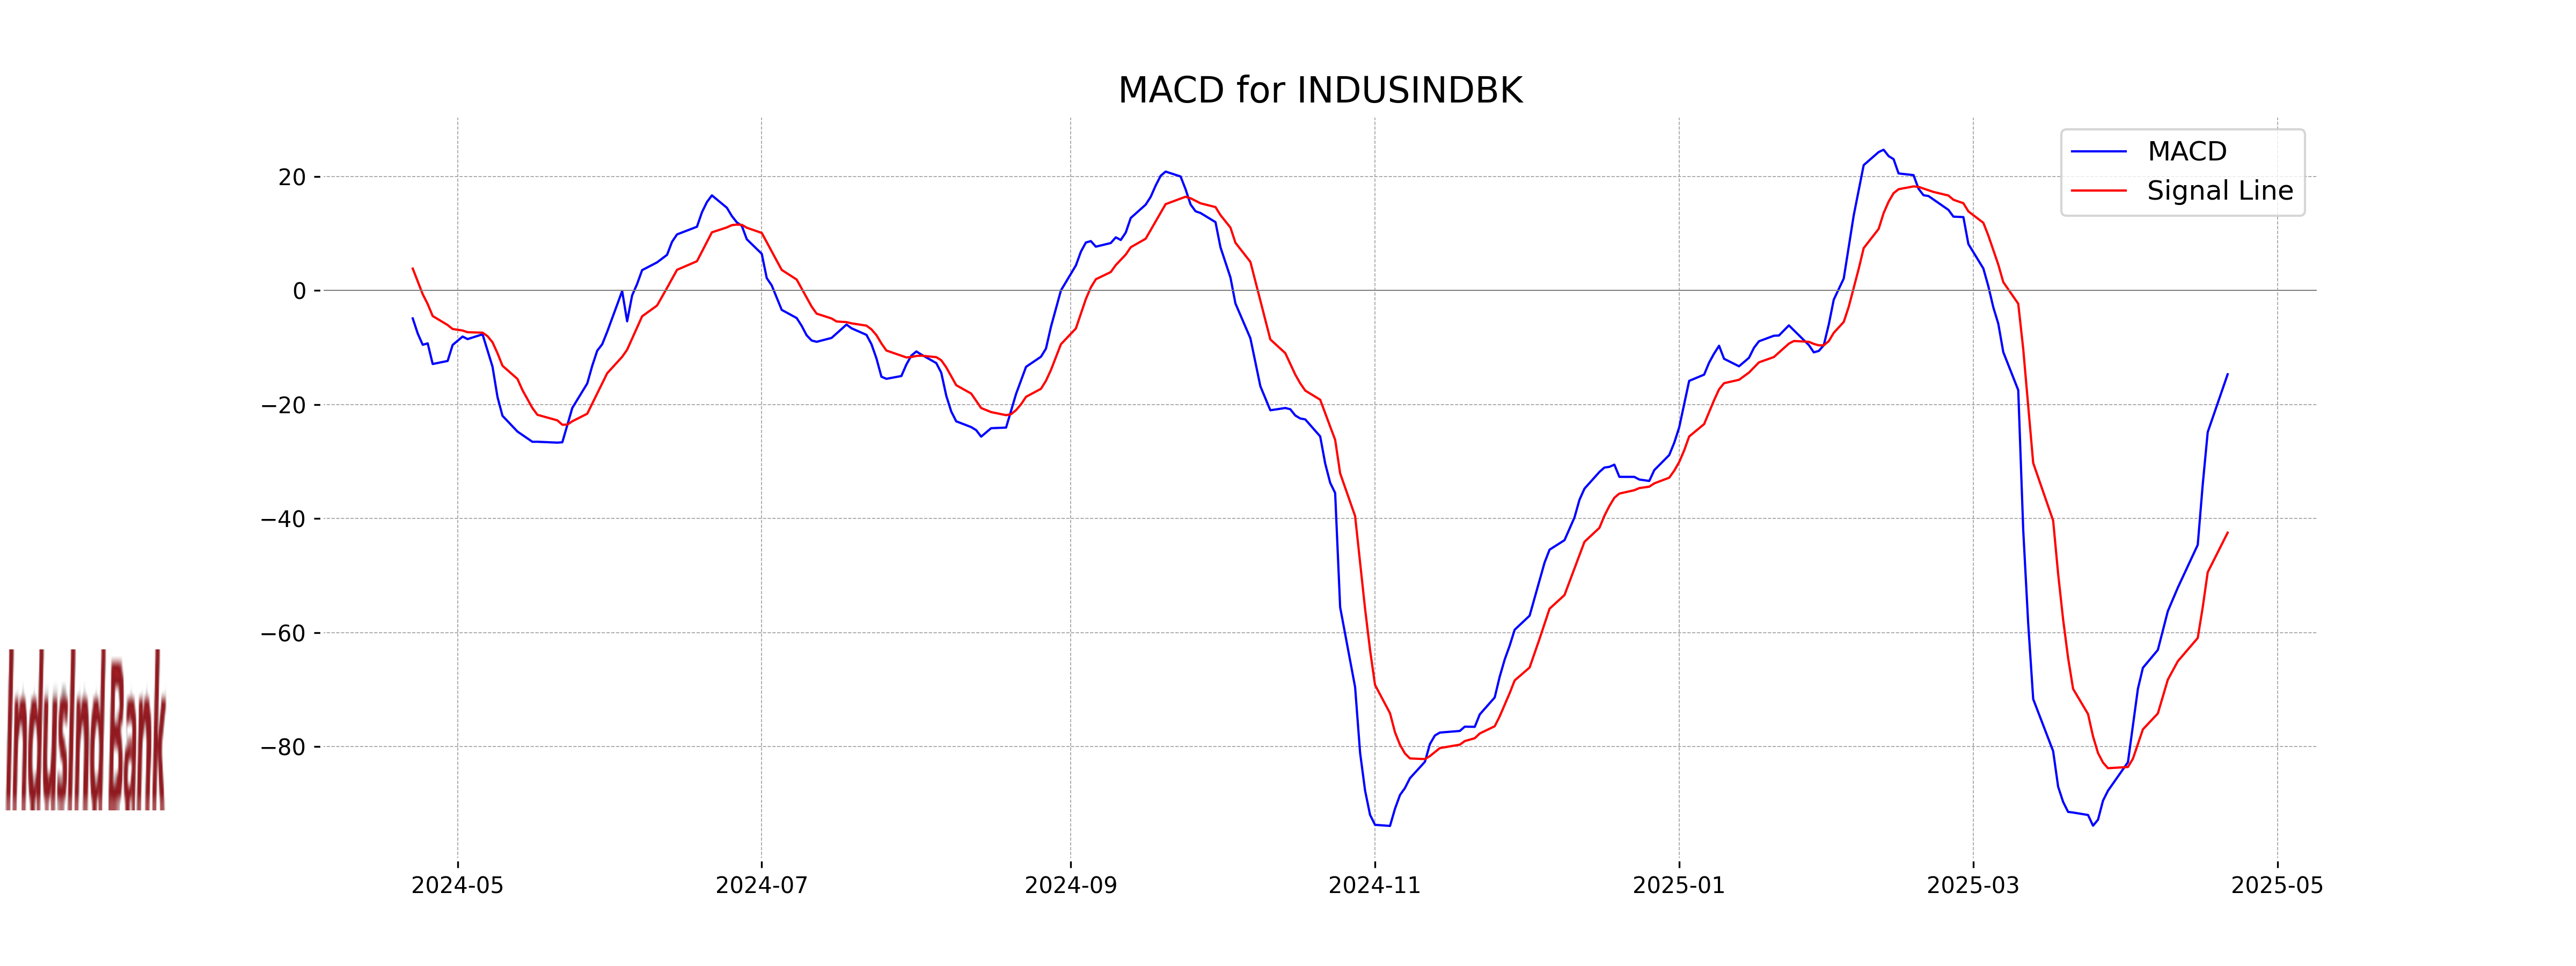
Moving Averages Trend (MACD)
The Moving Average Convergence Divergence (MACD) for IndusInd Bank is -14.69, which is above the MACD Signal line of -42.47. This indicates a bullish signal as the MACD line is above the signal line. However, the MACD value being negative suggests that there might still be underlying bearish momentum overall.
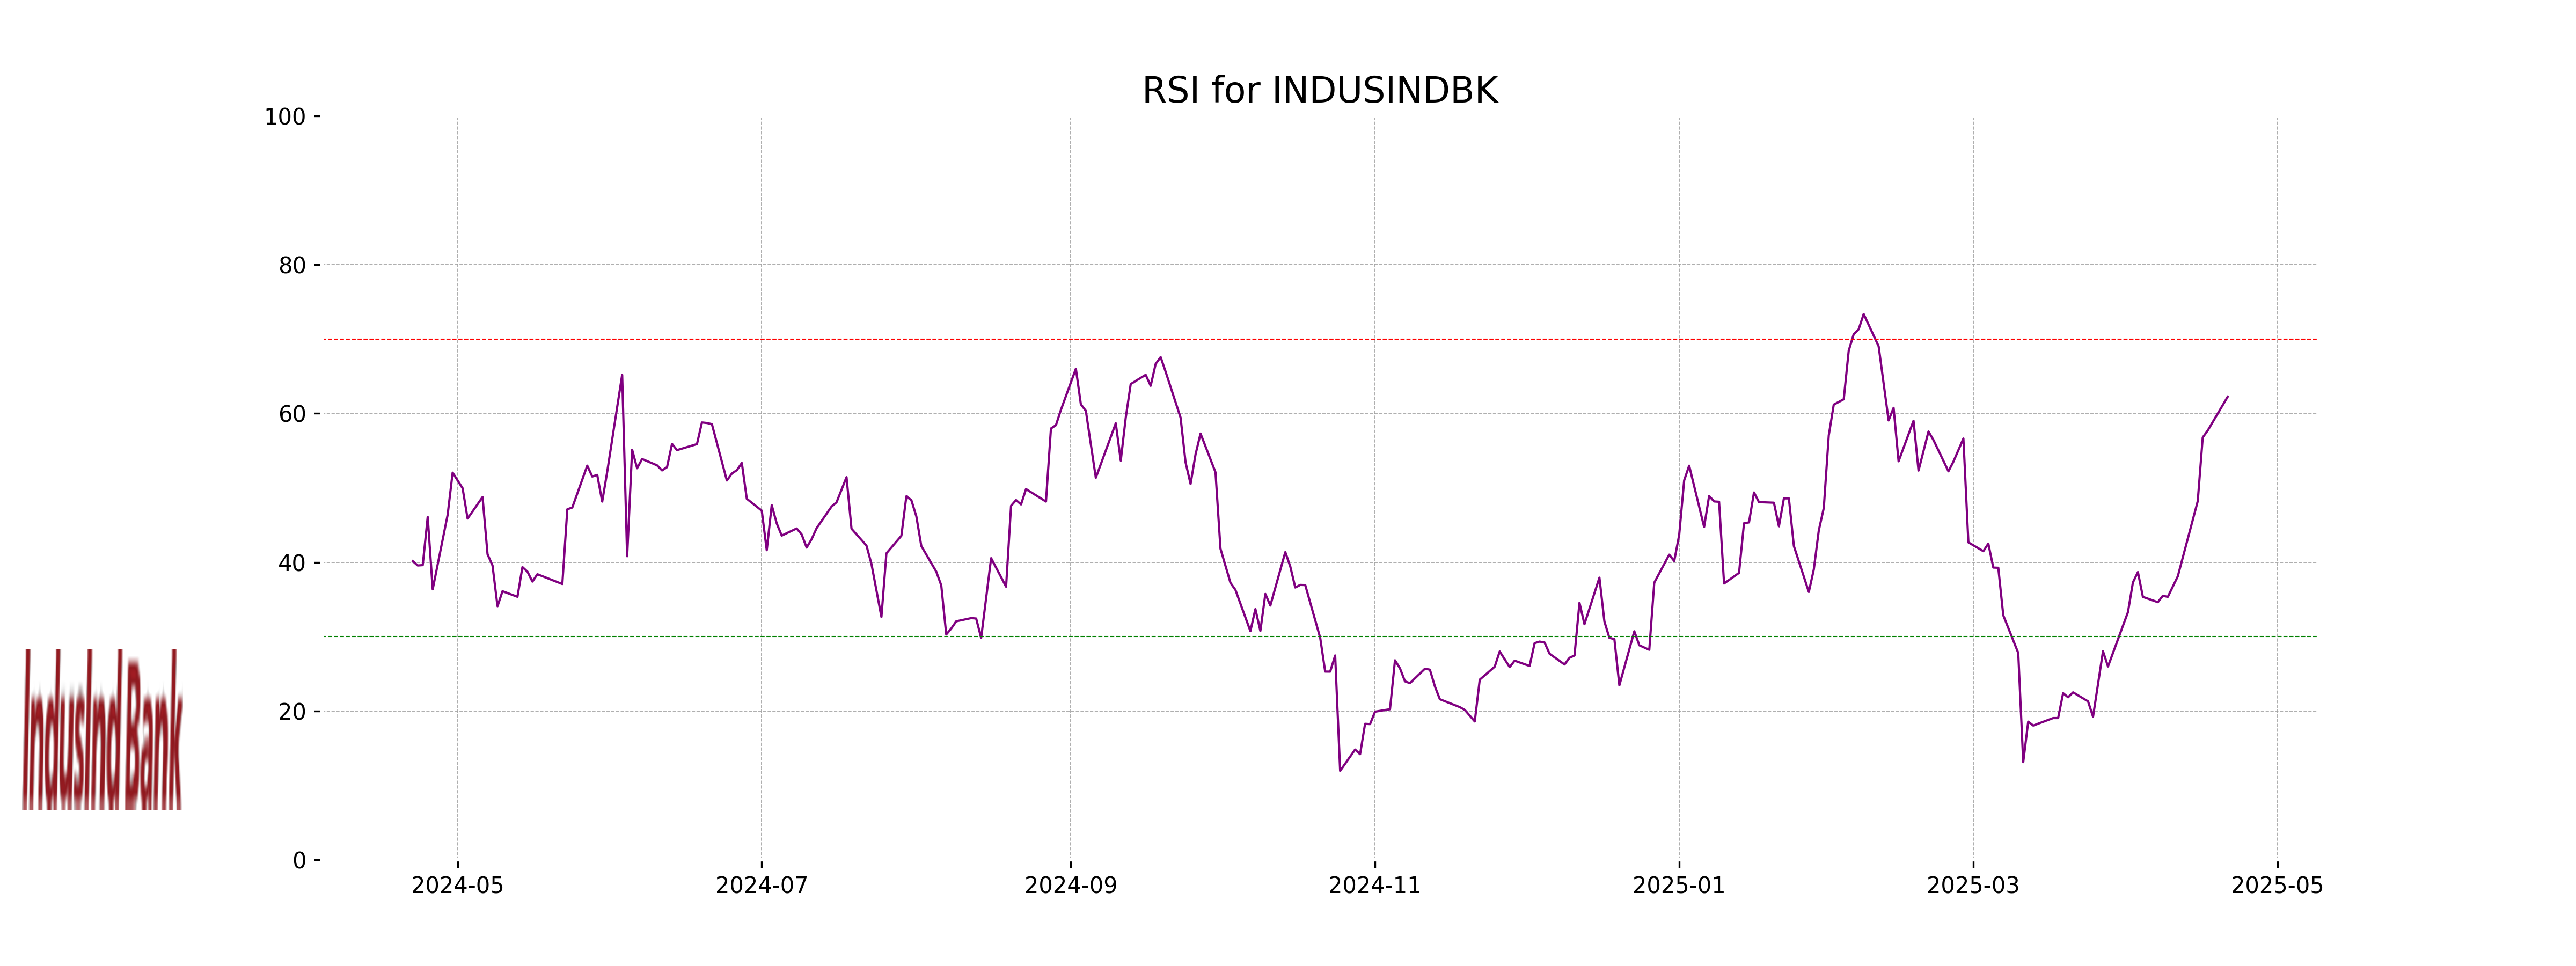
RSI Analysis
IndusInd Bank's RSI is 62.24, placing it in the neutral zone, but closer to being overbought. This suggests that while the stock is neither overbought nor oversold, it is approaching higher levels, and investors should watch for any further upward or downward movements.
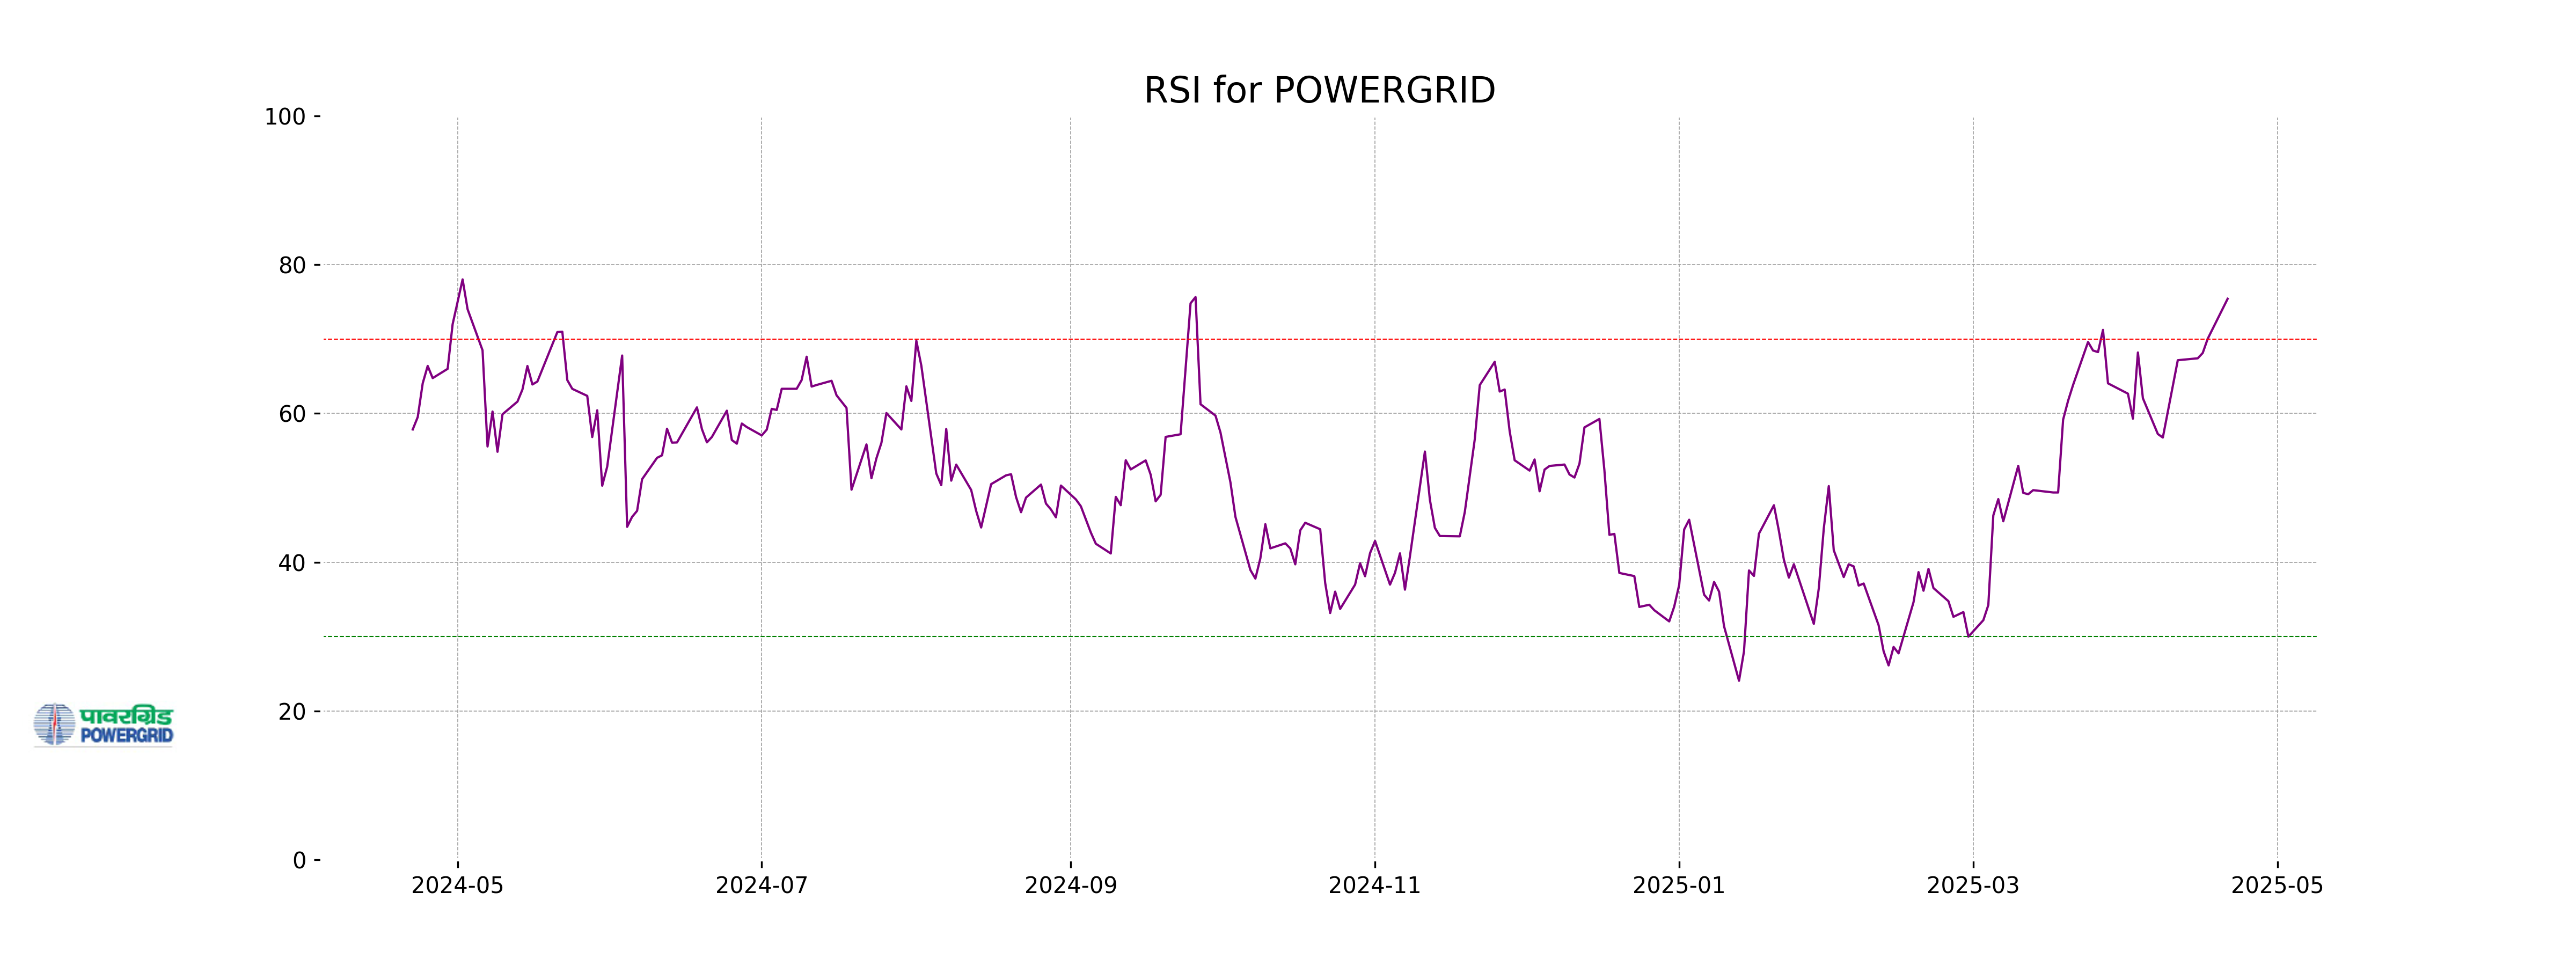
Analysis for Power Grid - April 21, 2025
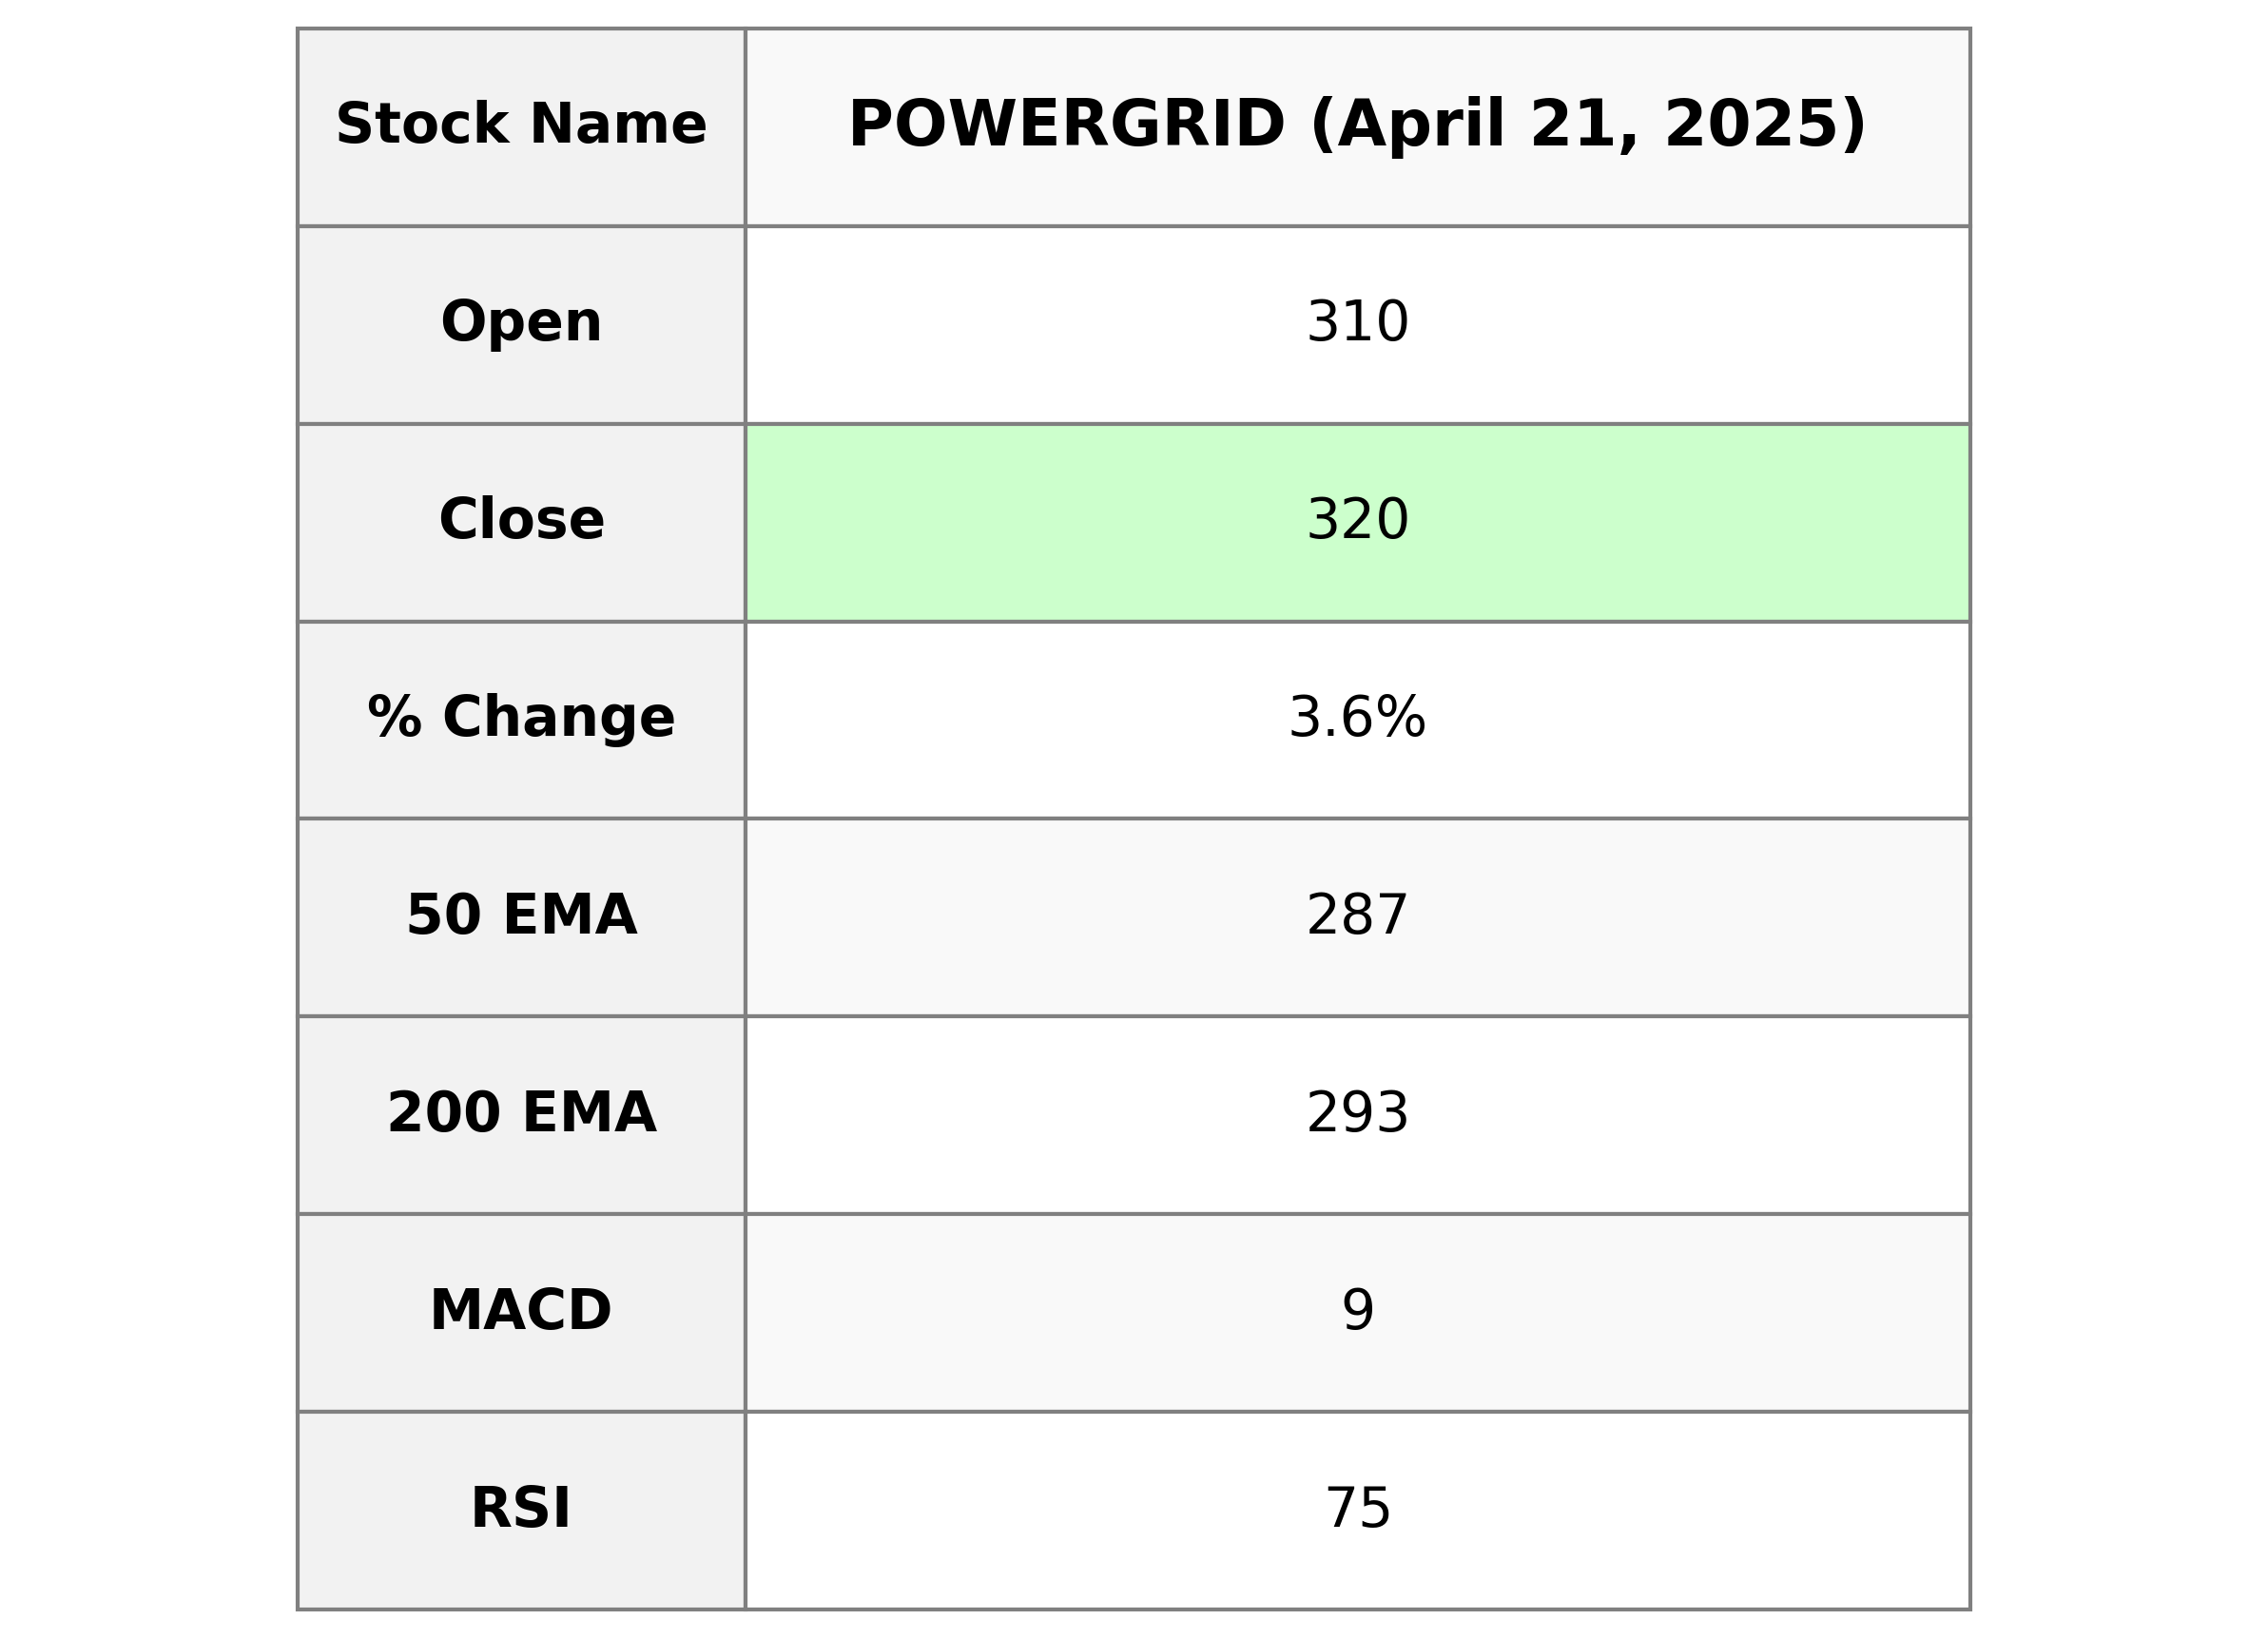
Power Grid Corporation of India observed a positive performance with its stock closing at 320.0, showing an increase of 3.56% from the previous close at 309.0, with a points change of 11.0. The stock experienced a high trading volume of 13,367,232 and showed robust technical indicators with a strong RSI of 75.42 and a favorable MACD value, reflecting bullish momentum. The company's market cap stands at approximately 2,976 billion INR, with a PE ratio of 19.21, indicating its valuation within the Utilities sector, specifically in the Utilities - Regulated Electric industry, in India.
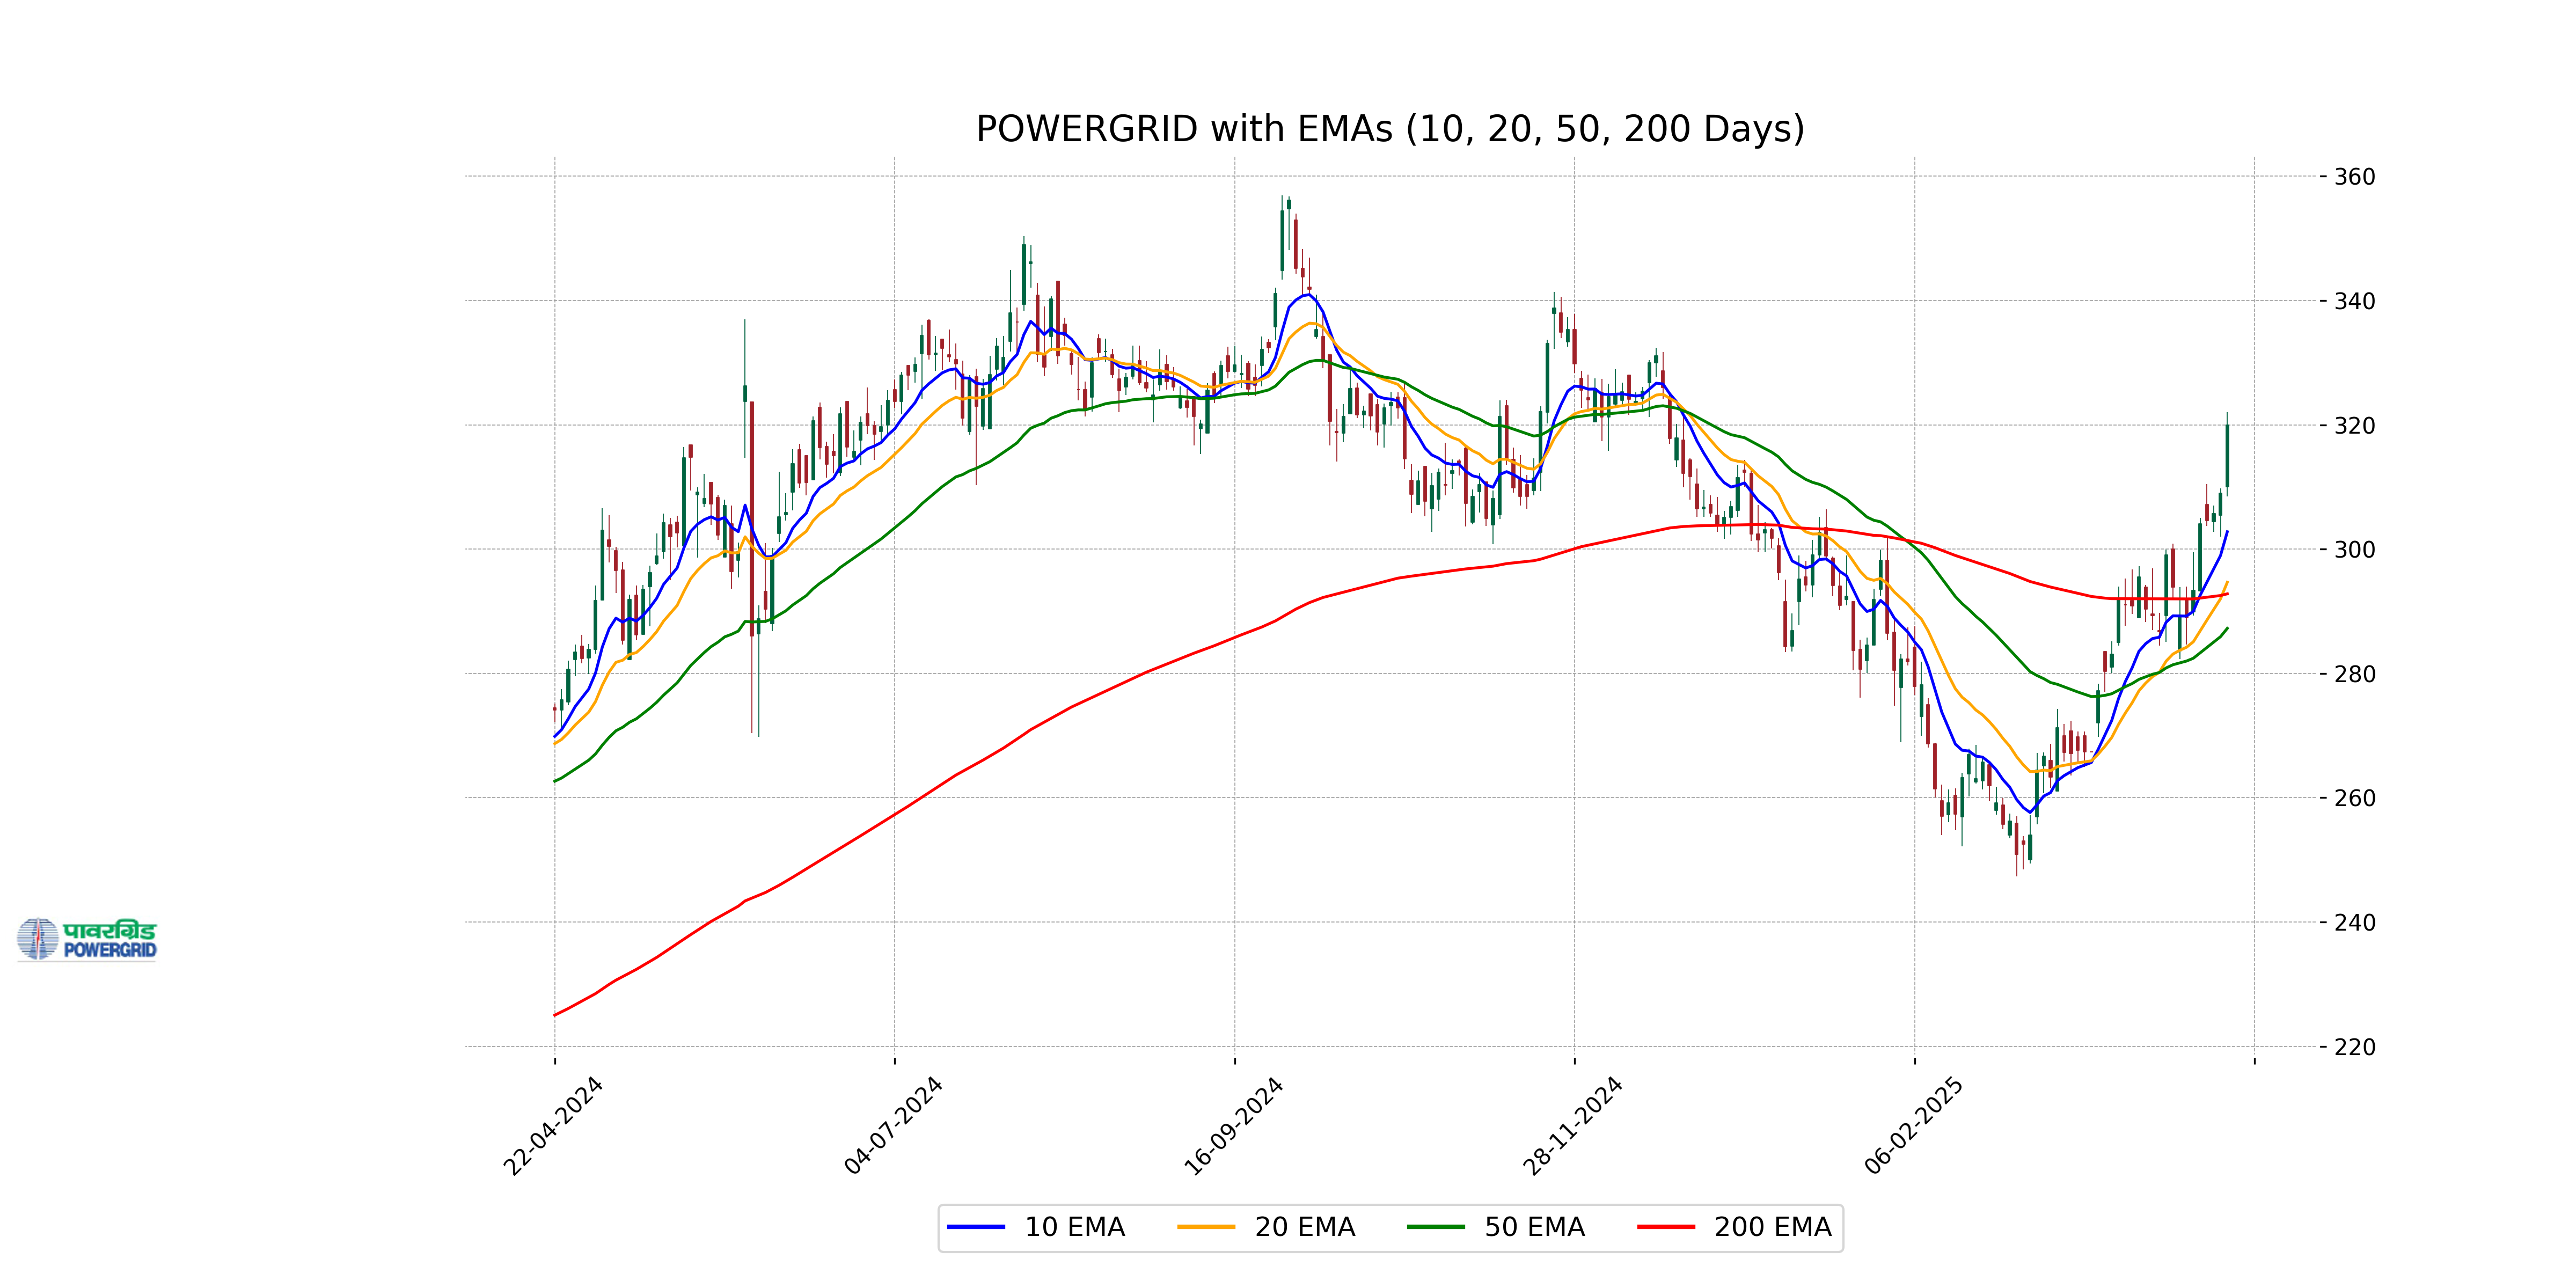
Relationship with Key Moving Averages
Power Grid's current stock price of 320.0 is above its 50 EMA at 287.25 and 200 EMA at 292.81, indicating a bullish trend. The price also surpasses the 10 EMA at 302.79 and the 20 EMA at 294.67, suggesting strong upward momentum.
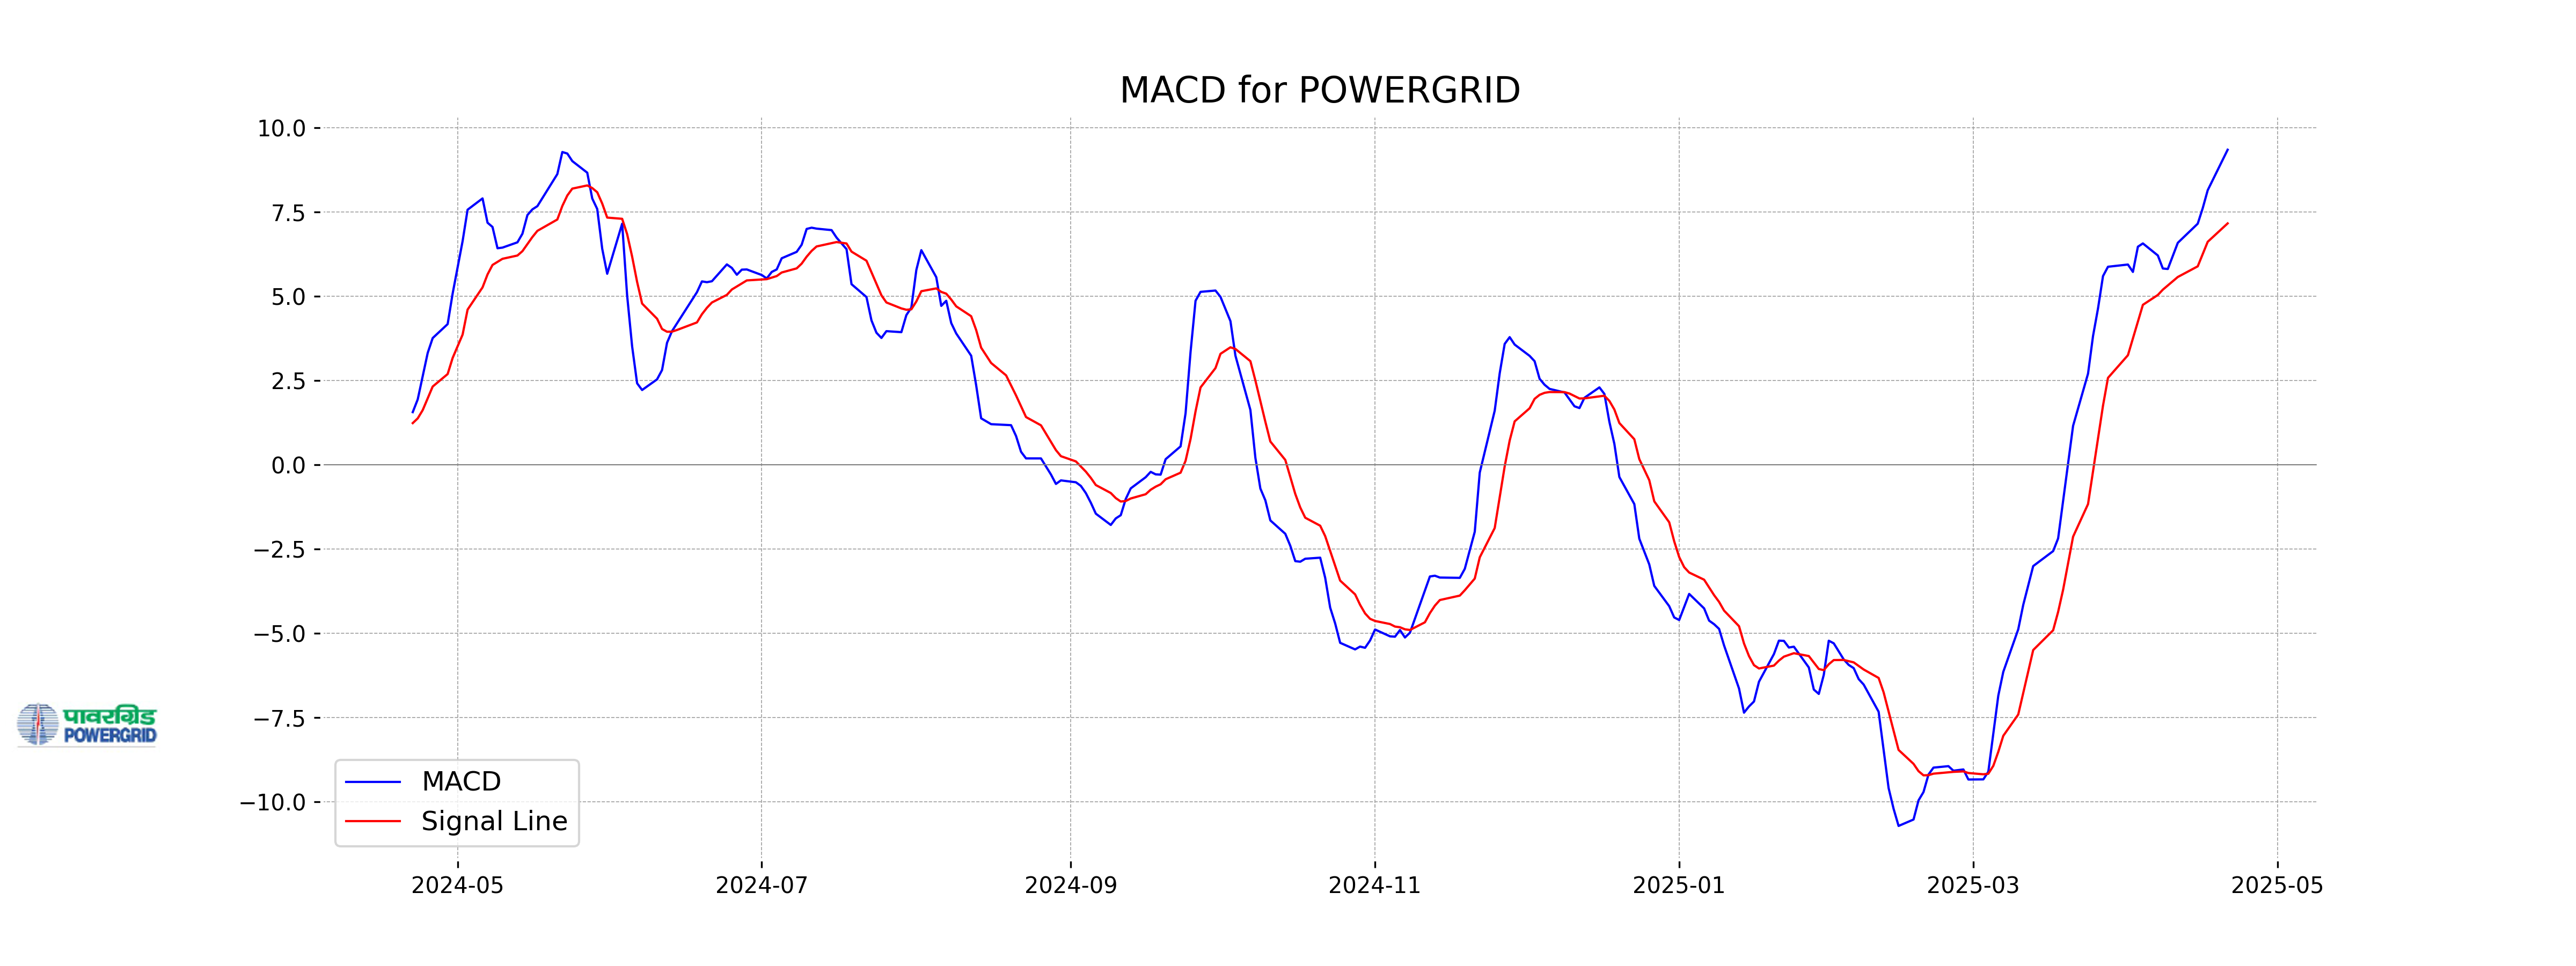
Moving Averages Trend (MACD)
The MACD for Power Grid is 9.35, which is above the MACD Signal of 7.17. This indicates a bullish momentum as the MACD line is above the signal line, suggesting potential upward price movement.
RSI Analysis
Power Grid's RSI is 75.42, indicating that the stock is in overbought territory. This suggests that the stock may be due for a potential pullback or consolidation. Investors should exercise caution and consider other indicators before making any trading decisions.
Analysis for Tech Mahindra - April 21, 2025
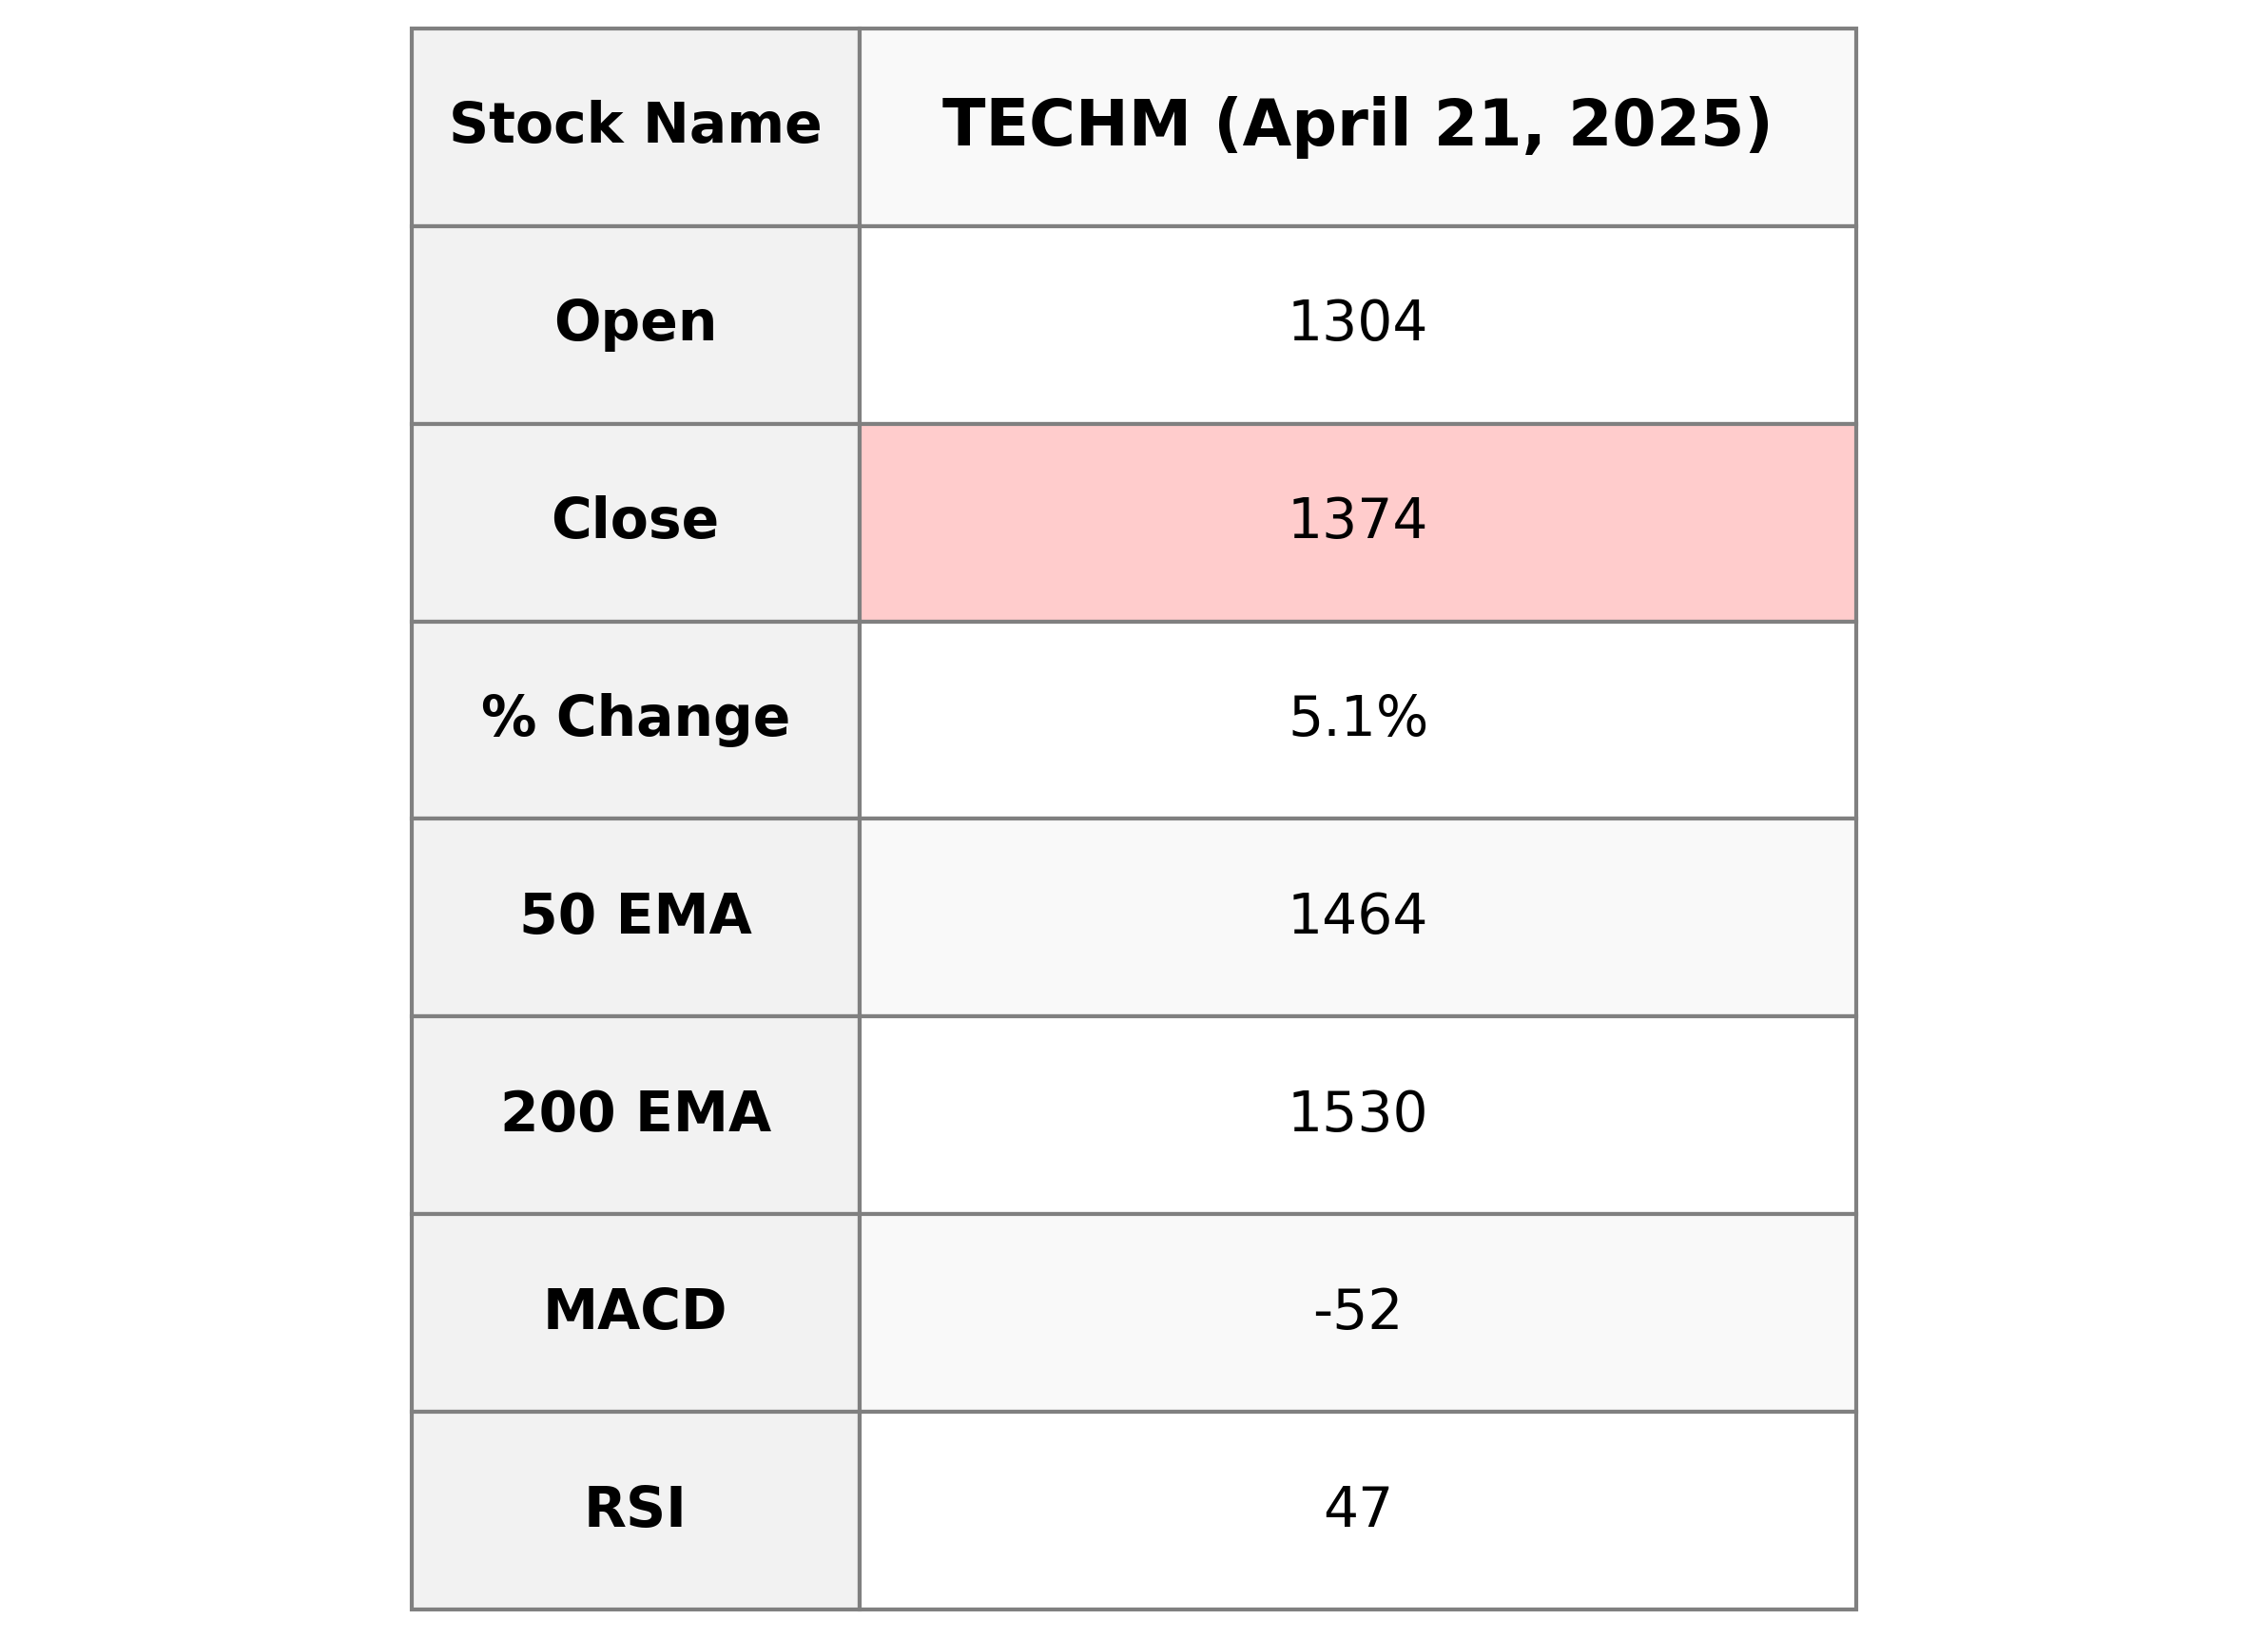
Tech Mahindra has shown a positive change with a closing price of 1373.5, marking an increase of 5.10% in comparison to the previous close. Despite trading below its 50-day and 200-day EMA, Tech Mahindra's MACD suggests a negative trend, while its RSI indicates moderate strength. The technology company, belonging to the Information Technology Services industry in India, maintains a market cap of 1,215,215,173,632 with a PE Ratio of 32.54 and an EPS of 42.21.
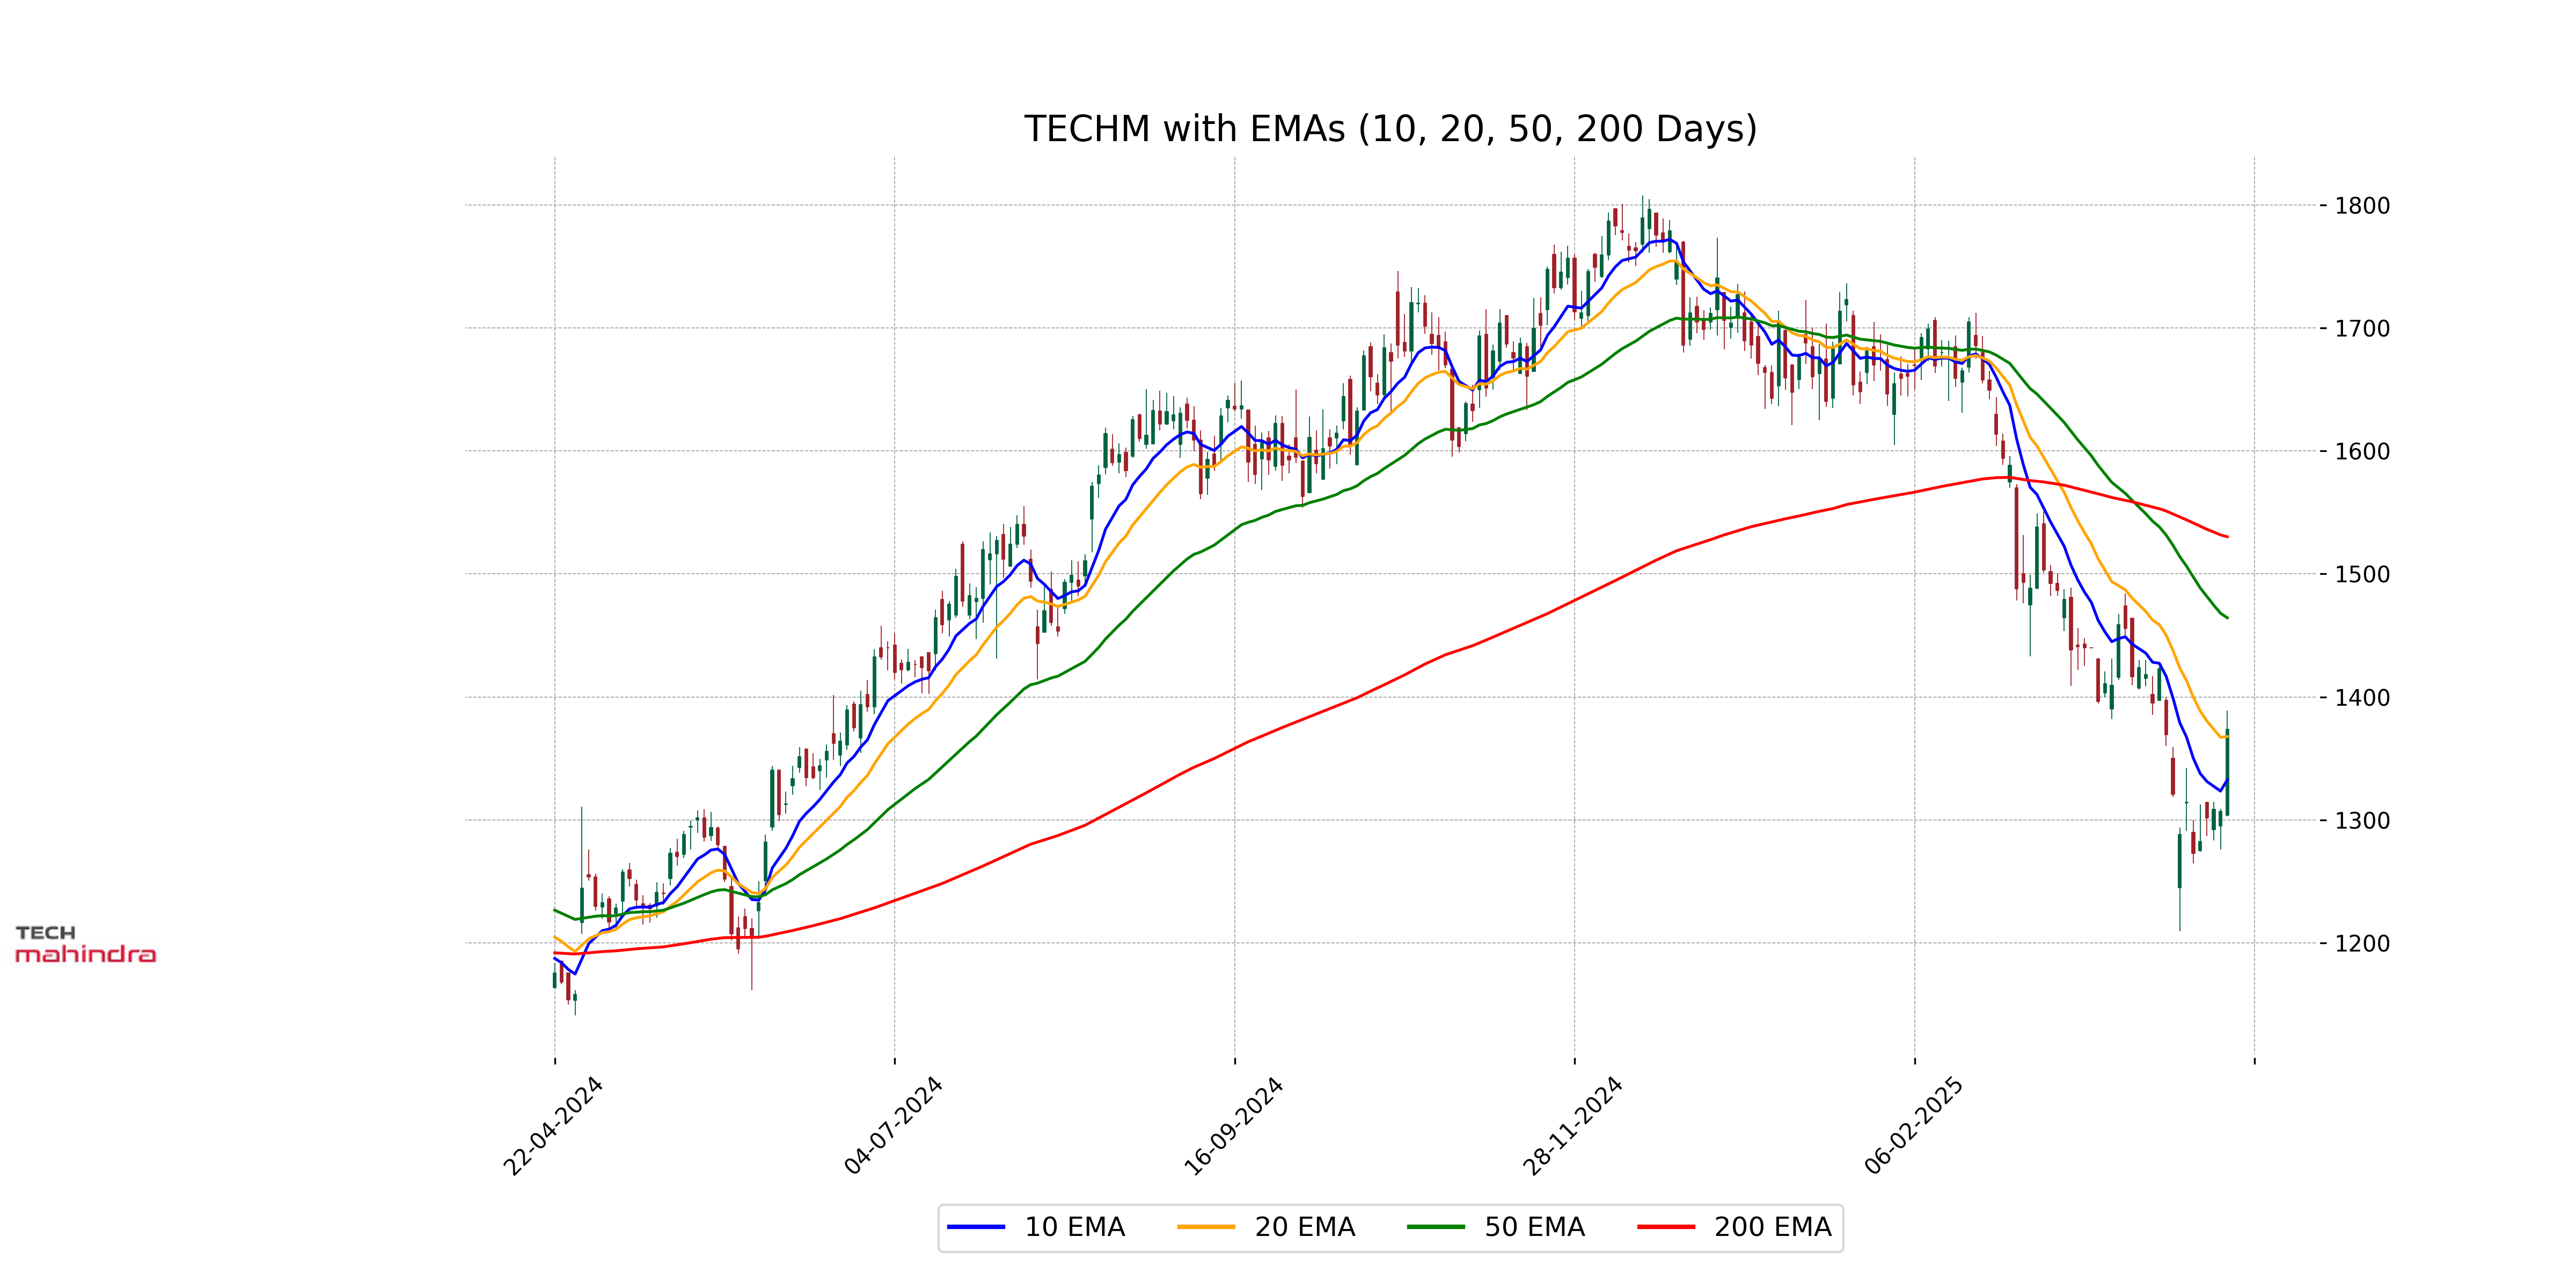
Relationship with Key Moving Averages
Tech Mahindra's closing price of 1373.5 is currently below both its 50-day EMA of 1464.33 and 200-day EMA of 1530.21, indicating a bearish trend in the short to medium term. However, the price is above the 10-day EMA of 1332.54, suggesting a recent upward movement.
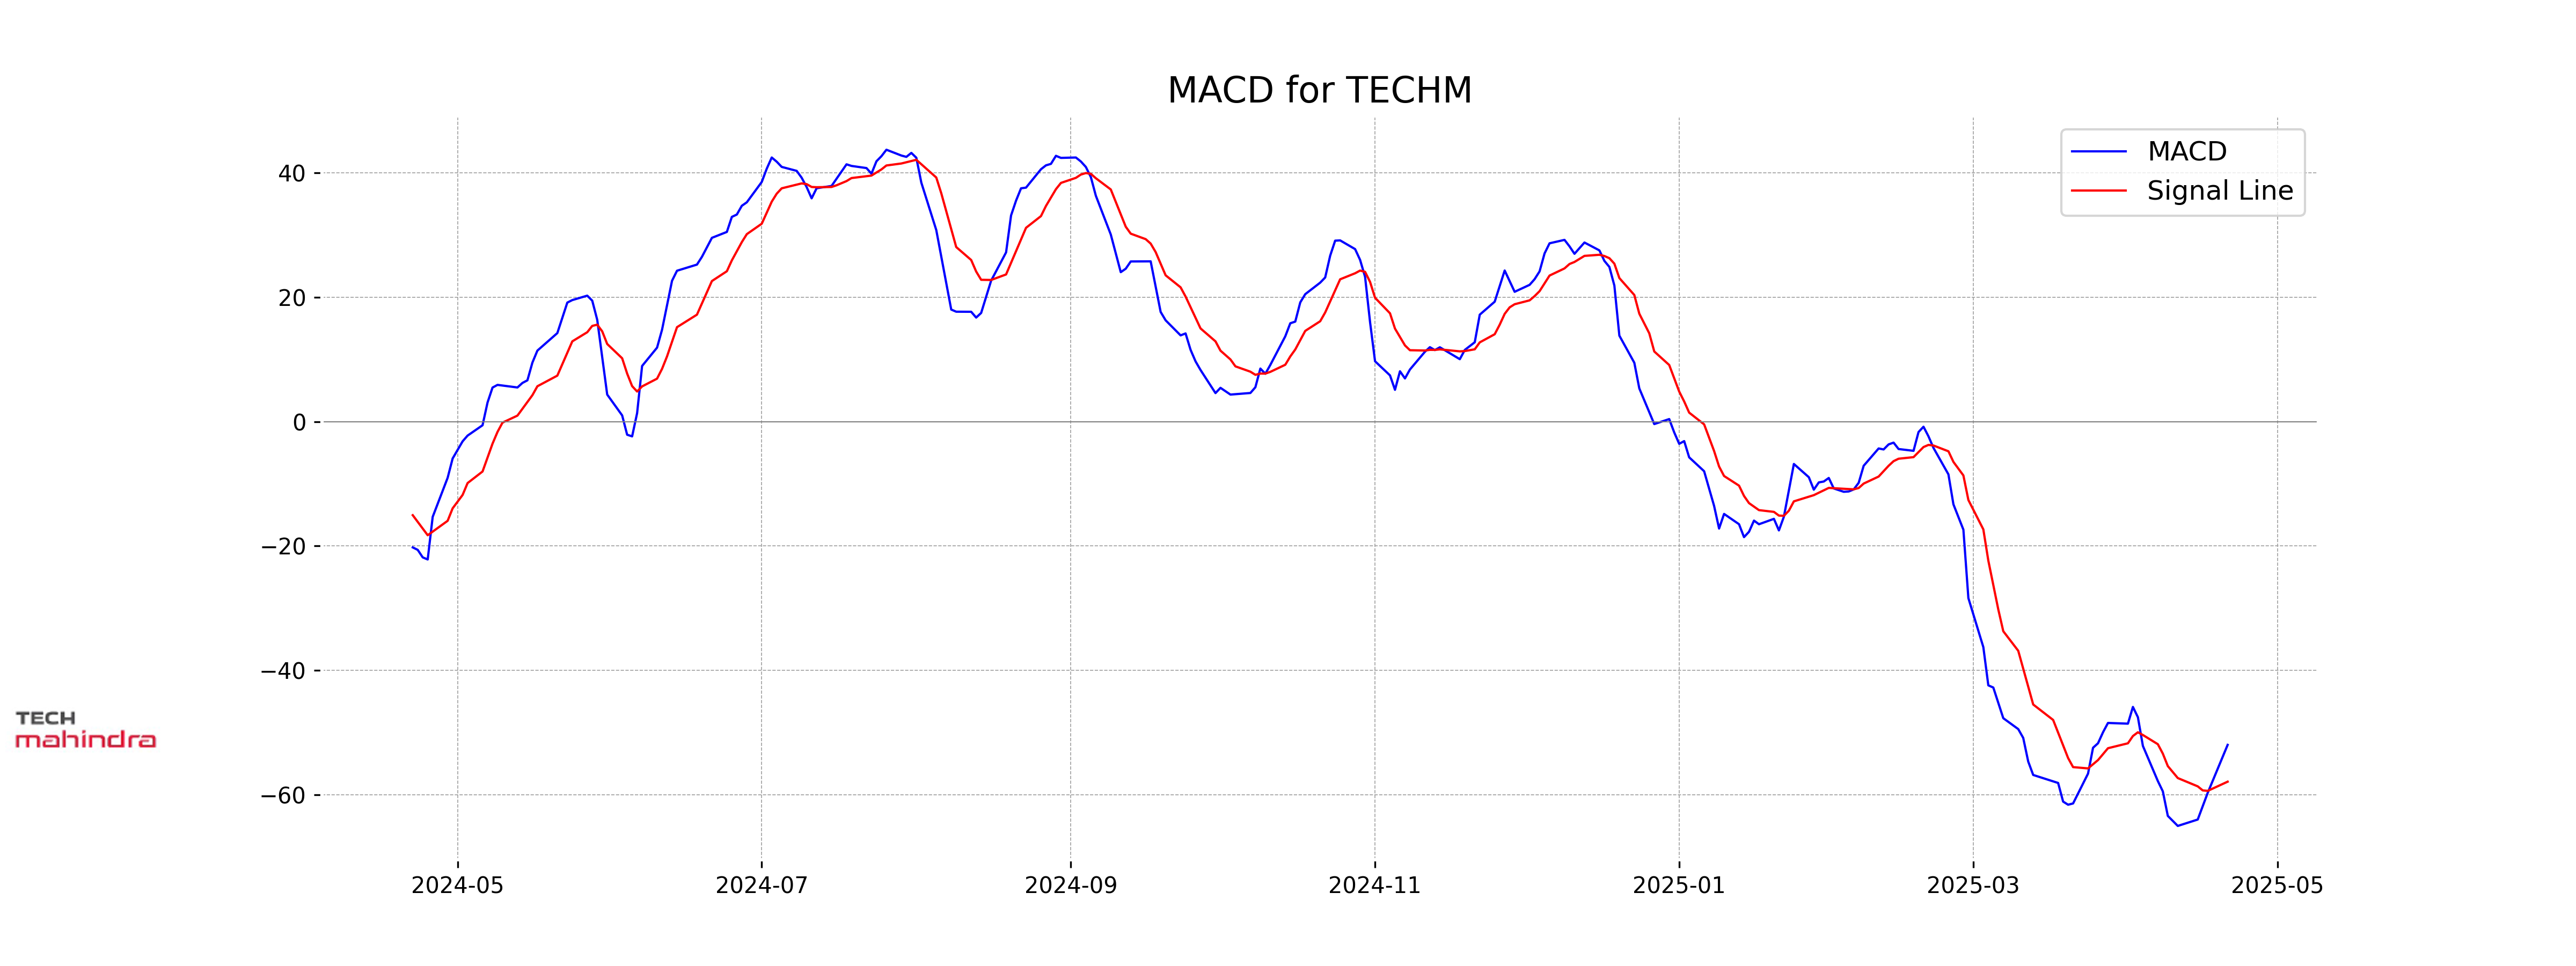
Moving Averages Trend (MACD)
Tech Mahindra's MACD is -51.98, which is higher than the MACD Signal of -57.90. This indicates a potential bullish reversal as the MACD line is above the signal line, suggesting upward momentum in the stock price. However, these values are still in negative territory, indicating underlying bearish strength.
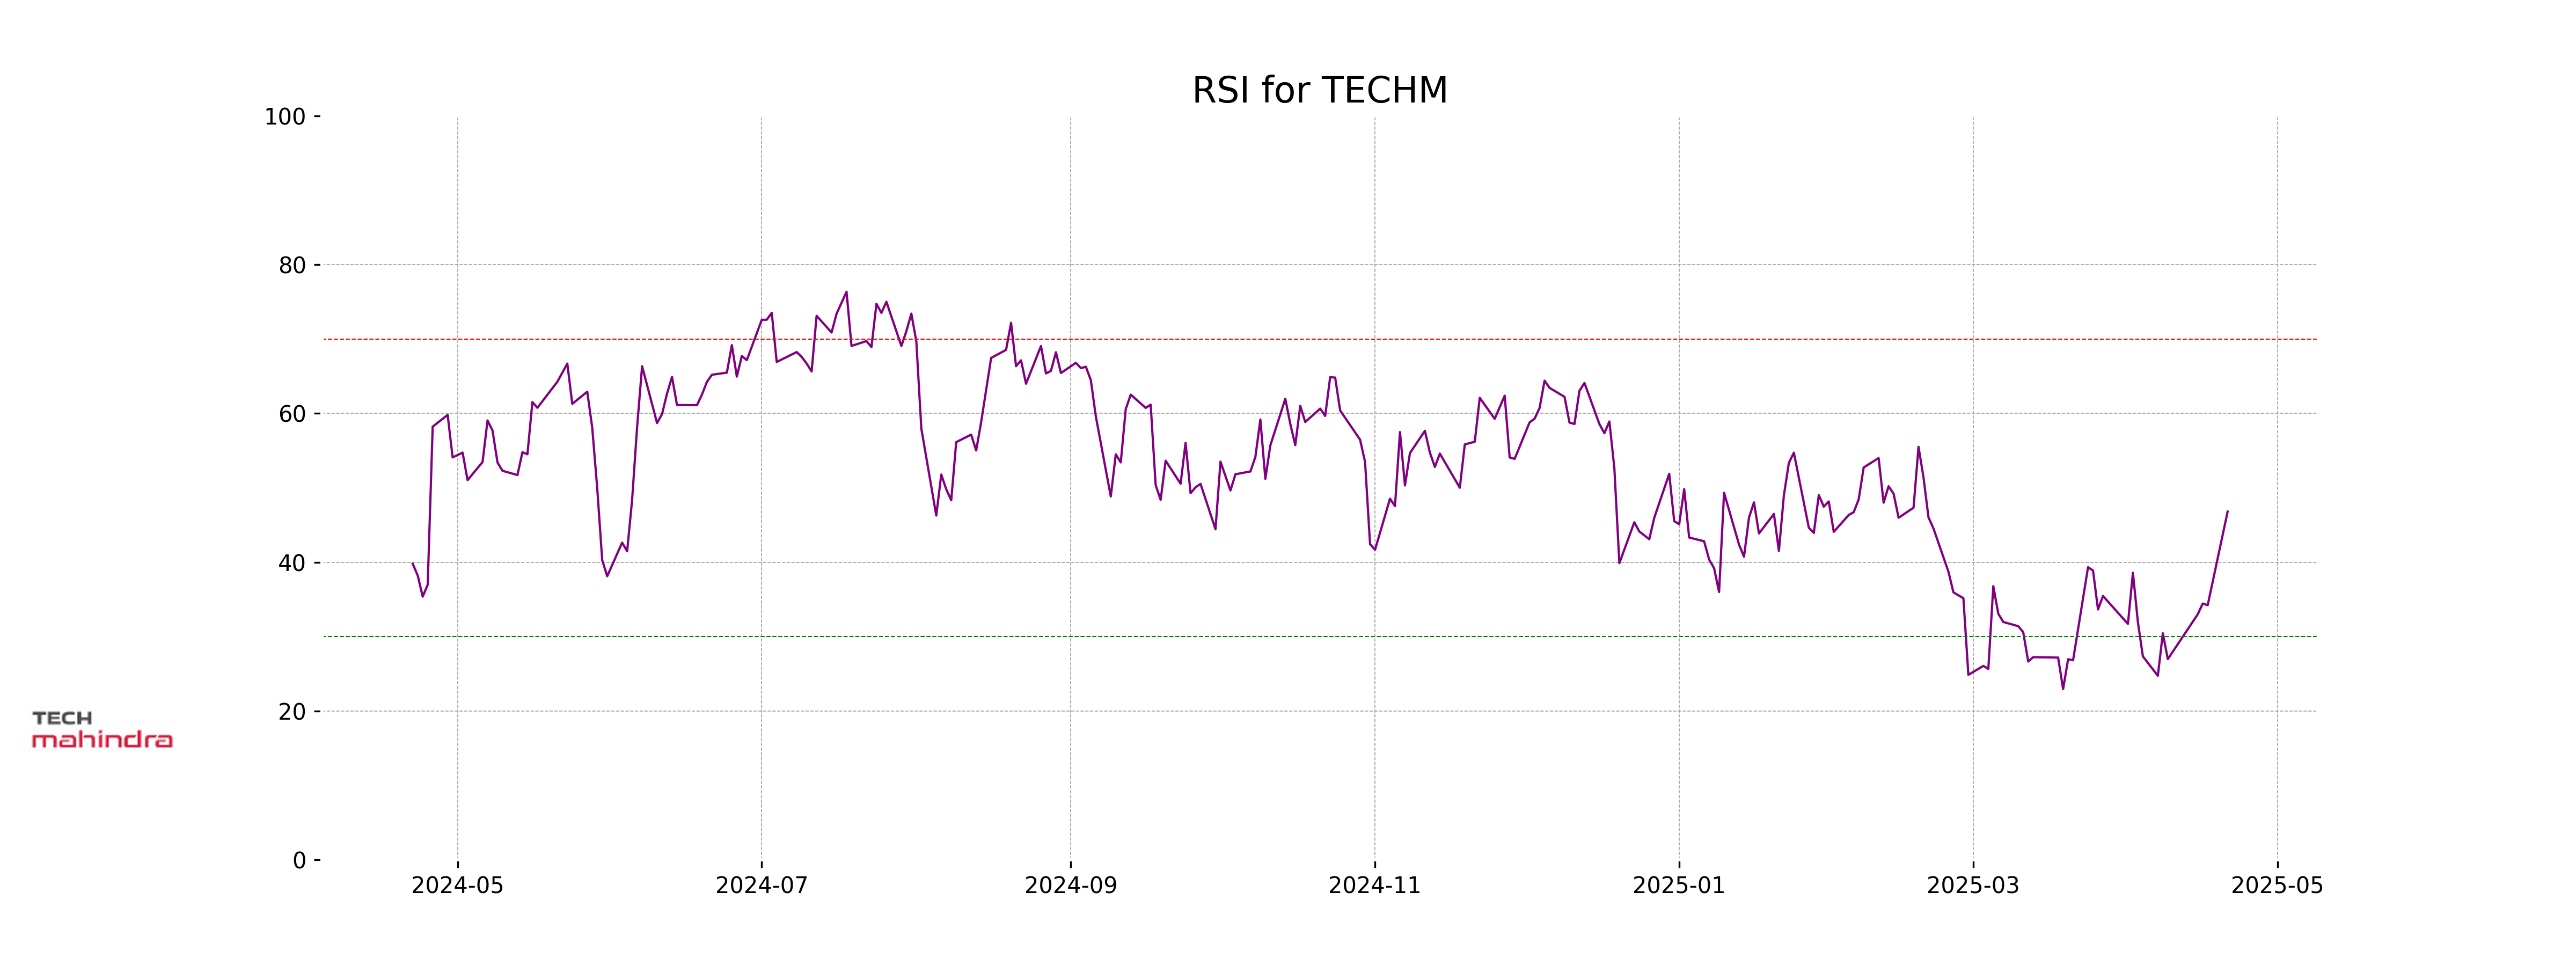
RSI Analysis
Tech Mahindra's RSI is at 46.81, which is generally considered a neutral level indicating the stock is neither overbought nor oversold. This suggests that there is no strong directional momentum, either bullish or bearish, at this time.
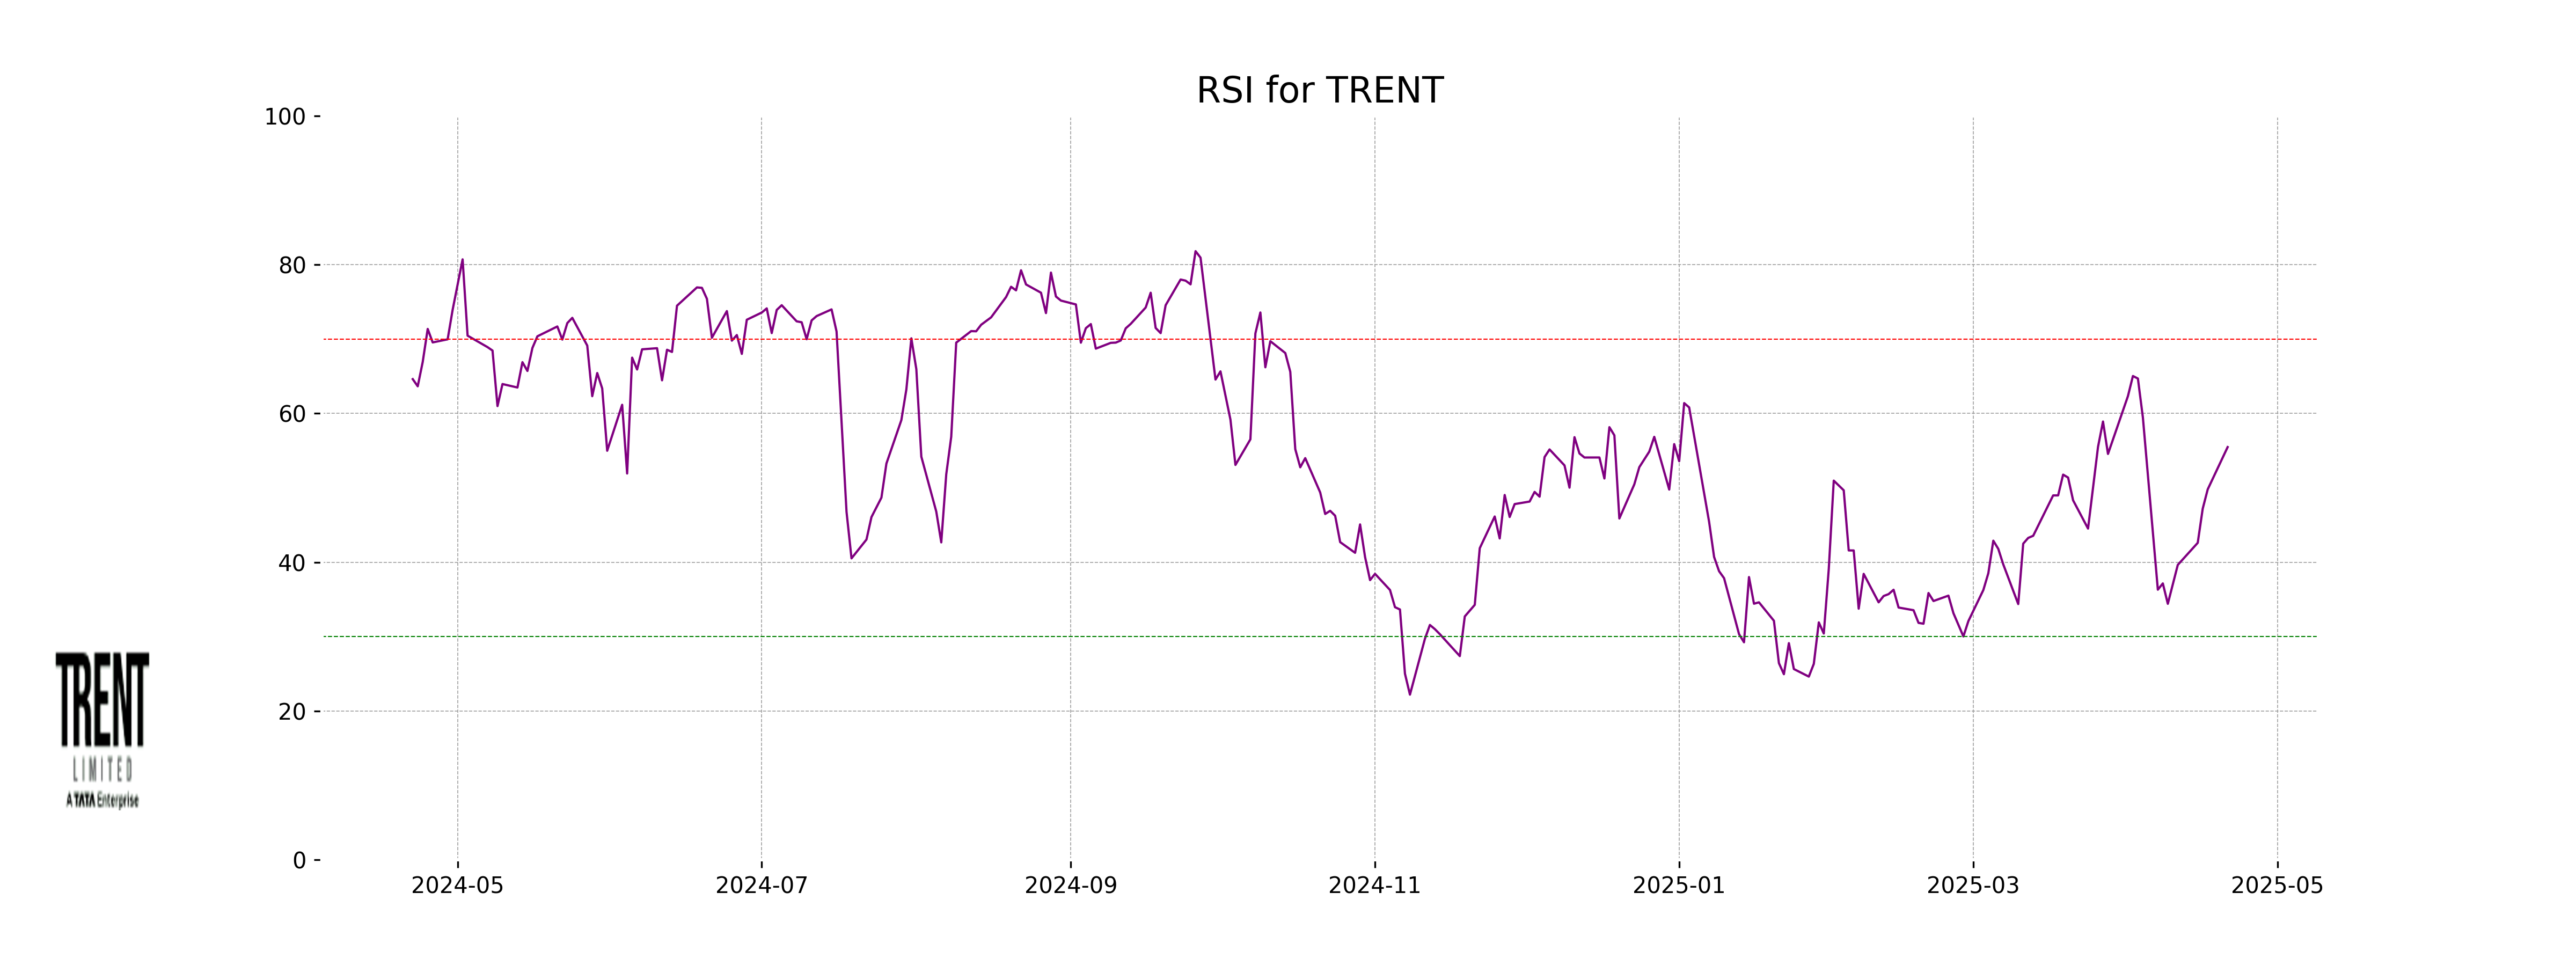
Analysis for Trent - April 21, 2025
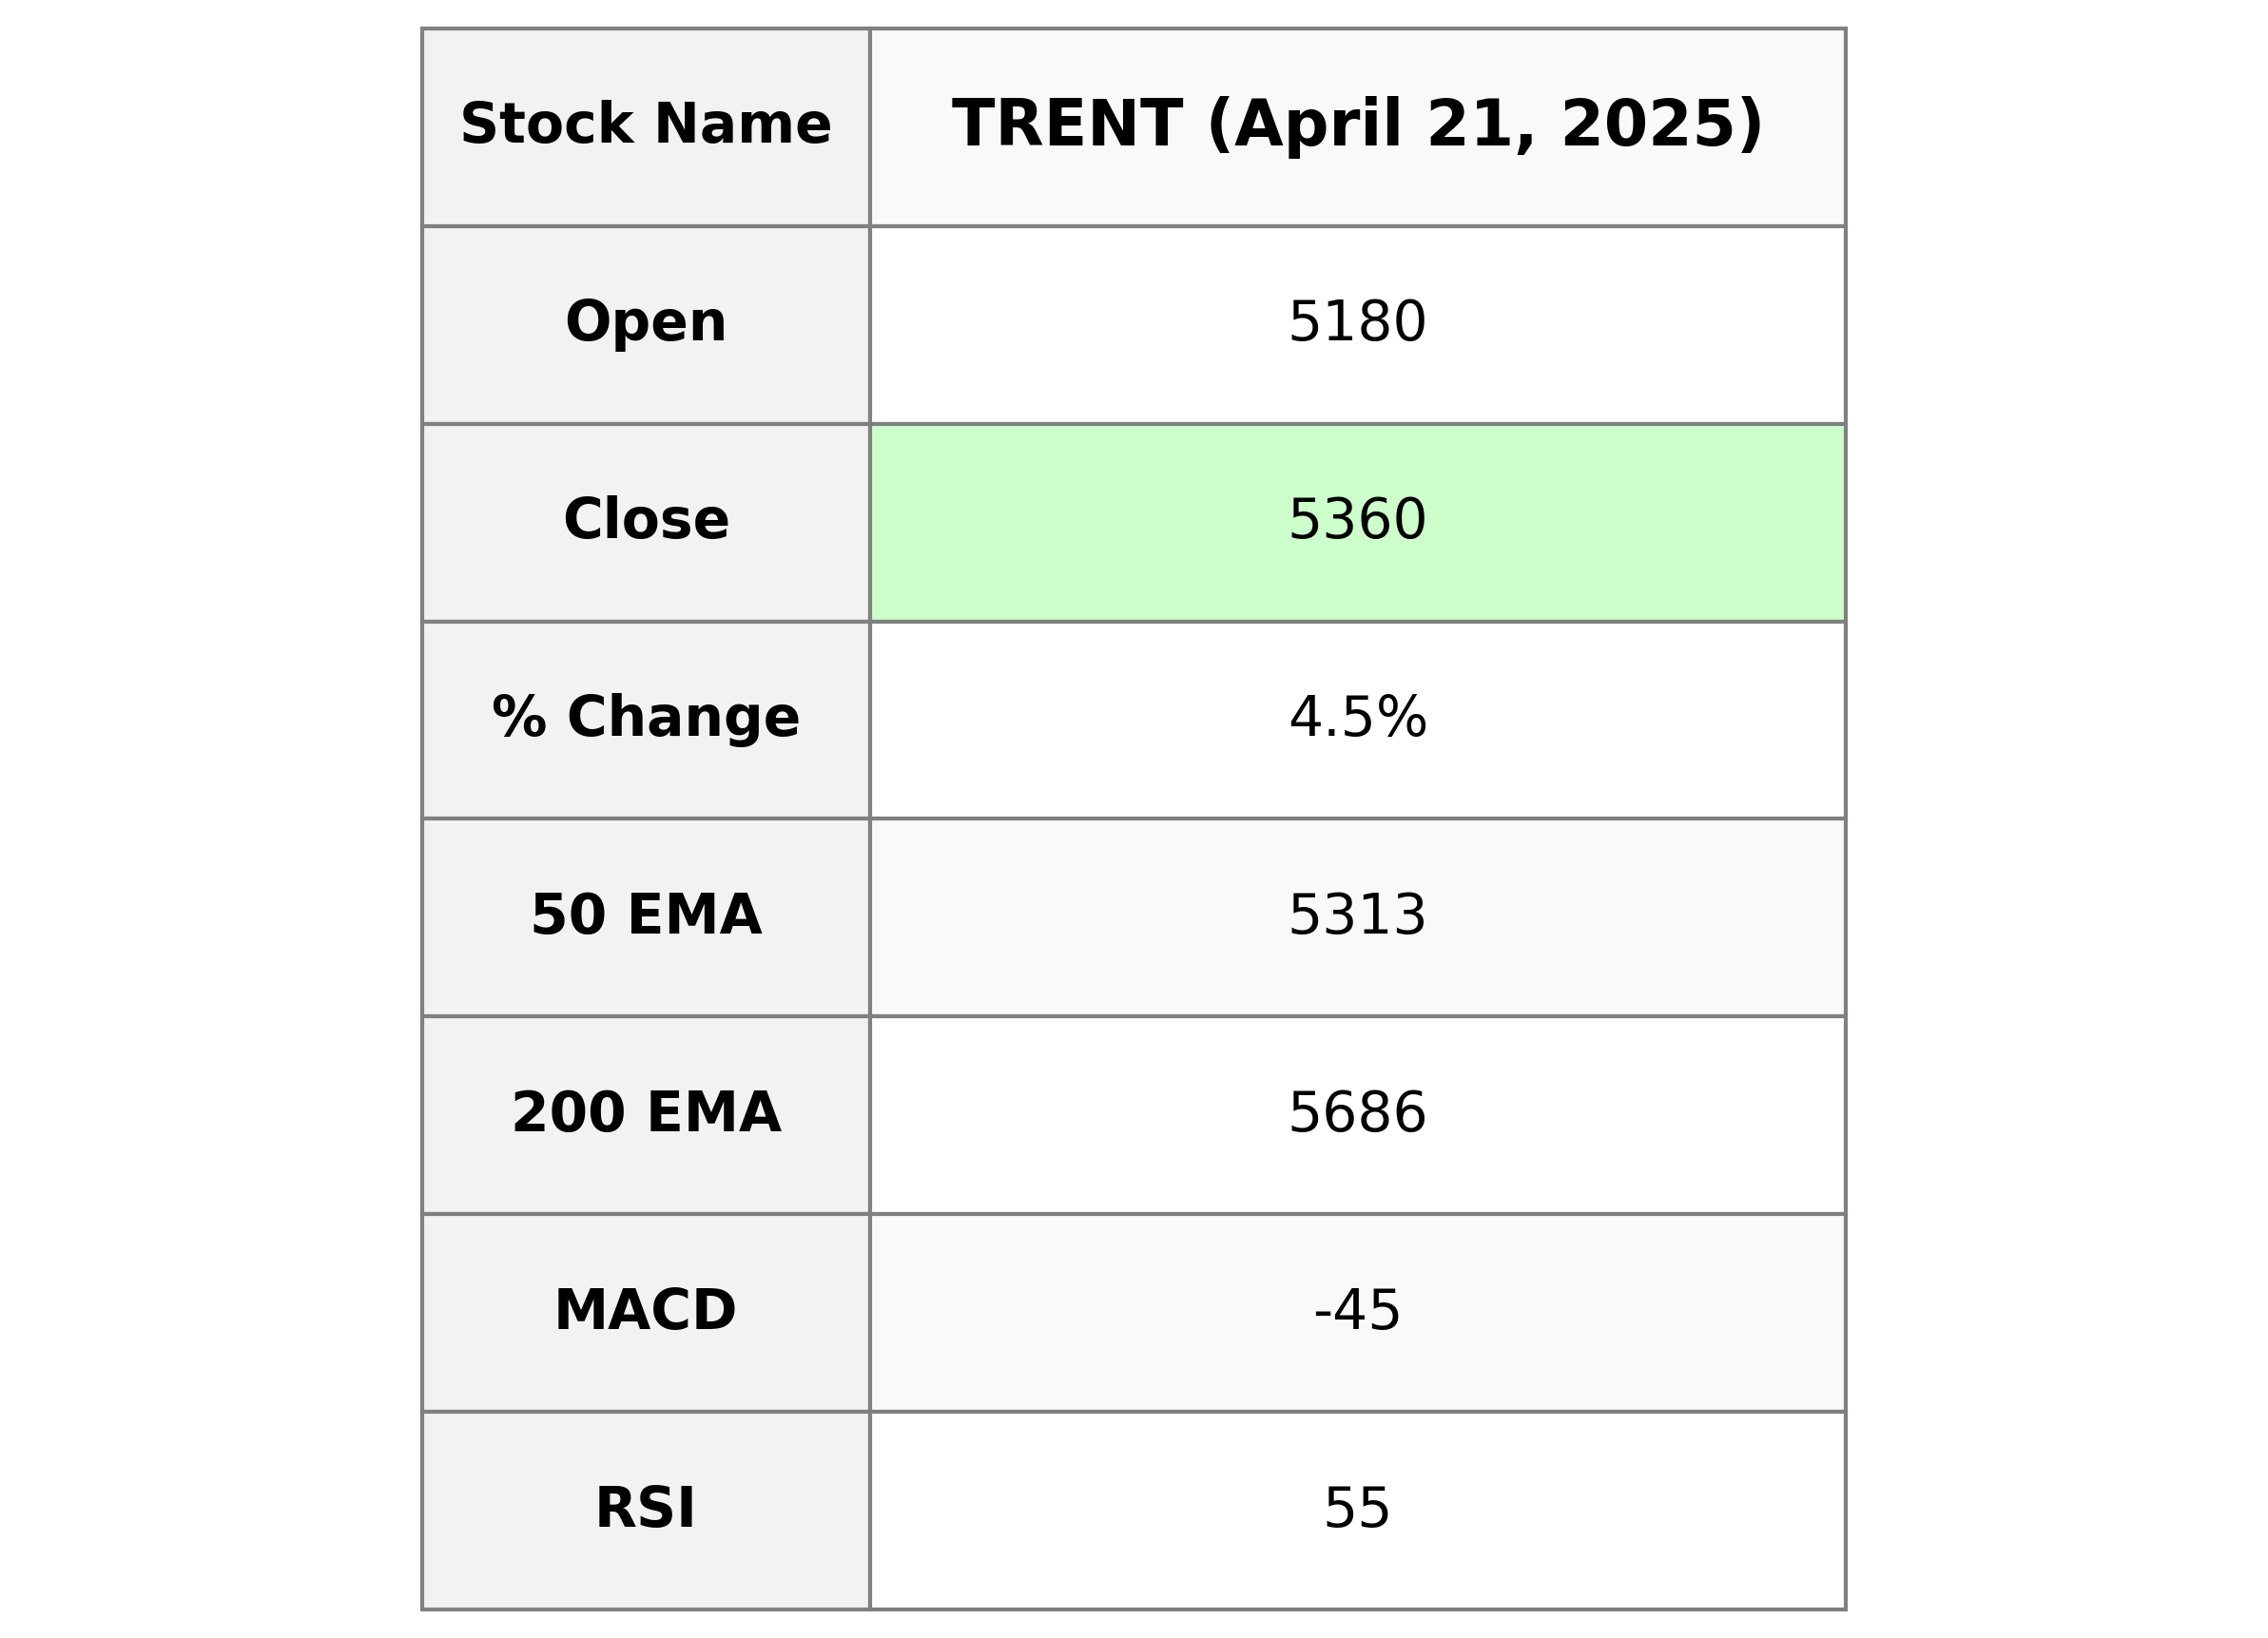
Trent Performance Summary: Trent, operating in the Consumer Cyclical sector and the Apparel Retail industry, showed a positive market performance with a closing price of 5360.0, marking a significant 4.47% increase from the previous close of 5130.5. The stock is currently trading above its 10 and 20 EMA but below the 50 and 200 EMA, indicating a short-term uptrend. The RSI of 55.48 suggests a neutral momentum. With a market cap of approximately 1.9 trillion INR and a PE Ratio of 98.57, Trent displays solid growth and investor interest.
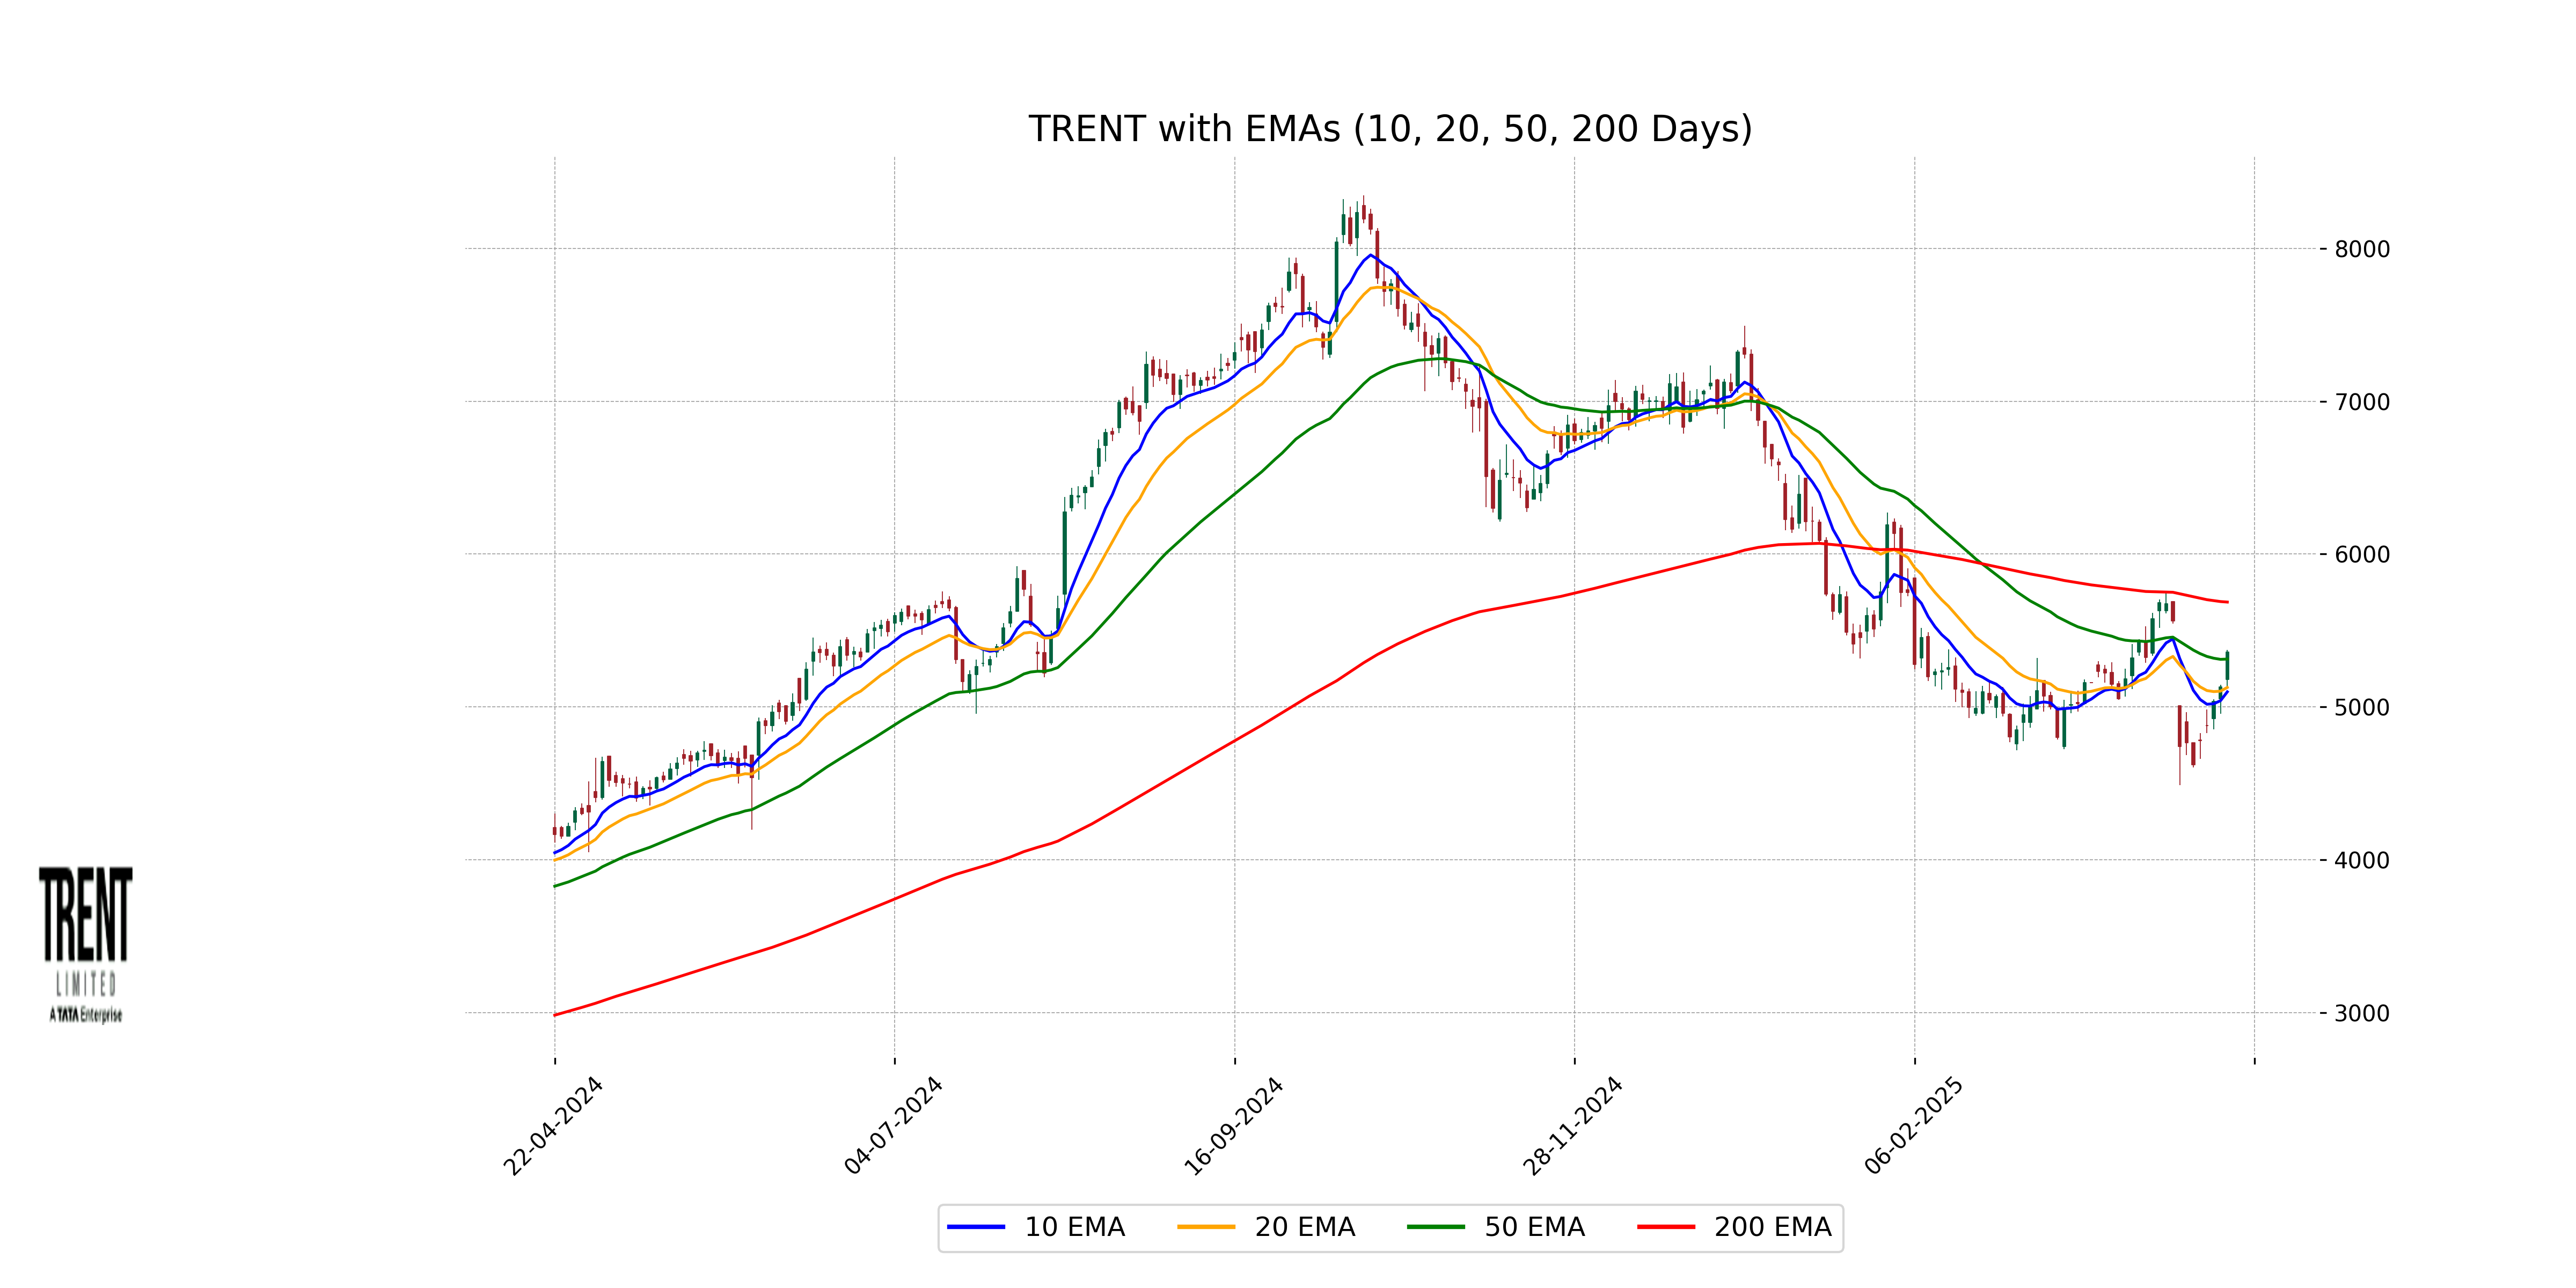
Relationship with Key Moving Averages
Trent closed at 5360.0, which is above its 10-day and 20-day EMAs of 5098.82 and 5127.61, indicating short-term bullish momentum. However, it remains below the 50-day EMA of 5313.12, which suggests it might face resistance around this level. Additionally, it is well below the 200-day EMA of 5685.91, reflecting potential long-term downward pressure.
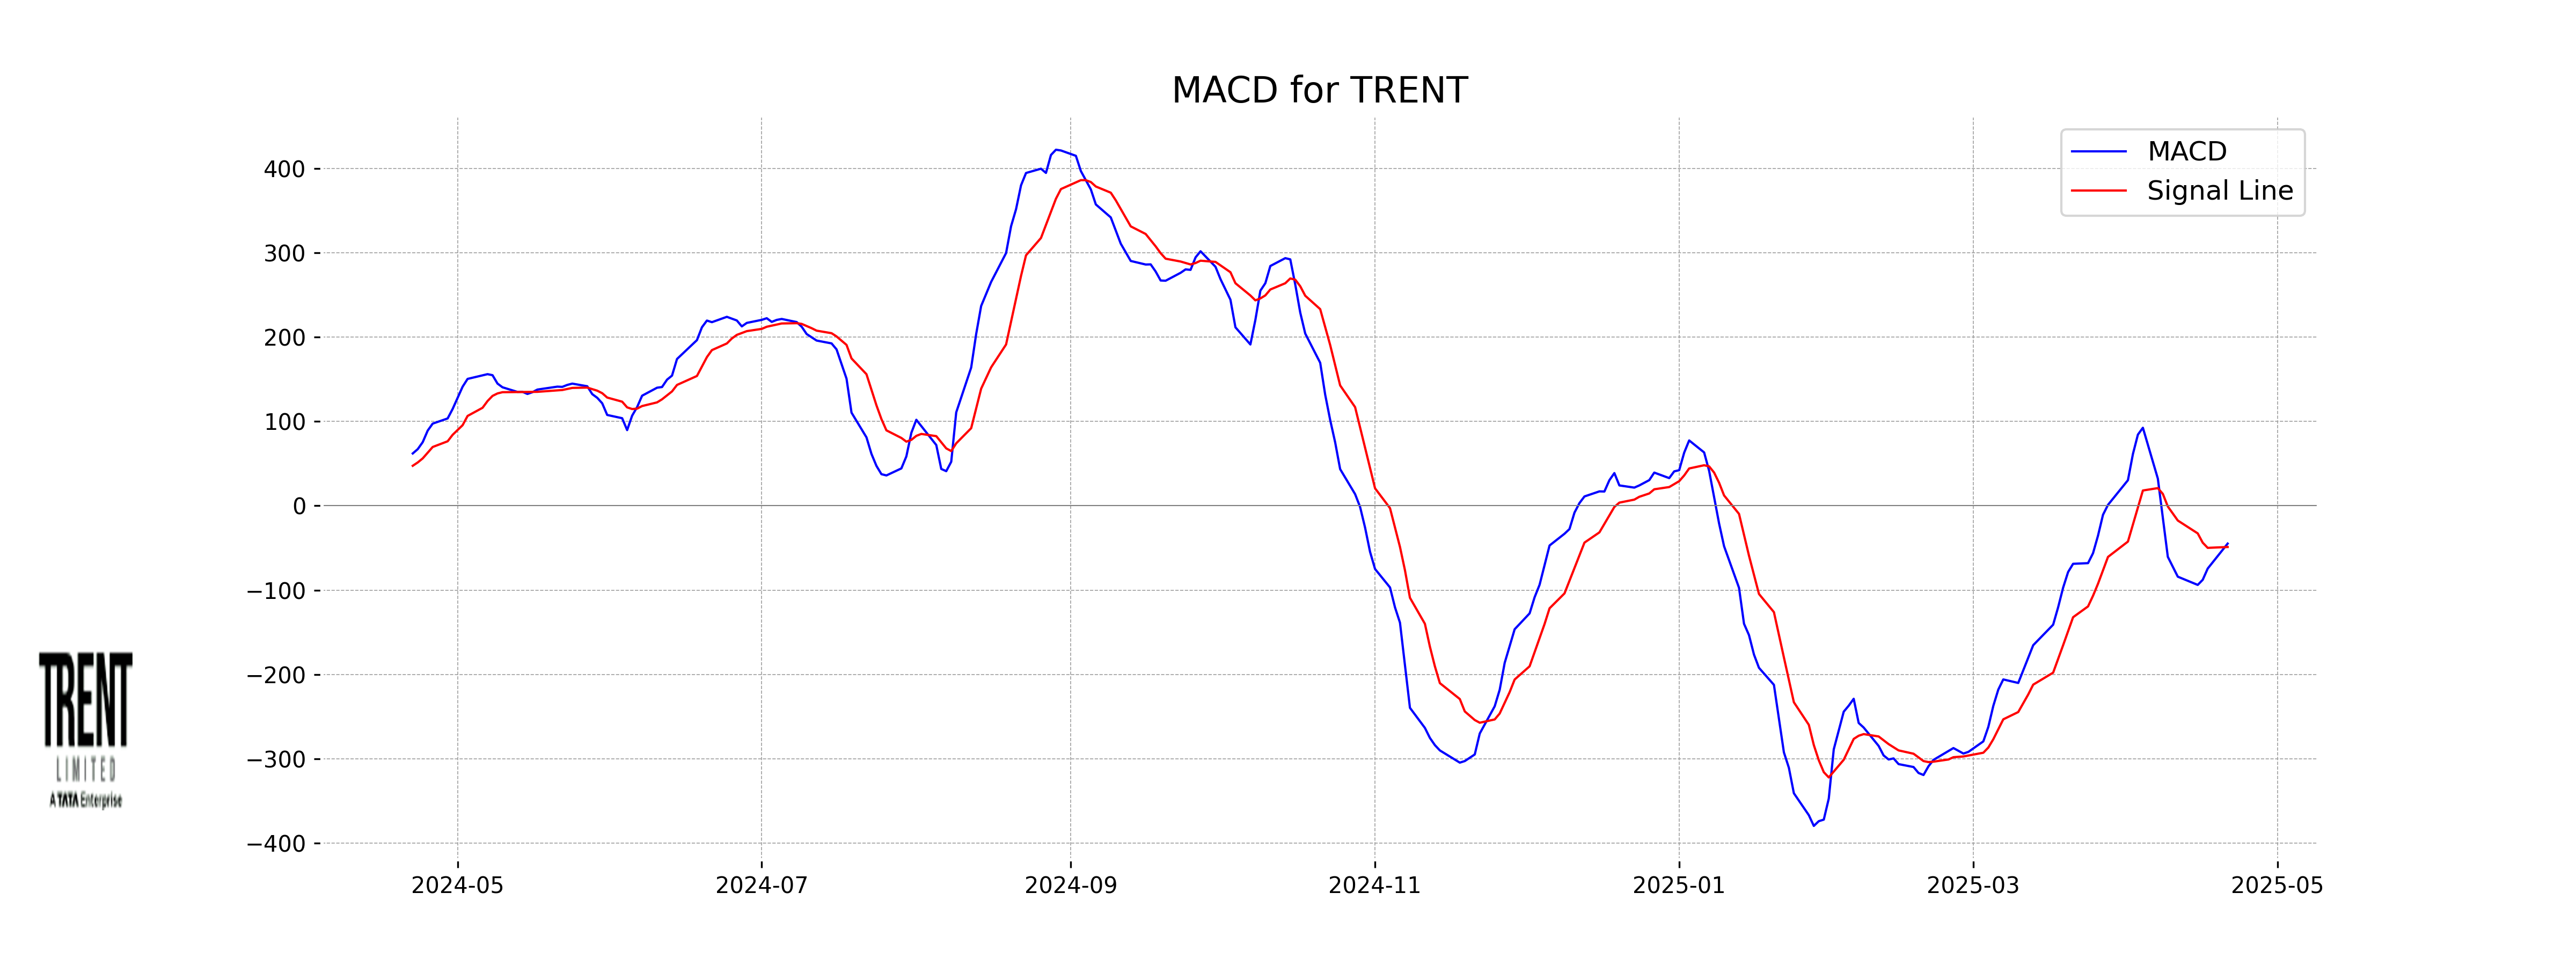
Moving Averages Trend (MACD)
Trent shows a MACD of -44.82, which is higher than the MACD Signal of -48.86, indicating a potential bullish crossover. This suggests that the stock may experience upward momentum if the trend continues. However, the negative MACD indicates that the stock has been in a bearish phase, so caution is advised.
RSI Analysis
Trent's RSI is currently at 55.48, indicating a neutral trend as it is near the midpoint of the RSI scale. This suggests that the stock is neither overbought nor oversold, presenting a relatively balanced momentum at present.
Up Next
Top 5 Nifty 50 gainers today – April 21, 2025: Biggest stock moves

Microsoft commits USD 17.5 billion investment in India: CEO Satya Nadella

CBI books Anil Ambani's son, Reliance Home Finance Ltd. in Rs 228 crore bank fraud case

RBI raises FY26 GDP growth projection to 7.3 pc

RBI trims policy interest rate by 25bps to 5.25pc, loans to get cheaper

Rupee slumps to all-time low of 90.25 against US dollar in intra-day trade

More videos

Reliance completes merger of Star Television Productions with Jiostar

India to lead emerging market growth with 7pc GDP rise in 2025: Moody’s

Nifty hits record high after 14 months; Sensex nears all-time peak

Reliance stops Russian oil use at its only-for-export refinery to comply with EU sanctions

ED attaches fresh assets worth over Rs 1,400 cr in case against Anil Ambani's Reliance Group

India signs one-year deal to import 2.2 million tonnes of LPG from US

India International Trade Fair begins at Pragati Maidan amid tight security

Stock markets decline in initial trade on foreign fund outflows, weak Asian peers

Amazon to lay off 30,000 office workers amid AI-driven cost cuts

US sanctions on Russian firms to hit Reliance; PSUs likely to keep buying Russian oil via traders