


Highlights
- Mixed signals within the Nifty 50
- ADANI and Bharti Airtel exhibit bullish tendencies
- Technical indicators provides insights into market trends, facilitating informed investment decisions
Latest news

Ashes 2025: Travis Head slams unbeaten 142 to crush England's Ashes hopes

Tipra Motha youth wing protests Bangladesh leader's anti-India remarks in Agartala

Bangladesh interim government condemns violence amid nationwide unrest

AAP holds review meeting in Navsari ahead of municipal corporation elections

Parliament concludes productive winter session; Rajya Sabha 121%, Lok Sabha 111%

AAP holds protest in Ahmedabad’s Naroda after demolition of houses, alleges lack of rehabilitation

AAP claims major win in Punjab local body polls; Gujarat unit sees momentum ahead of state elections

US Democrats release Epstein photos showing Bill Gates, Noam Chomsky
Top 5 Nifty 50 gainers today – February 11, 2025: Biggest stock moves


In this article, we will explore the technical indicators of some of the high-performing stocks on the Indian stock market, including ADANIENT, BHARTIARTL, GRASIM, and TRENT.
By looking at these stocks through the lens of key technical factors, we aim to better understand their price movements, trends, and potential future performance.

Analysis for Adani Enterprises - February 11, 2025

Adani Enterprises Ltd. experienced a positive performance with a closing price of 2321.75, reflecting a 1.35% increase from the previous close. The company's market capitalization stands at 2,679,717,232,640 INR, and it operates in the Energy sector, specifically in the Thermal Coal industry in India. With an RSI of 47.10, the stock is nearing neutral territory, while its MACD indicates a potential bearish trend.

Relationship with Key Moving Averages
Adani Enterprises closed at 2321.75, which is below its 50 EMA of 2425.31 and 200 EMA of 2724.76, indicating a bearish trend in comparison to these key moving averages. However, it closed slightly above its 10 EMA of 2311.31, suggesting some short-term momentum.
Moving Averages Trend (MACD)
Adani Enterprises' MACD is -34.16, indicating bearish momentum as it is below the MACD Signal line of -42.57. This suggests potential downward pressure in the stock price in the near term.

RSI Analysis
The Relative Strength Index (RSI) for Adani Enterprises is 47.10, which indicates a neutral position as it is relatively close to the midpoint of 50. This suggests that the stock is neither in an overbought nor oversold condition, implying a potential balance between buying and selling pressures.

Analysis for Bharti Airtel - February 11, 2025

**Bharti Airtel** Open: 1706.0 | High: 1706.65 | Low: 1686.20 | Close: 1696.75 Bharti Airtel witnessed a slight positive movement with a close at 1696.75, marking a 0.22% increase from the previous close. The company's market cap stands at 10.16 trillion INR, with a notable PE ratio of 41.24, reflecting strong investor interest in the telecom sector.

Relationship with Key Moving Averages
Bharti Airtel's current closing price of 1696.75 is above its 10 EMA (1660.25), 20 EMA (1643.85), and 50 EMA (1624.79), indicating a short-term bullish trend. Additionally, the price is well above the 200 EMA (1509.56), suggesting a strong long-term uptrend.
Moving Averages Trend (MACD)
Bharti Airtel's MACD value is 18.15, which is above its MACD Signal line of 11.90, indicating a bullish trend. This suggests strong momentum in the stock's recent upward price movement.

RSI Analysis
### RSI Analysis for Bharti Airtel The RSI (Relative Strength Index) for Bharti Airtel is 62.62, indicating that the stock is currently in a neutral to slightly overbought condition. Generally, an RSI above 70 is considered overbought, while below 30 is considered oversold. With an RSI of 62.62, Bharti Airtel is approaching the overbought threshold but remains in a relatively balanced position.

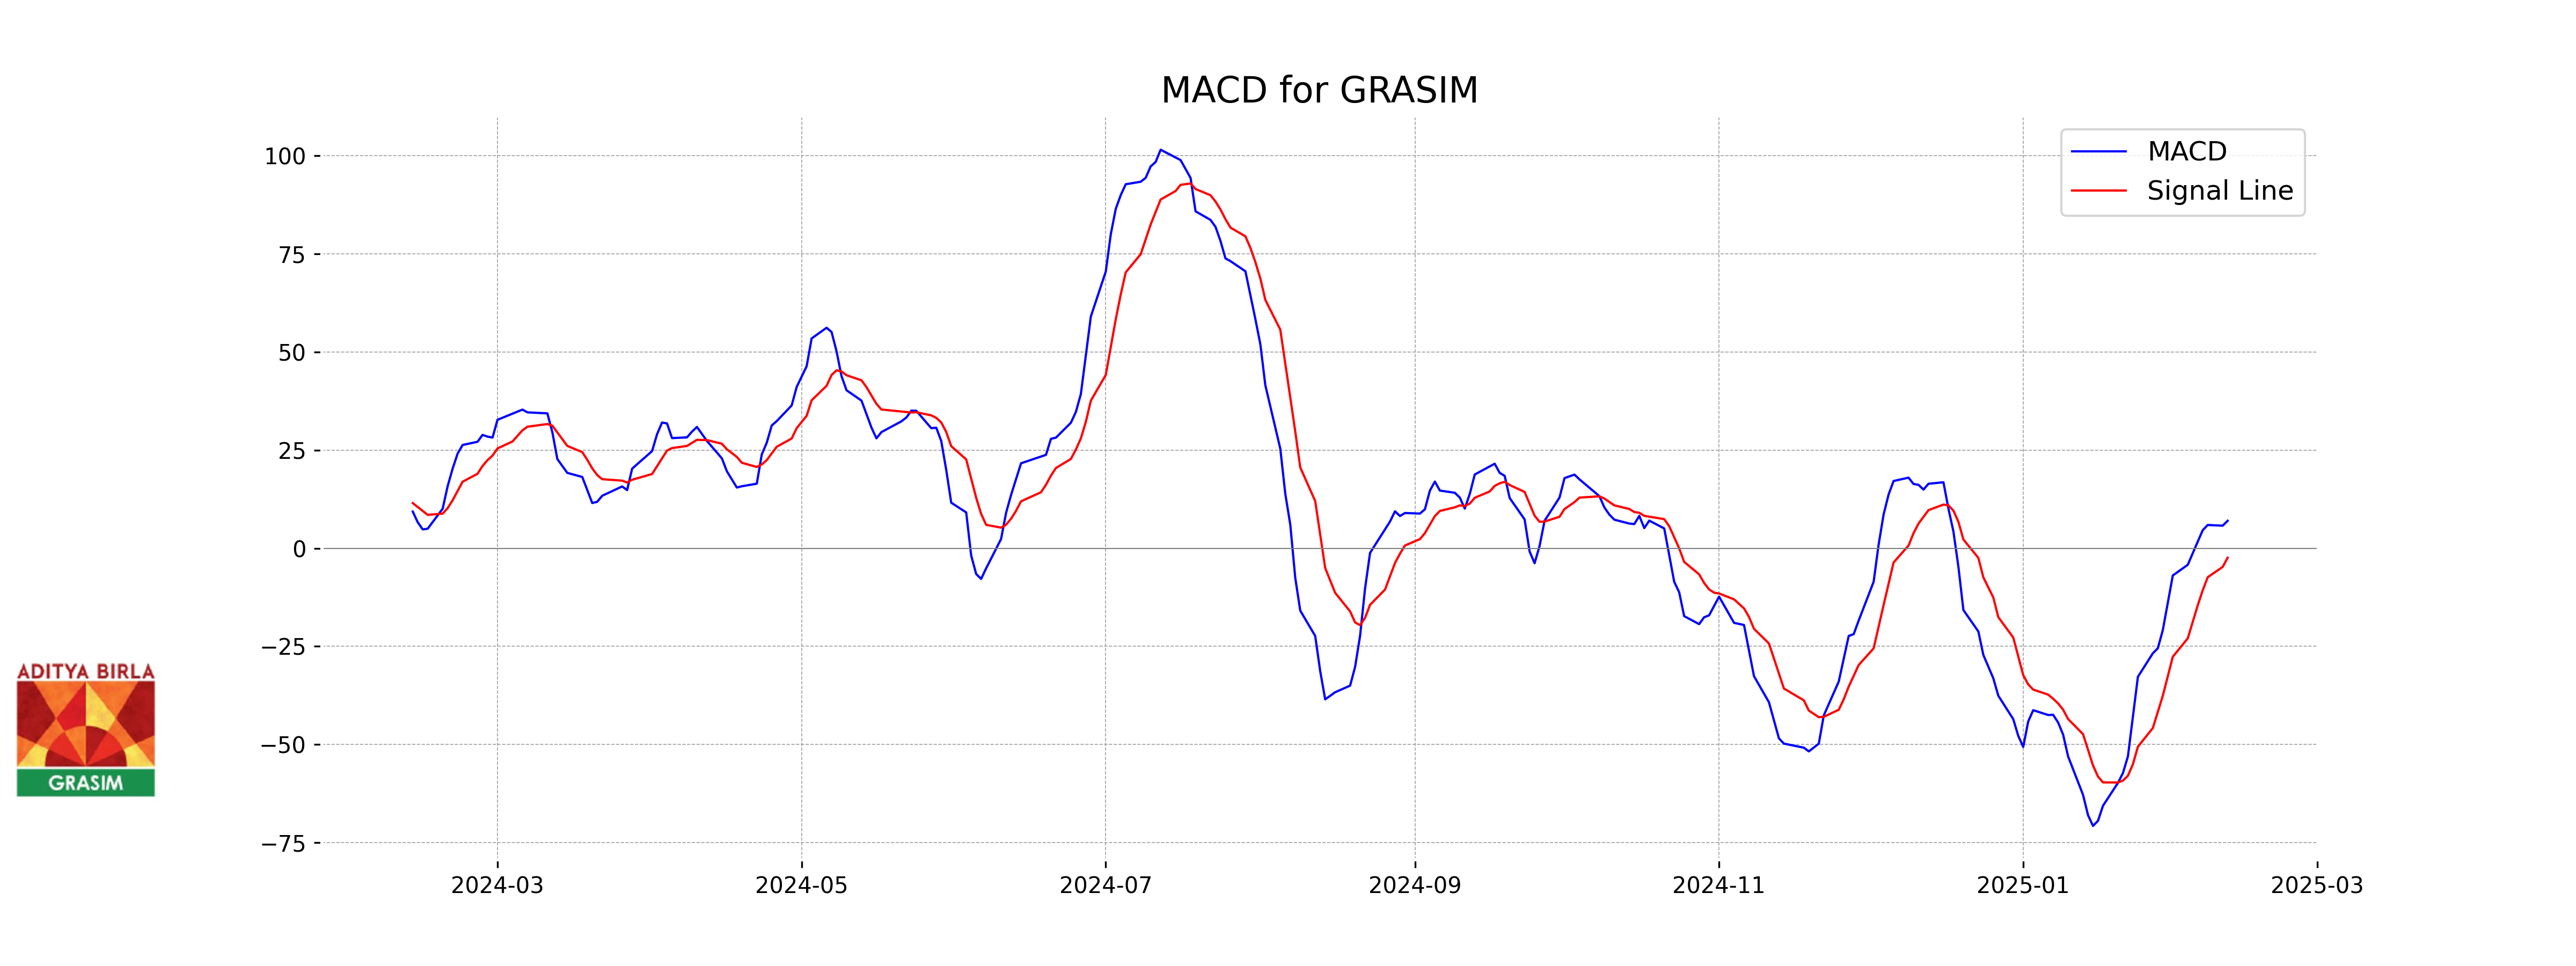
Analysis for Grasim Industries - February 11, 2025

**Grasim Industries** demonstrated a modest upward performance with a closing price of 2491.45, marking a 0.74% increase from the previous close. The stock's trading range showed some volatility, with a high of 2542.0 and a low of 2456.05. With a market cap exceeding 1.67 trillion INR, Grasim operates within the Basic Materials sector, specifically in Building Materials in India. The stock's technical indicators show an RSI of 53.59, indicating a neutral momentum, and a positive MACD of 6.99, suggesting a potential upward price movement.

Relationship with Key Moving Averages
Grasim Industries closed at 2491.45, which is slightly below its 50-day EMA of 2493.27 and 200-day EMA of 2498.39, indicating a potential resistance around these levels. However, the closing price is above the 10-day EMA of 2477.48 and 20-day EMA of 2465.55, suggesting short-term bullish momentum.
Moving Averages Trend (MACD)
Grasim Industries shows a positive MACD value of 6.994, indicating an upward momentum, as it is above the MACD signal line of -2.413. This suggests a potential bullish trend in the stock's price movement.
RSI Analysis
Grasim Industries has an RSI of 53.59, which suggests a neutral momentum, neither overbought nor oversold. This indicates that the stock might continue to trade within its current range without a significant directional move.

Analysis for Trent - February 11, 2025

**Trent** had a modest gain with its stock closing at 5228.35, marking a 0.61% increase over the previous close. The trading volume was notable at 1,596,309 shares. However, technical indicators like the RSI at 35.68 suggest potential undervaluation, while the MACD indicates a bearish trend.

Relationship with Key Moving Averages
The closing price of Trent at 5228.35 is below all key moving averages, with the 50 EMA at 6208.10, the 20 EMA at 5740.06, and the 10 EMA at 5504.00, suggesting a bearish trend. The RSI of 35.69 indicates it is approaching oversold conditions.
Moving Averages Trend (MACD)
The MACD value for Trent is -312.79, which is below its MACD Signal of -300.06. This suggests a bearish momentum, indicating that the stock may be experiencing a downtrend.

RSI Analysis
The current RSI value for Trent is 35.69, which suggests that the stock is approaching the oversold territory. This indicates that there might be a potential for a short-term rebound, but caution is advised as the overall sentiment could still be weak.

Up Next
Top 5 Nifty 50 gainers today – February 11, 2025: Biggest stock moves

Rupee breaches 91-mark against US dollar for first time in intra-day trade

Microsoft commits USD 17.5 billion investment in India: CEO Satya Nadella

CBI books Anil Ambani's son, Reliance Home Finance Ltd. in Rs 228 crore bank fraud case

RBI raises FY26 GDP growth projection to 7.3 pc

RBI trims policy interest rate by 25bps to 5.25pc, loans to get cheaper

More videos

Rupee slumps to all-time low of 90.25 against US dollar in intra-day trade

Reliance completes merger of Star Television Productions with Jiostar

India to lead emerging market growth with 7pc GDP rise in 2025: Moody’s

Nifty hits record high after 14 months; Sensex nears all-time peak

Reliance stops Russian oil use at its only-for-export refinery to comply with EU sanctions

ED attaches fresh assets worth over Rs 1,400 cr in case against Anil Ambani's Reliance Group

India signs one-year deal to import 2.2 million tonnes of LPG from US

India International Trade Fair begins at Pragati Maidan amid tight security

Stock markets decline in initial trade on foreign fund outflows, weak Asian peers

Amazon to lay off 30,000 office workers amid AI-driven cost cuts