


Highlights
- Sensex dipped by 1.22% with a significant point loss
- Nifty Metal sector fell sharply by 6.56%, a major drop
- Nifty FMCG stayed stable, with minimal change at 0.04%
Latest news

Pahalgam tragedy casts shadow on Indo-Pak cricket

MS Dhoni to play his 400th T20 match as CSK faces SRH

India stands tall amid tragedy: Piyush Goyal

ED raids Congress MLA Vinay Kulkarni's properties

VHP stages protest in Kolkata over Pahalgam attack

Kartarpur corridor stays open amid tensions

Hero and terrorist: The tale of two Adils in Pahalgam

Pahalgam survivor recalls horror, wife prays Shiva
Indian stock market sector-wise performance today - April 4, 2025


The stock market on Friday (April 4, 2025) witnessed a series of significant moves across various indices, reflecting a day of mixed performance among key sectors.
Among the notable indices, the benchmark BSE Sensex saw a downward trend, decreasing by 1.22%, ending the session at 75,364.69 points. This decline in the Sensex was echoed across several other indices, suggesting a broadly negative sentiment in the market.
One of the most affected sectors was Nifty Metal, which experienced a sharp decline of 6.56%. This left the sector considerably lower, closing at 8,414.45 points.
The heavy sell-off in the metal sector may be attributed to declining global commodity prices and concerns over a slowdown in infrastructure projects that typically boost metal demand.
Such declines can often be exacerbated by profit-taking activities following any prior rally or market correction. Nifty IT also faced significant pressure, dropping by 3.58%.
The IT sector's performance could be linked to weakening global technology demand and investors adjusting to recent earnings outlooks from leading technology firms.
Additionally, concerns regarding macroeconomic challenges such as currency fluctuations and cross-border trade restrictions might have weighed on the sector.
Similarly, the Nifty Energy index did not fare well, declining by 3.73%. Factors such as fluctuations in crude oil prices and regulatory changes may have contributed to this movement, impacting the profitability of energy companies.
On a brighter note, the Nifty FMCG index, although nearly flat, managed to eke out a minor gain, up by 0.04%, closing at 53,830.70 points. This slight increase in the FMCG sector suggests that consumer demand for daily essentials remains relatively resilient, providing a buffer against broader market negativity.
Nifty Bank held its ground better than others, facing only a modest decline of 0.18%. The banking sector's relative stability could be attributed to strong financial positions among leading banks and ongoing confidence in the sector's ability to weather economic uncertainties.
Overall, the downward trend in the various indices spotlighted investor concerns over ongoing global economic challenges, affecting sectors differently, with metals and IT experiencing more acute impacts.
The interplay between global news, domestic policy changes, and sector-specific events continues to shape market dynamics, necessitating careful analysis and response by investors.

Analysis for Sensex - April 04, 2025

Performance Summary for BSESN (Sensex): On the last trading day, the Sensex opened at 76160.09, reached a high of 76258.12, and closed down at 75364.69, marking a significant decline of -1.22% or a points change of -930.67 from the previous close of 76295.36. Technical indicators such as the RSI at 45.33 and the MACD slightly above its signal suggest the market is approaching oversold conditions, but momentum is weak.

Relationship with Key Moving Averages
Sensex closed below its 10 and 50-day EMAs, suggesting short-term bearish momentum. The index is also positioned beneath the 200-day EMA, indicating potential long-term downward pressure.
Moving Averages Trend (MACD)
The MACD for Sensex is slightly above the signal line (285.38 vs. 283.44), indicating a potential bullish signal. However, the overall trend seems to be weakening, with the close price falling below key EMAs and a declining RSI.

RSI Analysis
The RSI (Relative Strength Index) for Sensex is at 45.33, which suggests that the stock index is neither in the overbought nor oversold territory. Typically, RSI values below 30 indicate oversold conditions, while values above 70 suggest overbought conditions. Hence, the current RSI level indicates a neutral momentum.

Analysis for Nifty Auto - April 04, 2025

Nifty Auto opened at 21081.05, reached a high of the same, and had a low of 20507.55, closing at 20593.15. The index experienced a decrease of 2.70% with a points change of -570.85 from the previous close of 21164. The RSI is at 36.61, indicating a bearish trend, while the MACD is slightly below the signal line, reinforcing the negative sentiment.

Relationship with Key Moving Averages
The Nifty Auto index closed below its key moving averages, with the 10 EMA at 21225.93 and the 20 EMA at 21306.46, both above the current close of 20593.15, indicating a bearish trend. Additionally, the 50 EMA at 21745.53 and the 200 EMA at 22685.79 further underscore the sustained downward momentum.
Moving Averages Trend (MACD)
Based on the data provided, Nifty Auto's MACD is at -131.24, which is below the MACD Signal of -123.04. This indicates a bearish momentum, suggesting that the stock is likely experiencing a downtrend. Additionally, the RSI of 36.61 further supports this bearish sentiment, as it is below the neutral 50 level, moving towards oversold territory.

RSI Analysis
The RSI for Nifty Auto is 36.61, which indicates that the index is approaching an oversold condition. Typically, an RSI below 30 is considered oversold, suggesting potential buying opportunities. However, as it remains above 30, careful monitoring is advised for further confirmation of any potential trend reversals.

Analysis for Nifty Energy - April 04, 2025

Nifty Energy experienced a decline, closing at 32308.90, down from its previous close of 33559.80, resulting in a percentage change of -3.73%. The index's recent performance shows a notable drop in points, -1250.90, with a low RSI of 46.80, suggesting bearish momentum.

Relationship with Key Moving Averages
The Nifty Energy index closed at 32,308.90, which is below its 50-day EMA of 32,868.84 and 10-day EMA of 33,078.86, indicating a short-term bearish trend. Additionally, the index is significantly below its 200-day EMA of 35,781.15, suggesting longer-term weakness in comparison to the averages.
Moving Averages Trend (MACD)
Nifty Energy's MACD value of 368.65 is above the MACD Signal line value of 345.11, suggesting a potential bullish signal. However, the Percent Change indicates a decline, and traders may consider other indicators before making decisions.

RSI Analysis
Nifty Energy's RSI is currently at 46.80, indicating a neutral momentum. It is not in overbought or oversold territory, suggesting a balance between buying and selling pressures.

Analysis for Nifty FMCG - April 04, 2025

Nifty FMCG opened at 53,603.70, reaching a high of 54,223.35 and a low of 53,310.00 before closing at 53,830.70. The index saw a minor gain with a 0.04% increase from the previous close, indicating a positive but subdued trading session. The RSI stands at 60.10, suggesting a neutral to slightly bullish sentiment.

Relationship with Key Moving Averages
The Nifty FMCG index closed at 53,830.70, which is above its 10 EMA of 53,333.14 and 50 EMA of 53,610.93, indicating short and medium-term bullish momentum. However, it is below the 200 EMA of 56,142.67, suggesting that it is still in a longer-term bearish trend.
Moving Averages Trend (MACD)
The MACD value for Nifty FMCG is 191.77, which is above the MACD Signal of -39.52, indicating a bullish trend. The positive MACD suggests that the stock may have upward momentum, but it's important to consider other indicators and market conditions for a comprehensive analysis.

RSI Analysis
The RSI for Nifty FMCG is 60.10, which indicates a moderately strong buying momentum. This suggests that the stock is neither in overbought nor oversold territory, providing potential room for upward movement while also needing cautious observation for any trend reversals.

Analysis for Nifty Infra - April 04, 2025

Nifty Infra opened at 8448.40, with a high of 8451.00 and a low of 8207.05, closing at 8231.65. It experienced a decrease of -2.64% or -223.5 points from the previous close of 8455.15. The index's moving averages indicate a trend where the current price is slightly below the 50-day EMA of 8224.36 but above the 200-day EMA of 8403.63, suggesting recent downward momentum. The RSI stands at 50.10, indicating a neutral market sentiment.

Relationship with Key Moving Averages
Nifty Infra closed at 8231.65, which is close to its 50 EMA of 8224.36 but significantly below the 200 EMA of 8403.63. This suggests the recent price action has moved it near short-term support but well below its longer-term trend, indicating potential bearish momentum.
Moving Averages Trend (MACD)
Nifty Infra MACD Analysis: The MACD value of 99.89 is higher than its signal line, which is at 89.58. This indicates a bullish momentum in the short-term despite the negative daily change, suggesting potential upward movement.

RSI Analysis
Based on the provided data, the RSI for Nifty Infra is 50.10, indicating a neutral momentum. This suggests that the stock is neither overbought nor oversold, reflecting a potential balance between buying and selling pressures at this time.

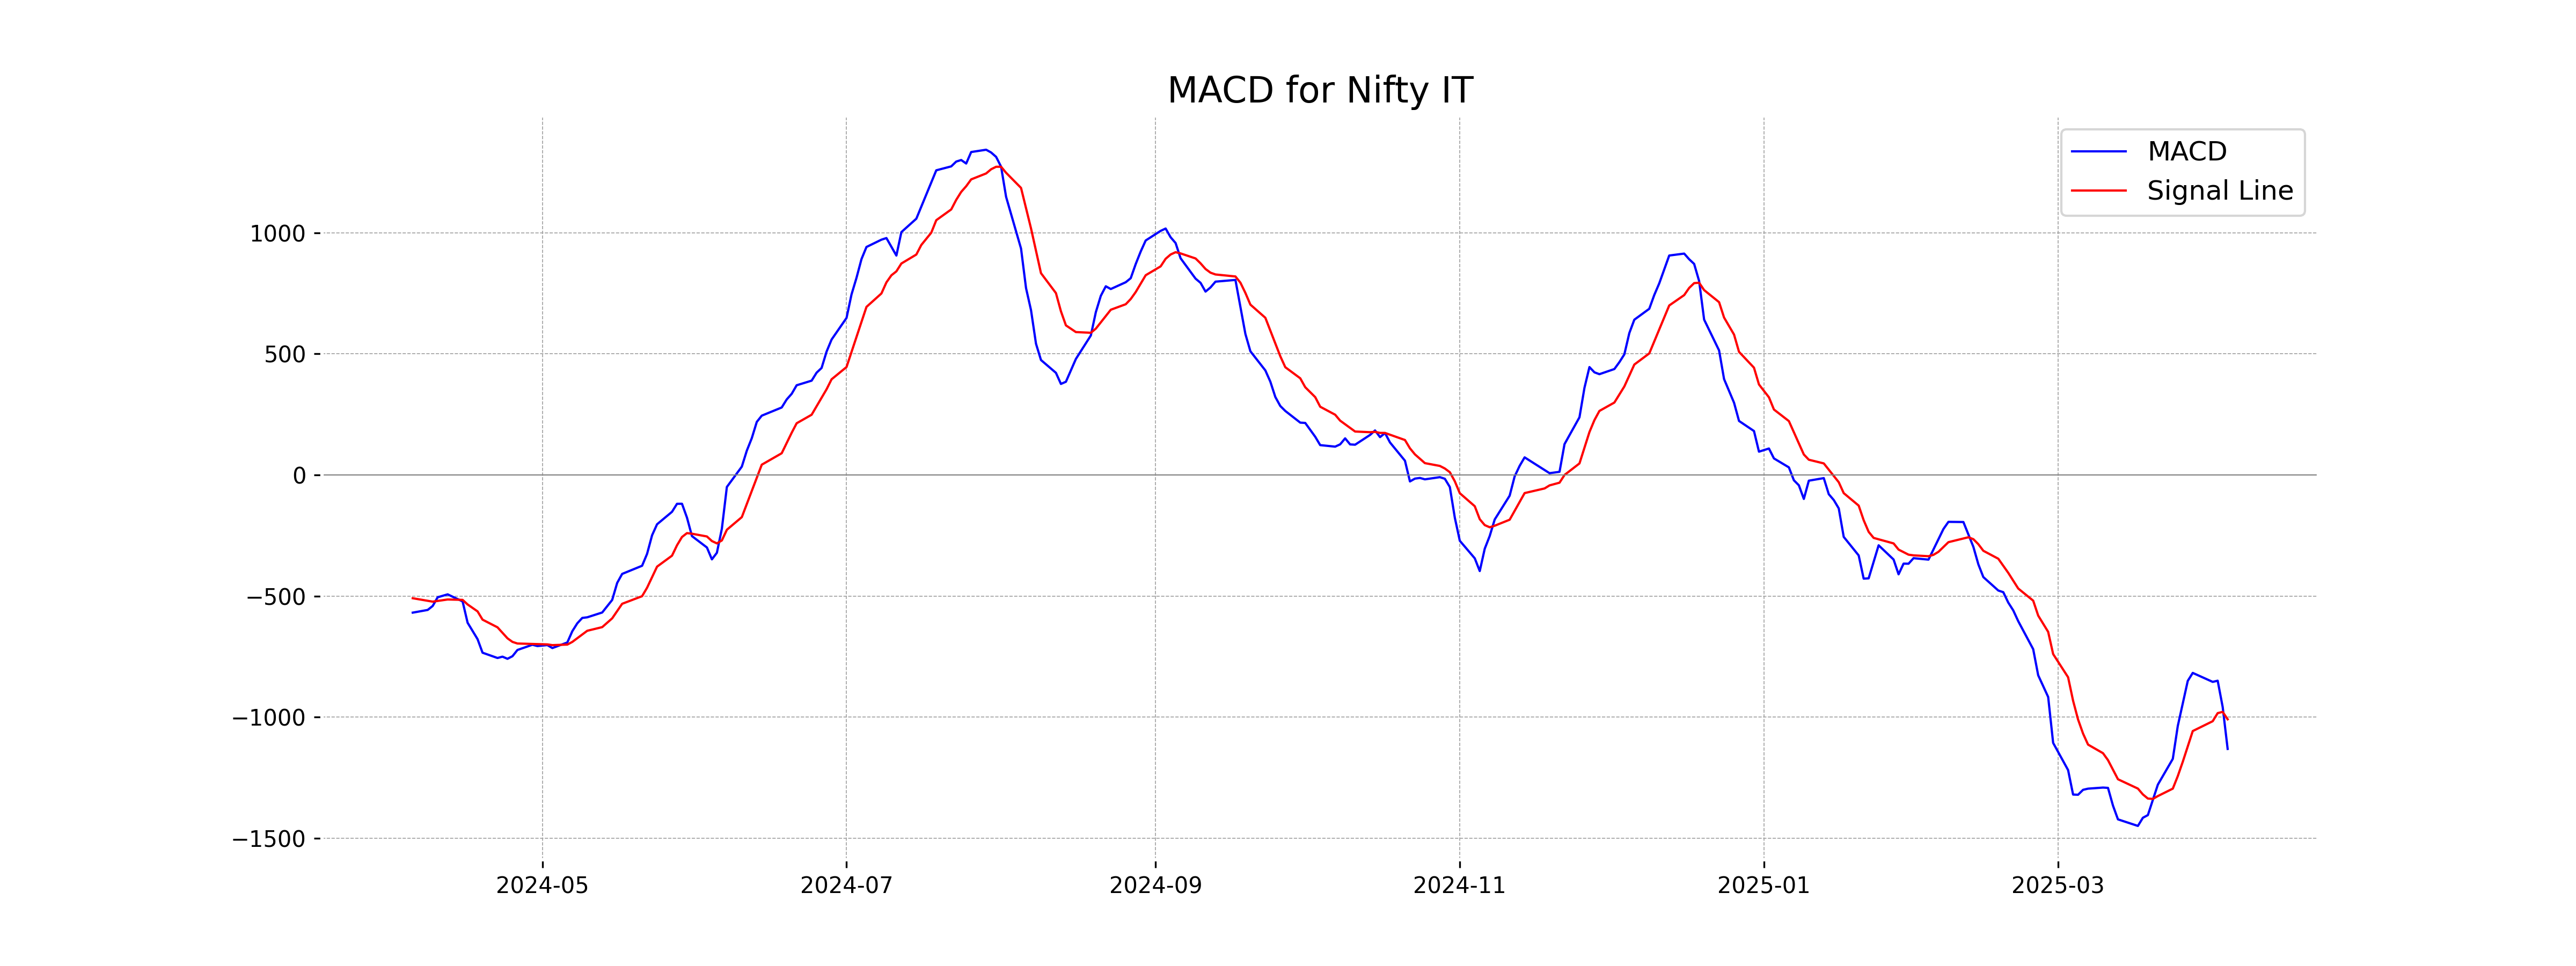
Analysis for Nifty IT - April 04, 2025

Nifty IT index opened at 34224.60 and closed at 33511.40, showing a decline of 3.58% from the previous close of 34757.25. The index experienced a points change of -1245.85 with a low RSI of 24.20 indicating an oversold condition. The MACD of -1130.76 compared to the signal line -1008.45 suggests a bearish momentum.

Relationship with Key Moving Averages
Nifty IT closed at 33,511.40, which is below key moving averages, including the 10-day EMA at 35,911.27, the 20-day EMA at 36,765.56, the 50-day EMA at 38,727.31, and the 200-day EMA at 39,864.30, indicating a bearish trend in the short to medium term.
Moving Averages Trend (MACD)
MACD Analysis for Nifty IT: The MACD line is significantly below the MACD Signal line, indicating a bearish momentum. With the MACD at -1130.76 and the Signal at -1008.45, the downward trend appears to be strong.
RSI Analysis
The RSI for Nifty IT is 24.20, which typically indicates that the index is in oversold territory. This suggests that the recent selling may have been excessive, and a potential reversal or stabilization might be anticipated.

Analysis for Nifty Metal - April 04, 2025

Nifty Metal experienced a decline as it closed at 8414.45, down -6.56% from its previous close of 9005.15, with a significant points change of -590.70. The index saw a high of 8945.5 and a low of 8375.35 during the trading session. The RSI indicates a relatively weak momentum at 36.30, suggesting it is nearing oversold territory.

Relationship with Key Moving Averages
The Nifty Metal index closed at 8414.45, which is below its 10-day EMA of 8941.51, 20-day EMA of 8909.72, 50-day EMA of 8778.41, and 200-day EMA of 8823.62. This indicates a bearish trend in comparison to its key moving averages.
Moving Averages Trend (MACD)
The MACD value for Nifty Metal is 79.29, while the MACD Signal is 145.71. This indicates a bearish momentum as the MACD line is below the MACD Signal line, suggesting potential for continued downward pressure in this sector.

RSI Analysis
The RSI for Nifty Metal is 36.30, indicating that the index is approaching oversold territory. Generally, an RSI below 30 suggests an asset may be undervalued, so the index is nearing this level. Traders often monitor such signals for potential buying opportunities or corrections.

Analysis for Nifty Bank - April 04, 2025
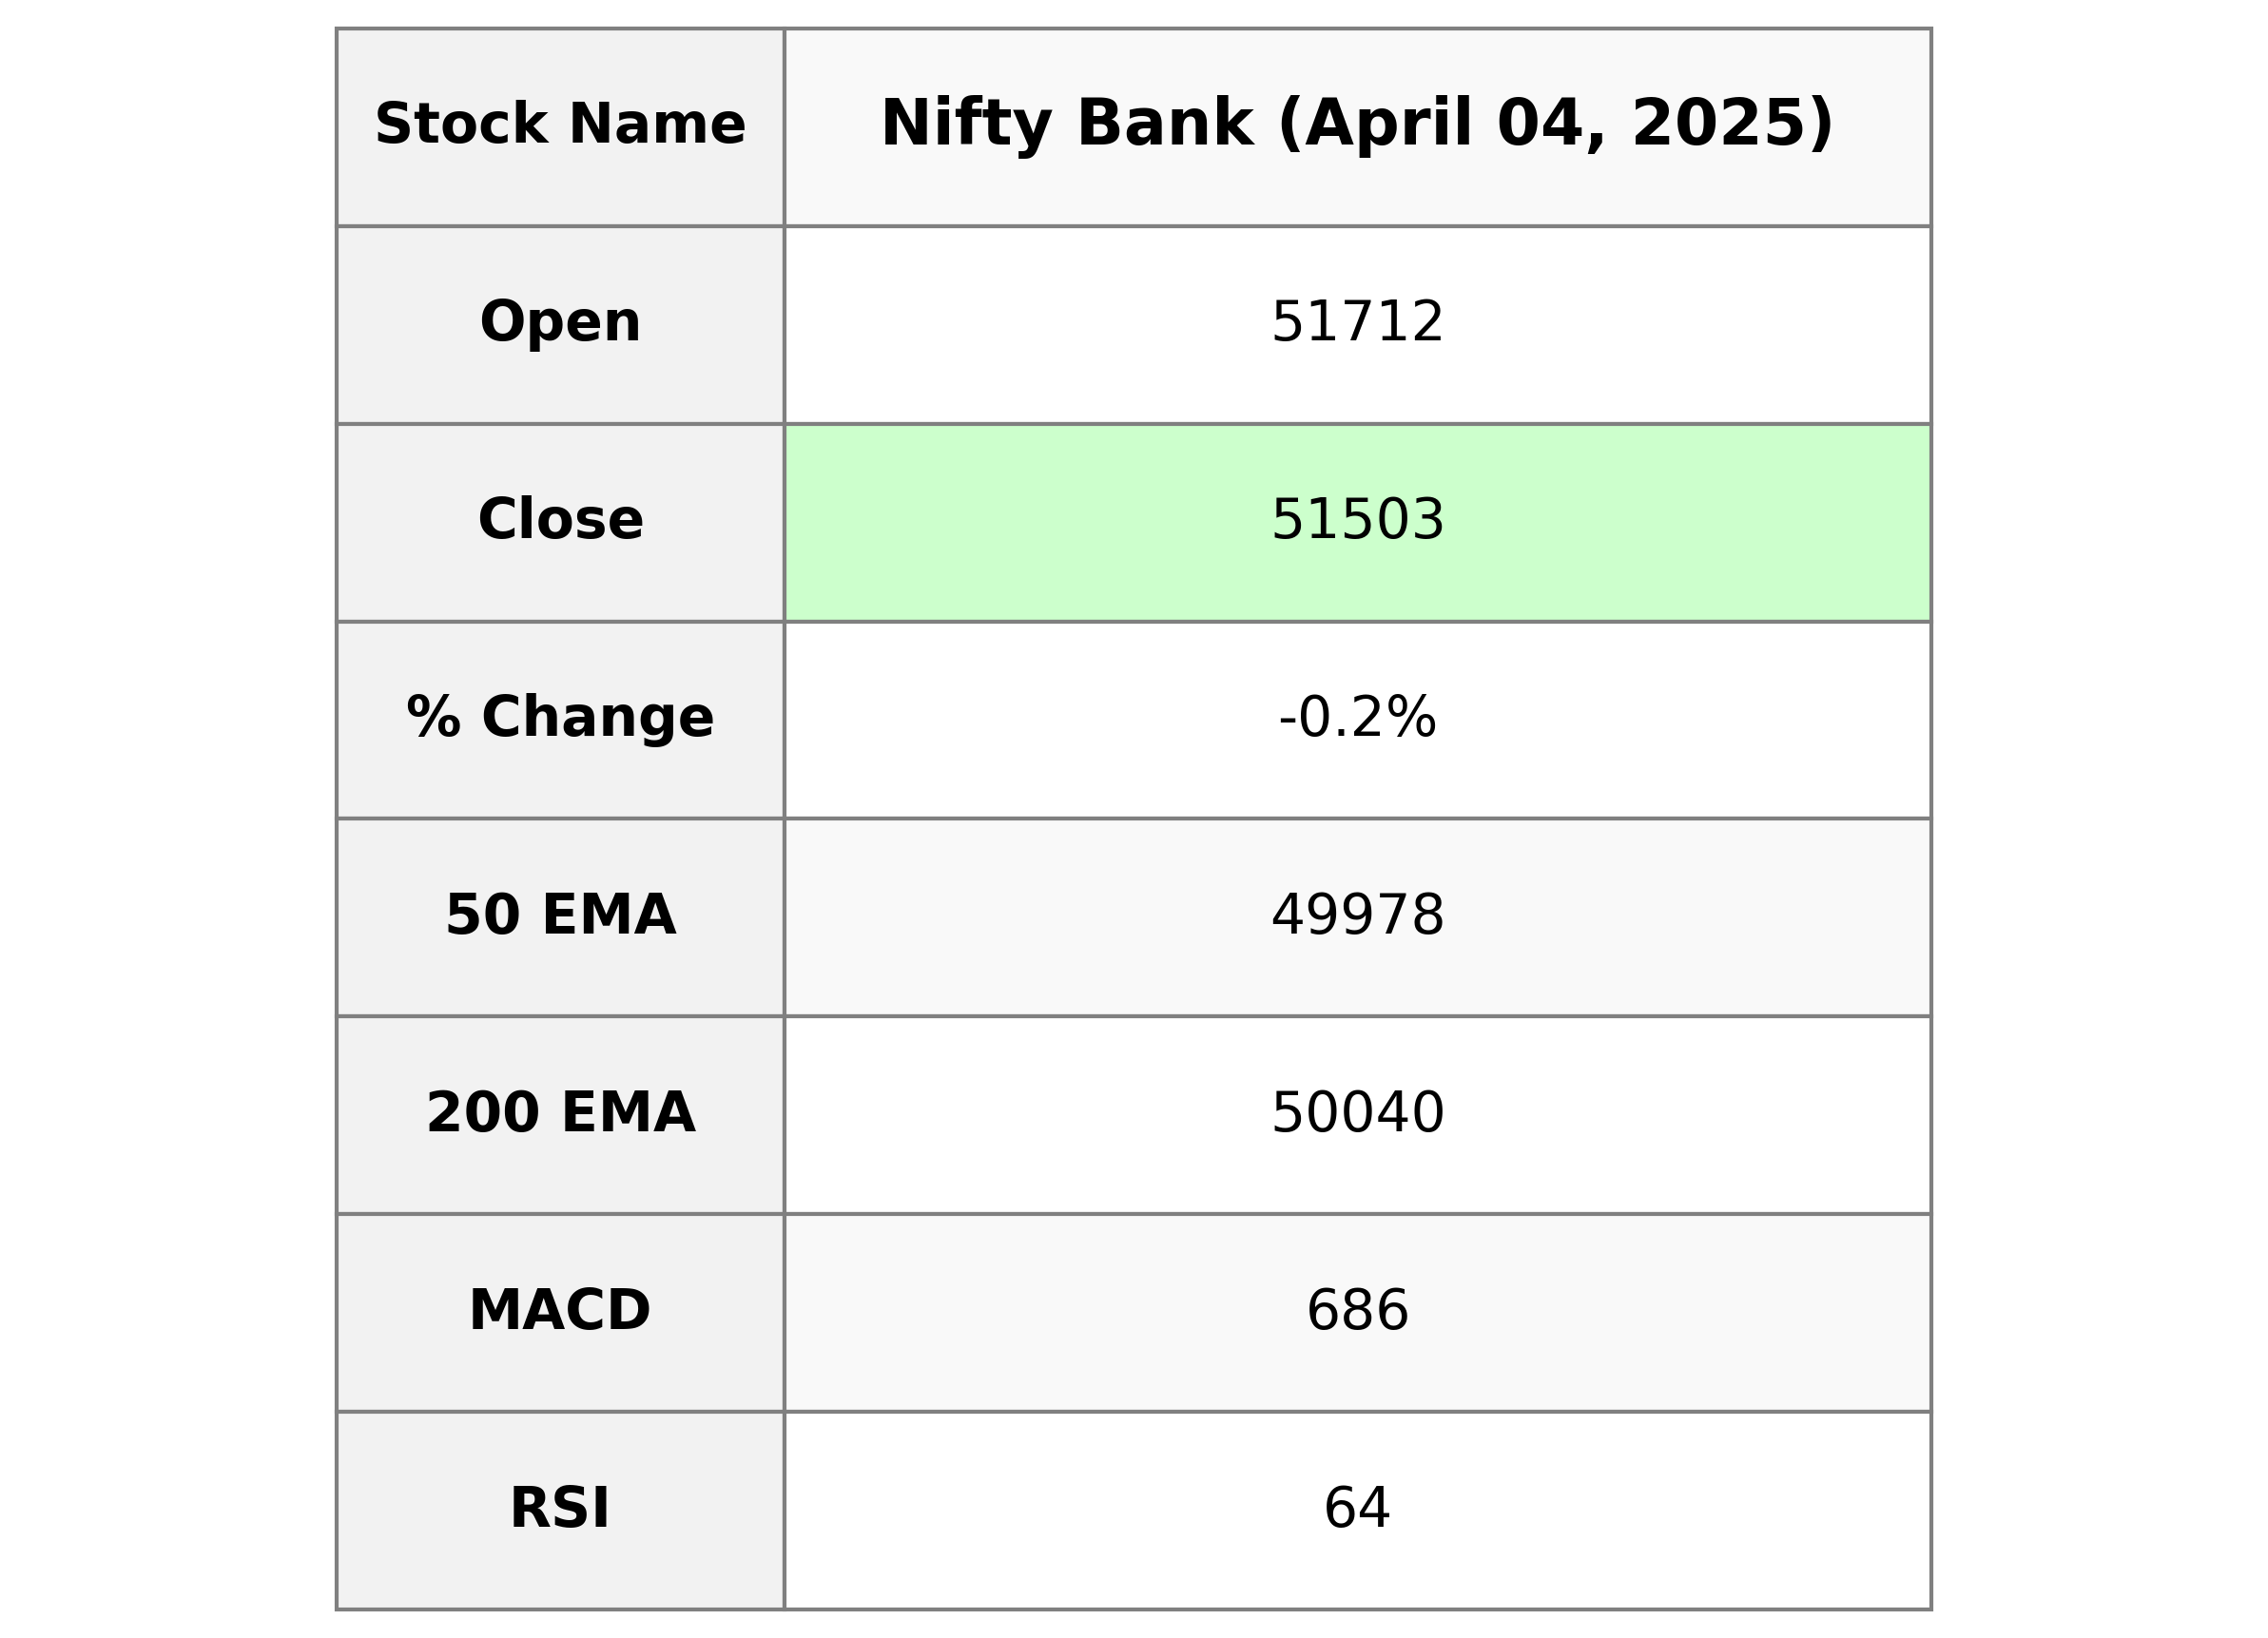
The Nifty Bank index opened at 51711.60 and closed slightly lower at 51502.70, indicating a decrease of 0.18%. The index experienced a high of 51893.60 and a low of 51360.40 during the session. Technical indicators such as the Relative Strength Index (RSI) at 64.23 suggest that the market is showing strength, while the Moving Average Convergence Divergence (MACD) is positive, indicating upward momentum above its signal line.

Relationship with Key Moving Averages
Nifty Bank closed at 51502.70, below both its 50-day EMA (49978.09) and 200-day EMA (50039.94), indicating a potential bearish trend. However, it remained above the 10-day EMA (51067.30) and 20-day EMA (50453.39), suggesting short-term bullishness.
Moving Averages Trend (MACD)
The MACD for Nifty Bank is 686.17, with a signal line of 525.80, indicating that the MACD line is above the signal line. This suggests a bullish trend, as the MACD value is greater than its signal, implying upward momentum in recent trading activity.

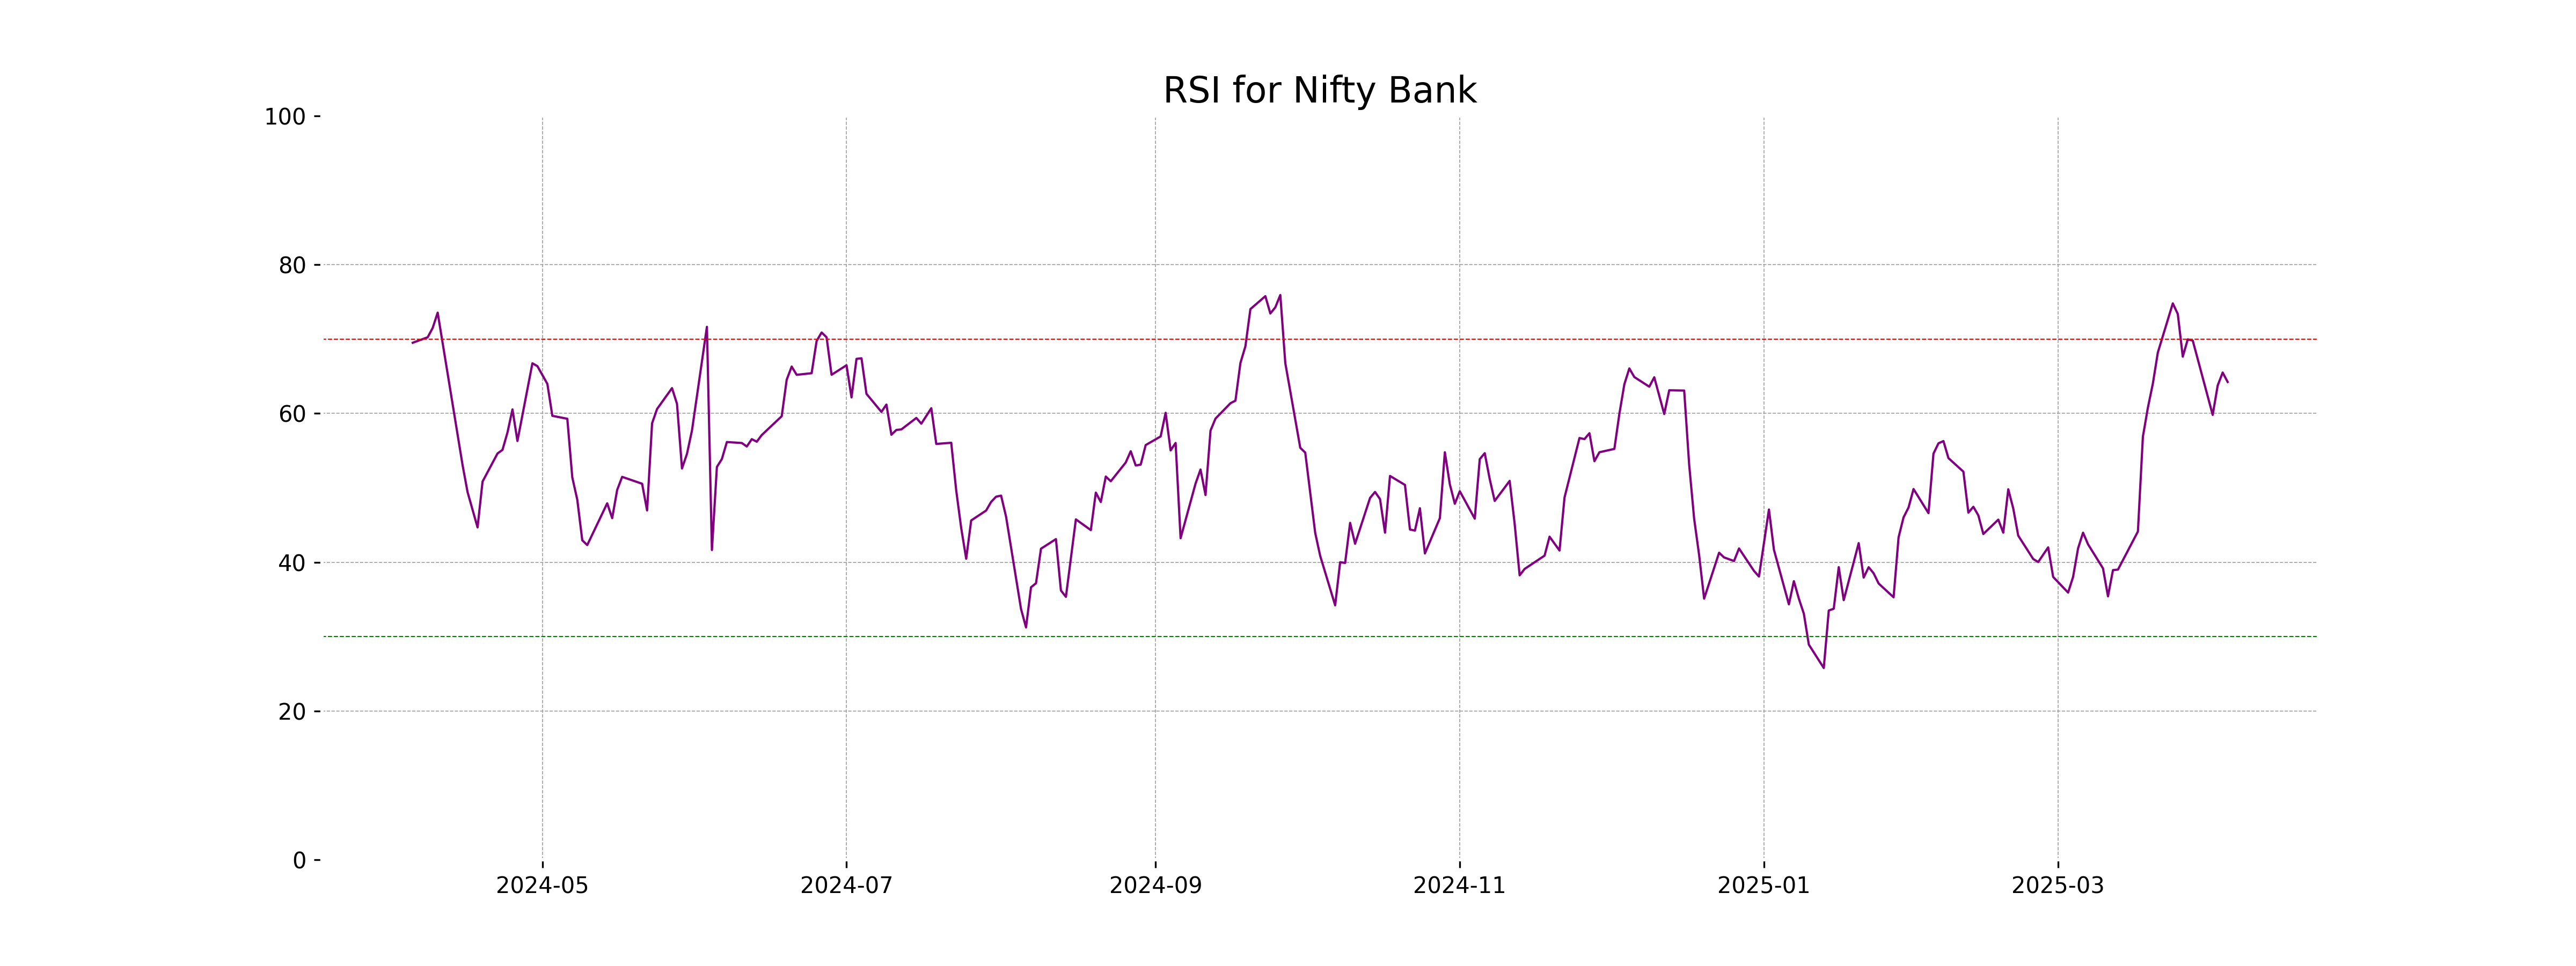
RSI Analysis
The RSI for Nifty Bank is 64.23, indicating a relatively strong momentum but not yet in overbought territory. This suggests a potential continued upward trend, although caution is advised as it nears the overbought threshold of 70.
Analysis for Nifty 50 - April 04, 2025

Nifty 50 Performance Summary: The Nifty 50 opened at 23,190.40 and closed at 22,904.45, showing a decrease of 345.65 points from the previous close of 23,250.10. This represents a percentage change of -1.49%. The Relative Strength Index (RSI) is at 45.95, indicating moderate market momentum. Several Exponential Moving Averages (EMAs) suggest that the market sentiment is currently slightly bearish compared to short-term trends.

Relationship with Key Moving Averages
Nifty 50 closed below its 50 EMA of 23122.27, suggesting a bearish movement in the short term. The closing price of 22904.45 is also below the 10 EMA and 20 EMA, reinforcing the downward trend momentum.
Moving Averages Trend (MACD)
The MACD value for Nifty 50 is 117.00, which is above its MACD Signal line of 112.17. This suggests a potential bullish momentum. However, it's important to consider other indicators and factors to confirm the trend.

RSI Analysis
The Relative Strength Index (RSI) for Nifty 50 stands at 45.95, indicating that the market is in the neutral zone and neither overbought nor oversold. This suggests the potential for continued consolidation, as it's just below the midpoint of the 30-70 scale typically used for RSI analysis.

Up Next

Indian stock market sector-wise performance today - April 4, 2025

Global stock market indices: How the world markets performed today - 25 April 2025

Indian stock market sector-wise performance today - April 25 2025

Top 5 Nifty 50 gainers today – April 25, 2025: Biggest stock moves

NSE Nifty 50: Top 5 stock losers of April 25, 2025

Global stock market indices: How the world markets performed today - 24 April 2025

More videos

Indian stock market sector-wise performance today - April 24 2025

Top 5 Nifty 50 gainers today – April 24, 2025: Biggest stock moves
NSE Nifty 50: Top 5 stock losers of April 24, 2025

Global stock market indices: How the world markets performed today - 23 April 2025

Indian stock market sector-wise performance today - April 23, 2025
Top 5 Nifty 50 gainers today – April 23, 2025: Biggest stock moves

NSE Nifty 50: Top 5 stock losers of April 23, 2025

Sensex, Nifty rise for 6th day on foreign fund inflows, buying in banking shares

Global stock market indices: How the world markets performed today - 22 April 2025

Indian stock market sector-wise performance today - April 22, 2025