


Highlights
- Nifty FMCG led with 1.99% gain, reaching 54300.25 points
- Nifty IT rose by 1.76%, closing at 33244.40 points
- Nifty Auto increased by 1.63%, ending at 20138.15 points
Latest news

Pahalgam tragedy casts shadow on Indo-Pak cricket

MS Dhoni to play his 400th T20 match as CSK faces SRH

India stands tall amid tragedy: Piyush Goyal

ED raids Congress MLA Vinay Kulkarni's properties

VHP stages protest in Kolkata over Pahalgam attack

Kartarpur corridor stays open amid tensions

Hero and terrorist: The tale of two Adils in Pahalgam

Pahalgam survivor recalls horror, wife prays Shiva
Indian stock market sector-wise performance today - April 8, 2025


The stock market on Tuesday (April 8, 2025) witnessed a notable upswing across a wide range of sectors, with each key index recording positive gains.
The Nifty FMCG sector emerged as the top performer, exhibiting a robust increase of 1.99 percent. This surge reflects strong investor confidence and potentially improving consumer sentiment.
Contributing to this positive outlook might be a combination of factors including positive earnings reports or favorable economic data that enhances consumption trends.
Following closely behind is the Nifty Infra, which showed an impressive rise of 1.88 percent. This could signal increased investments or infrastructural developments that may have been announced, fostering investor optimism.
Similarly, Nifty IT experienced a commendable enhancement of 1.76 percent, indicating a rebound in the technology sector, perhaps driven by advancements in tech services or improved global conditions for IT exports. Nifty Auto also performed well, registering a growth of 1.63 percent. This might be attributed to new vehicle launches or beneficial regulatory announcements affecting the automotive industry.
Meanwhile, the Nifty, which represents a broad market overview, rose by 1.69 percent, suggesting overall market health and synchronized sectoral movements.
Further strength was observed in Nifty Metal and Nifty Energy, each climbing by 1.52 percent and 1.44 percent respectively. While these increases are appreciable, they may reflect surges in global commodity prices or increased industrial activity stimulating demand for metals and energy resources.
Nifty Bank's advancement by 1.31 percent likely indicates stability in financial markets or supportive monetary policies enhancing bank performances.
Lastly, the Sensex, a key barometer of the market condition, rose by 1.49 percent, rounding off a positive market day with broad-based gains. The most affected sector, the FMCG sector, might have seen this pronounced impact due to a variety of factors. I might be advancements in consumer goods consumption driven by festival season demand, price stability, or strategic business moves by major players within the sector. Overall, it was a day marked by sweeping gains and renewed optimism, possibly influenced by supportive economic policies, improved economic indicators, or significant investor inflows across diverse sectors.

Analysis for Sensex - April 08, 2025
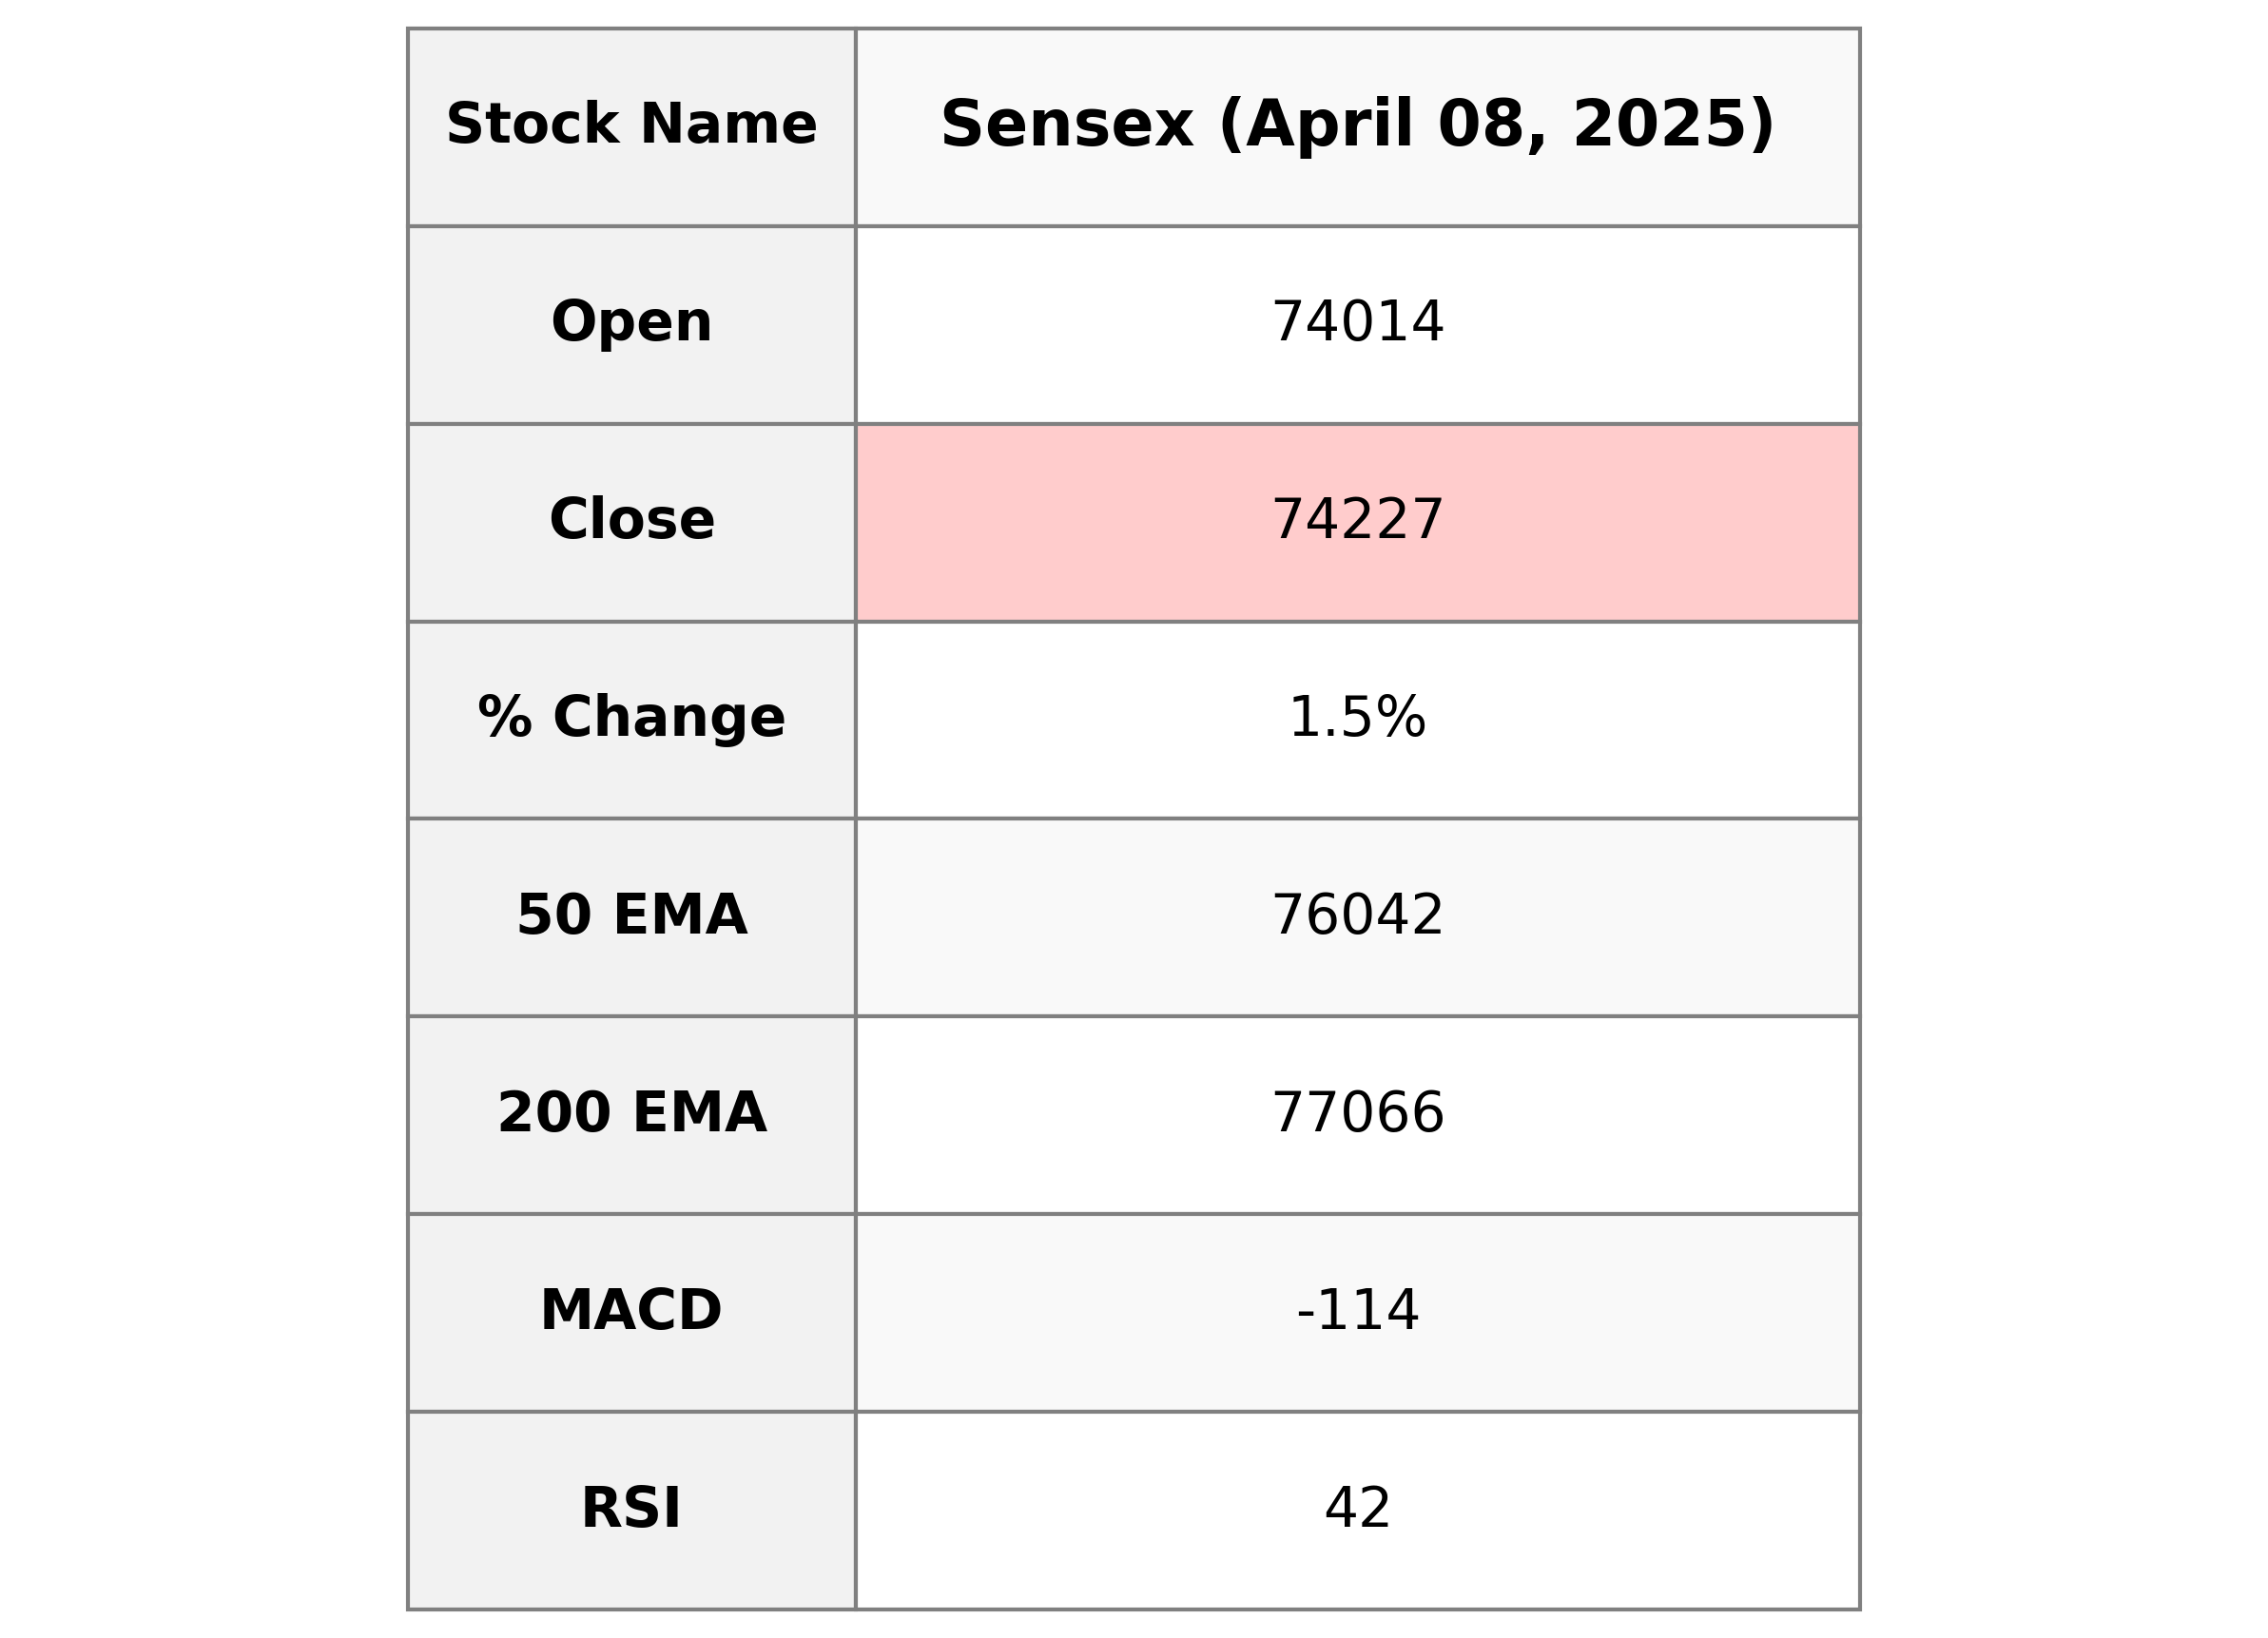
Sensex Performance: On the trading day, the Sensex opened at 74,013.73 and closed at 74,227.08 with a noticeable increase of 1.49% compared to the previous close of 73,137.90. The index experienced a significant points change of 1,089.18, reaching a high of 74,859.39 and a low of 73,424.92. The technical indicators such as the RSI at 41.71, and the MACD at -113.71 suggest some bearish momentum.

Relationship with Key Moving Averages
The Sensex closed at 74,227.08, which is below its 50-day EMA of 76,042.25, 200-day EMA of 77,065.61, and also below its 10-day and 20-day EMAs of 75,477.06 and 75,644.86 respectively. This suggests a bearish trend as the current close is lower than all major EMAs.
Moving Averages Trend (MACD)
MACD Analysis for Sensex: The MACD value is -113.71, indicating a bearish trend as it is below the Signal line at 160.74. This suggests downward momentum in the current market conditions for Sensex.

RSI Analysis
RSI Analysis for Sensex: The Relative Strength Index (RSI) for Sensex is at 41.71, indicating it is in the neutral zone. Values below 30 typically indicate that the asset is oversold, whereas values above 70 suggest it might be overbought. With an RSI near 41.71, Sensex appears to be neither oversold nor overbought currently.

Analysis for Nifty Auto - April 08, 2025

Nifty Auto opened at 20,141.65 and closed at 20,138.15, showing a positive change of 1.63% with a points increase of 322.60. The RSI is at 35.03, indicating potential bearish conditions as it is below 50. The MACD is negative at -288.77, suggesting a downtrend, while the MACD signal is -174.18. The trading volume was 0, indicating no trades during the period reported.

Relationship with Key Moving Averages
Nifty Auto closed at 20138.15, which is below its 50-day EMA of 21609.78 and 20-day EMA of 21066.72, indicating a bearish sentiment. However, it is marginally below its 10-day EMA of 20818.34, suggesting a potential short-term upward correction. The RSI is at 35.03, indicating oversold conditions.
Moving Averages Trend (MACD)
Nifty Auto shows a negative MACD value of -288.77, indicating bearish momentum, as the MACD line is below the signal line (-174.18). The RSI is also at 35.03, suggesting the index is in the oversold territory.

RSI Analysis
RSI Analysis for Nifty Auto: The RSI value of 35.03 indicates that Nifty Auto is approaching the oversold territory, suggesting potential undervaluation. This might signal a buying opportunity, assuming other factors align positively.

Analysis for Nifty Energy - April 08, 2025

The Nifty Energy index opened at 32,031.15 and closed at 31,866.75, showing a positive change of 1.44% from the previous close of 31,414.55. The index experienced a points change of 452.20 with no reported trading volume. The Relative Strength Index (RSI) stands at 44.34, indicating a neutral position in the market.

Relationship with Key Moving Averages
Nifty Energy closed at 31,866.75, which is below its 50-day EMA of 32,774.75, 10-day EMA of 32,610.89, and 20-day EMA of 32,553.22, indicating a bearish trend in comparison to these short and medium-term moving averages. The closing price is also significantly lower than the long-term 200-day EMA of 35,699.34, suggesting an overall downward momentum.
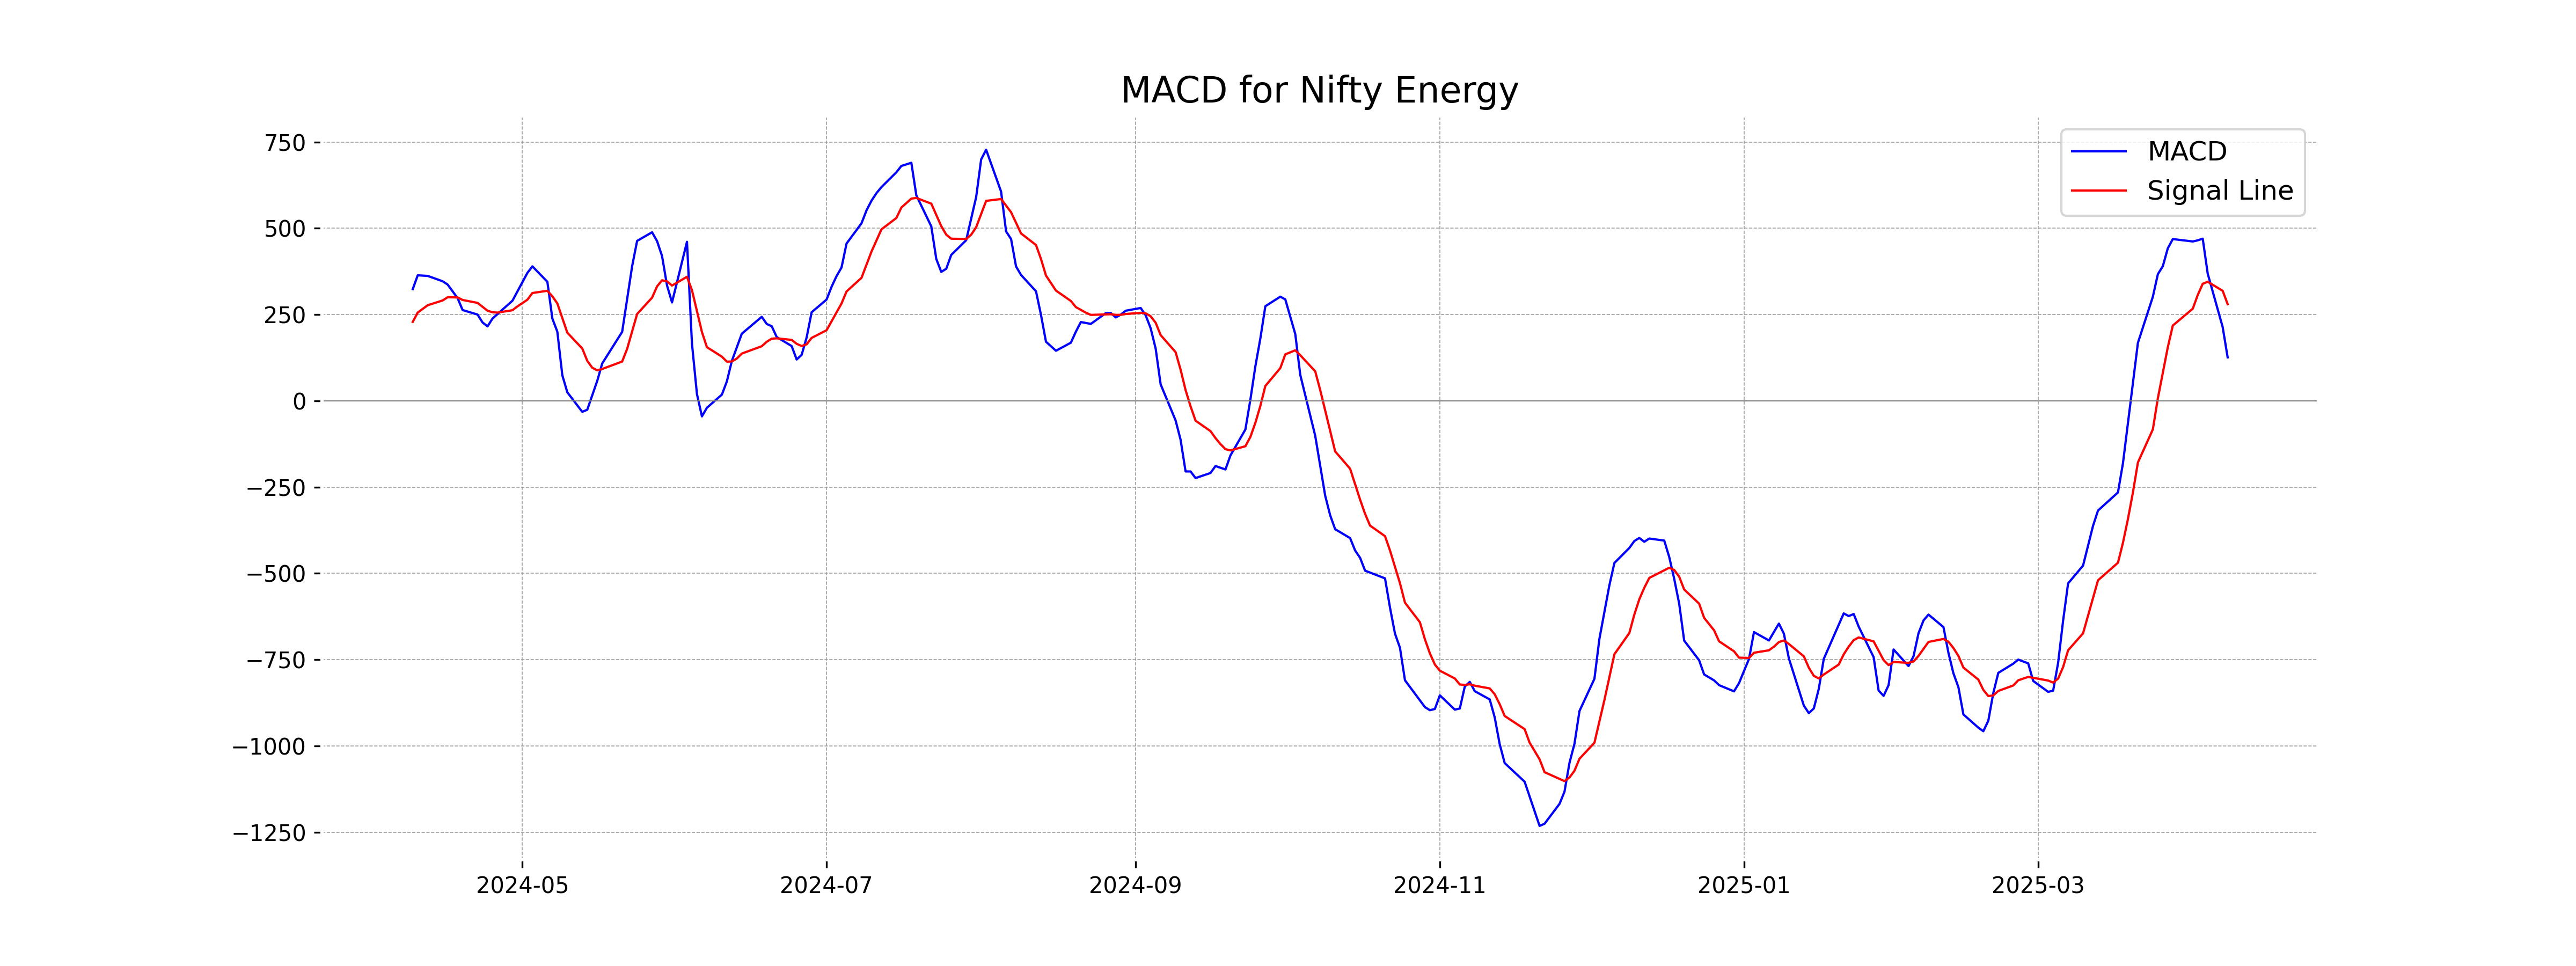
Moving Averages Trend (MACD)
Based on the provided data, the MACD for Nifty Energy is 125.99, which is below the MACD Signal of 280.27. This indicates a bearish trend, suggesting a potential downside or weakening momentum in the stock. The RSI is at 44.34, indicating that the stock is neither overbought nor oversold, but closer to the oversold territory.
RSI Analysis
The Nifty Energy index has a Relative Strength Index (RSI) of 44.34, indicating a neutral position, as it is neither in the overbought nor oversold territory. This suggests that there is no significant momentum in either bullish or bearish direction at the moment.

Analysis for Nifty FMCG - April 08, 2025

Nifty FMCG opened at 53,800.05 and closed higher at 54,300.25, marking a 1.99% increase from the previous close of 53,241.15. The significant points change of 1,059.10, combined with a strong RSI of 61.91 and a positive MACD of 249.17, indicates bullish momentum in the market. The close is also above the 50 EMA of 53,624.03, suggesting an upward trend in the short term.

Relationship with Key Moving Averages
Nifty FMCG closed at 54300.25, which is above the 50 EMA of 53624.03 and the 10 EMA of 53495.30, indicating a short-term bullish sentiment. However, it remains below the 200 EMA of 56096.06, suggesting that the longer-term trend might still be bearish or neutral.
Moving Averages Trend (MACD)
The MACD value of 249.17 is significantly above the MACD Signal line at 52.98, indicating a strong bullish momentum for Nifty FMCG. This suggests that the current trend is upward, and there might be a continuation of this positive movement.

RSI Analysis
Nifty FMCG RSI Analysis: The Relative Strength Index (RSI) for Nifty FMCG is 61.91, indicating a moderately strong momentum in the current trend. Generally, an RSI value between 50 and 70 suggests that the index is in a healthy uptrend but not yet overbought.

Analysis for Nifty Infra - April 08, 2025

Nifty Infra opened at 8098.75 and closed at 8109.20, showing a positive change of 1.87% from the previous close of 7959.95. The RSI is at 46.06, indicating a moderately strong position. However, the index's close is below the 50-day and 200-day EMAs, suggesting a potential bearish trend despite the gain.

Relationship with Key Moving Averages
Nifty Infra closed at 8109.20, which is below its 10 EMA of 8249.17, 20 EMA of 8223.86, and 50 EMA of 8209.88, indicating a bearish trend. The current level is also under the 200 EMA of 8396.41, suggesting a longer-term bearish sentiment.
Moving Averages Trend (MACD)
Based on the data for Nifty Infra, the MACD value is 44.77, while the MACD Signal line stands at 76.32. Since the MACD is below the Signal line, it suggests a bearish trend, indicating potential downward movement in the stock's price momentum.

RSI Analysis
The RSI value for Nifty Infra is 46.06, which suggests that the stock is currently in a neutral zone. It is neither in overbought territory (above 70) nor oversold territory (below 30), indicating no immediate reversal signals based on the RSI alone.

Analysis for Nifty IT - April 08, 2025

The Nifty IT index opened at 33,232.40 and closed at 33,244.40, registering a daily change of 1.76% with an increase of 575.60 points from the previous close of 32,668.80. The RSI is low at 27.22, indicating potential oversold conditions, while the MACD shows a bearish trend with a value of -1408.83 below the signal line.

Relationship with Key Moving Averages
Nifty IT: The closing price of 33,244.40 is below its 50-day EMA of 38,284.02, 200-day EMA of 39,727.69, 10-day EMA of 34,944.04, and 20-day EMA of 36,077.21, indicating a bearish trend as the price trades significantly below these key moving averages.
Moving Averages Trend (MACD)
MACD Analysis for Nifty IT: The MACD value for Nifty IT is -1408.83, which is below the MACD Signal of -1138.51, indicating a bearish momentum. This suggests the recent trend is downward, and the index might continue to experience selling pressure unless a change in trend occurs.

RSI Analysis
The RSI for Nifty IT is 27.22, which suggests that the index is currently in the oversold territory. This indicates that there might be a potential for a price reversal or a slowdown in the downtrend, as the RSI is below 30.

Analysis for Nifty Metal - April 08, 2025

Nifty Metal opened at 8080.90 and closed at 7965.60, marking a positive change of 1.52% from the previous close of 7846.35, with a points increase of 119.25. The index experienced a broad trading range, hitting a high of 8161.40 and a low of 7800.85. Despite the recent gain, technical indicators like the 50 and 200 EMA suggest it is trading below longer-term moving averages, indicating potential resistance in upward momentum. The low RSI value of 30.96 suggests oversold conditions, while a negative MACD of -78.12 indicates bearish momentum.

Relationship with Key Moving Averages
Nifty Metal closed at 7965.60, which is below all its key moving averages: the 50-day EMA at 8711.42, the 200-day EMA at 8805.53, the 10-day EMA at 8601.16, and the 20-day EMA at 8728.17. This indicates a bearish trend as the current price is below these averages.
Moving Averages Trend (MACD)
The current MACD value for Nifty Metal is -78.12, while the MACD Signal is 75.33. This indicates a bearish momentum as the MACD line is below the signal line. Traders should be cautious as the RSI is also relatively low at 30.96, suggesting potential oversold conditions.

RSI Analysis
The RSI for Nifty Metal is 30.96, indicating that the index is approaching the oversold territory. This suggests that the current selling pressure might be overextended, and a potential rebound could be on the horizon if buying interest picks up.

Analysis for Nifty Bank - April 08, 2025

Nifty Bank opened at 50,388.55 and closed at 50,511.0, showing a percentage change of 1.31% with a points increase of 650.90. The Relative Strength Index stands at 52.56, suggesting a relatively neutral position, while the MACD indicates a slightly bullish momentum despite being below the signal line.

Relationship with Key Moving Averages
Nifty Bank opened higher than its 50 EMA and closed above this level, suggesting positive momentum. The closing price is also above the 20 EMA but below the 10 EMA, indicating short-term consolidation or pullback within an uptrend.
Moving Averages Trend (MACD)
The MACD for Nifty Bank is currently at 490.22, which is below the MACD Signal line at 522.67, indicating a potential bearish trend. If the MACD continues to stay below the Signal line, it suggests downward momentum, but the close proximity could also imply an upcoming crossover, requiring close monitoring.

RSI Analysis
RSI Analysis for Nifty Bank: The Relative Strength Index (RSI) for Nifty Bank is 52.56, indicating a neutral momentum as it is neither overbought nor oversold. This suggests balanced trading conditions with a slight leaning towards a positive trend given its position above 50.

Analysis for Nifty 50 - April 08, 2025

Nifty 50 opened at 22,446.75 and closed at 22,535.85, marking a gain of 374.25 points or a 1.69% increase from the previous close of 22,161.60. The index experienced a high of 22,697.20 and a low of 22,270.85. Despite the positive points change, the RSI stands at 42.08, indicating potential caution with an MACD reflecting a bearish signal.

Relationship with Key Moving Averages
The Nifty 50 closed at 22,535.85, which is below its 50-day EMA of 23,063.08 and its 200-day EMA of 23,380.83, indicating a downtrend pressure in relation to these moving averages. Additionally, it is also trading below its 10-day and 20-day EMAs, suggesting short-term bearish momentum.
Moving Averages Trend (MACD)
{"MACD Analysis": "The MACD value of -15.29 for Nifty 50 compared to the MACD Signal of 72.93 indicates a bearish momentum, suggesting the possibility of a downward trend or consolidation in the near term."}

RSI Analysis
Nifty 50's RSI stands at 42.08, indicating a weak momentum as it is below the neutral 50 level. This suggests that the market is not in overbought territory and may be closer to being oversold. Further observation is recommended for potential changes in trend direction.

Up Next

Indian stock market sector-wise performance today - April 8, 2025

Global stock market indices: How the world markets performed today - 25 April 2025

Indian stock market sector-wise performance today - April 25 2025

Top 5 Nifty 50 gainers today – April 25, 2025: Biggest stock moves

NSE Nifty 50: Top 5 stock losers of April 25, 2025

Global stock market indices: How the world markets performed today - 24 April 2025

More videos

Indian stock market sector-wise performance today - April 24 2025

Top 5 Nifty 50 gainers today – April 24, 2025: Biggest stock moves
NSE Nifty 50: Top 5 stock losers of April 24, 2025

Global stock market indices: How the world markets performed today - 23 April 2025

Indian stock market sector-wise performance today - April 23, 2025
Top 5 Nifty 50 gainers today – April 23, 2025: Biggest stock moves

NSE Nifty 50: Top 5 stock losers of April 23, 2025

Sensex, Nifty rise for 6th day on foreign fund inflows, buying in banking shares

Global stock market indices: How the world markets performed today - 22 April 2025

Indian stock market sector-wise performance today - April 22, 2025