


Highlights
- Market demonstrated a mix of bullish and bearish trends
- RSI indicators highlight areas of potential reversals, particularly in oversold markets
- MACD, indicating momentum strength, showed both potential buy signals
Latest news

Fatwa issued against Thalapathy Vijay over anti-Muslim allegations

Donald Trump says 'joke' Harvard should be stripped of funds

IPL 2025: Mitchell Starc's brilliance guides Delhi Capitals to Super Over victory over RR

EC refutes opposition’s claims on Maharashtra voter list

Supreme Court questions Centre over non-Muslims in waqf boards

Uddhav Thackeray denies abandoning Hindutva, proposing a Shivaji memorial

Dwarka Court evacuated after a hoax bomb threat linked to a drug bust

Salman Khan- The end of an era in Bollywood?
Global stock market indices: How the world markets performed today - 05 March 2025


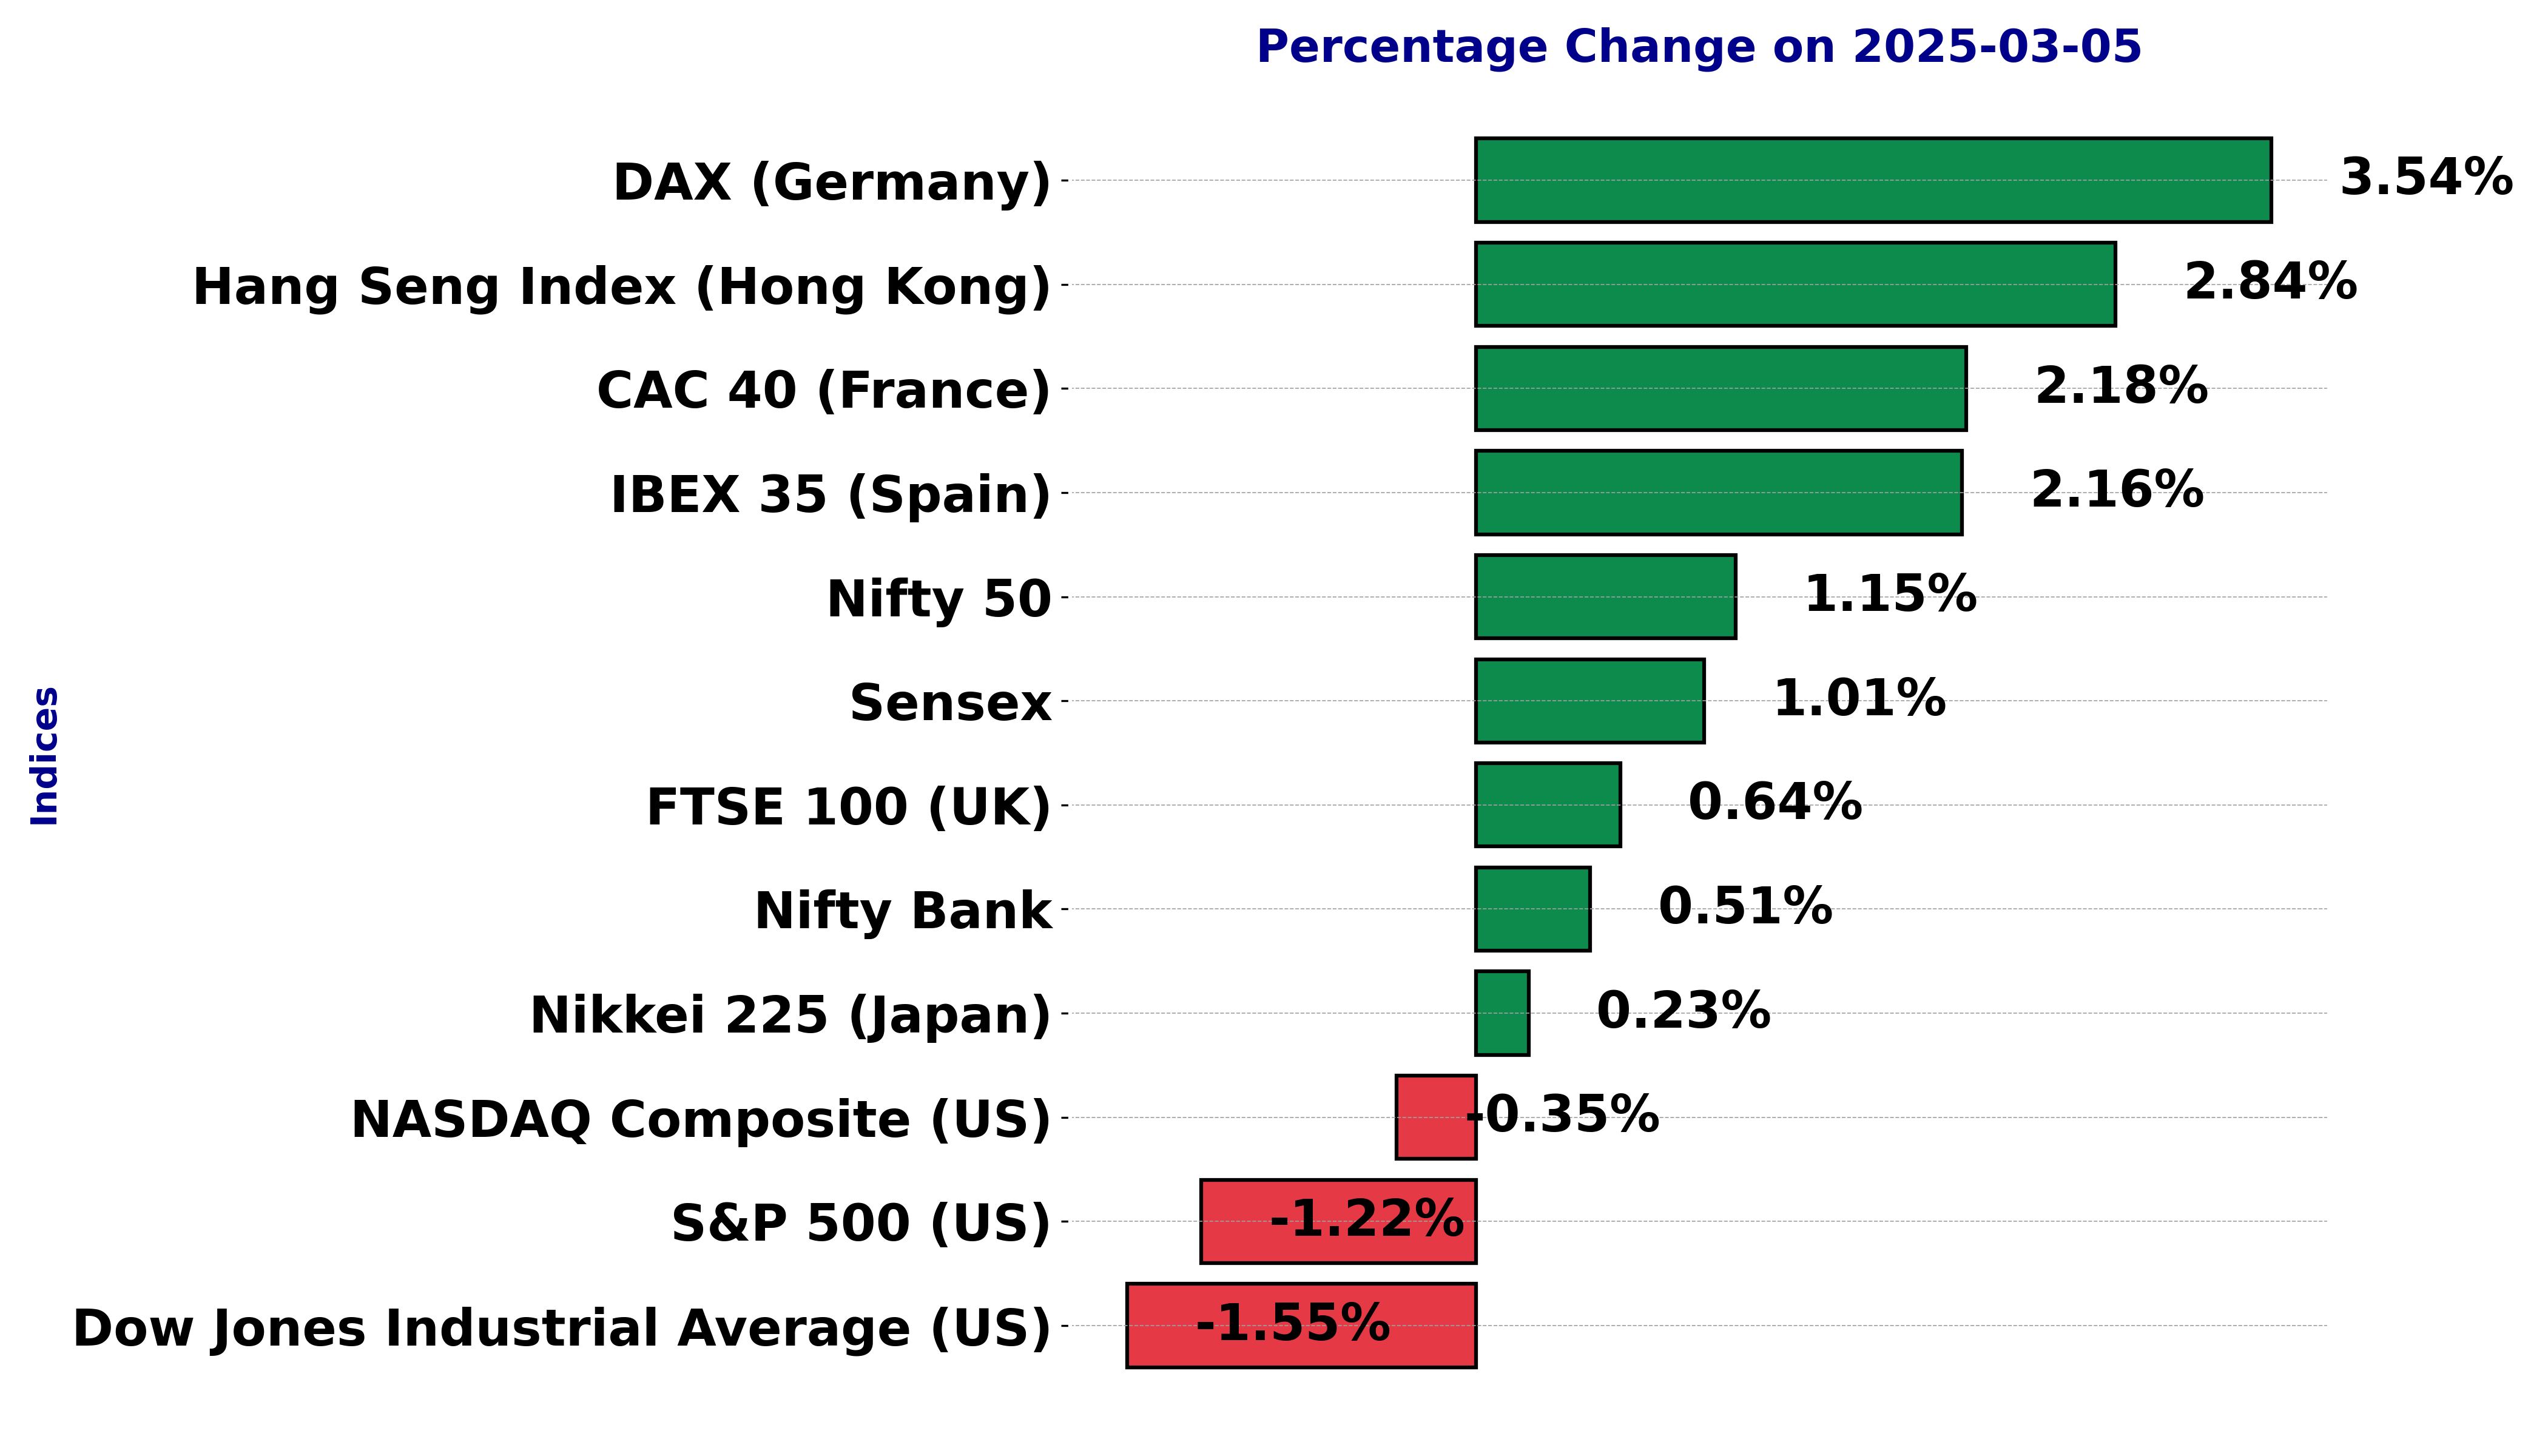
The international stock market indices showed varied performances on March 05, 2025, reflecting the economic sentiment across different regions.
In this article, we analyze the performance of key global indices including the S&P 500, Dow Jones Industrial Average, NASDAQ Composite, FTSE 100, DAX, CAC 40, IBEX 35, Nikkei 225, Hang Seng, Nifty 50, and BSE Sensex.
Analysis for Sensex - March 05, 2025

The Sensex opened at 73005.37 and closed higher at 73730.23, marking a gain of 1.01% in value with a points change of 740.30. The day's trading saw a high of 73933.80 and a low of 72894.05, with technical indicators like the RSI at 33.31 reflecting potential oversold conditions.

Relationship with Key Moving Averages
The given data indicates that the Sensex closed below the 10, 20, 50, and 200-day EMA, suggesting a bearish trend in the short to long term. The RSI of 33.31 also suggests that the index might be approaching oversold conditions, which could indicate potential for a reversal. Additionally, the negative MACD value supports a bearish momentum.
Moving Averages Trend (MACD)
MACD Analysis for Sensex: The MACD value of -1018.60 is below the signal line value of -793.92, indicating a bearish trend. This suggests that the Sensex might continue to experience downward momentum in the short term.

RSI Analysis
The RSI (Relative Strength Index) for Sensex is at 33.31, which is below the typical oversold threshold of 30. This suggests that the index is approaching oversold conditions, potentially indicating a buying opportunity if other indicators also align.

Analysis for Dow Jones Industrial Average (US) - March 05, 2025

Dow Jones Industrial Average (US) Performance: On the latest trading session, the Dow Jones Industrial Average closed at 42,520.99, reflecting a decrease of 670.25 points or a 1.55% drop from the previous close of 43,191.24. The index experienced a trading range between a high of 43,084.00 and a low of 42,347.75, with a significant trading volume of 815,780,000. Technical indicators show an RSI of 34.24, suggesting possible oversold conditions, while the MACD is below the signal line, indicating bearish momentum.

Relationship with Key Moving Averages
The Dow Jones Industrial Average is trading below its 10-day (43486.04), 20-day (43769.63), and 50-day (43762.76) Exponential Moving Averages (EMAs), indicating a short-term bearish sentiment. Its current close of 42520.99 is, however, above the 200-day EMA (42013.38), suggesting some long-term support.
Moving Averages Trend (MACD)
The Dow Jones Industrial Average is experiencing a downward momentum as indicated by the negative MACD value of -244.40. This suggests that the recent price trend is bearish, and since the MACD is below the MACD Signal line (-51.01), the bearish trend may continue.

RSI Analysis
RSI Analysis for Dow Jones Industrial Average (US): The RSI is currently at 34.24, which indicates that the index is approaching the oversold territory. This suggests potential buying pressure may build up if the RSI continues to decrease, as values below 30 are often considered oversold.

Analysis for CAC 40 (France) - March 05, 2025

The CAC 40 index experienced a notable increase, with a closing value of 8223.42, marking a 2.18% gain from the previous close of 8047.92, alongside a 175.5 points increase. The index traded between a low of 8151.47 and a high of 8245.24, indicating strong upward momentum supported by its RSI of 61.81, positioning it above both its 50-day and 200-day EMAs.

Relationship with Key Moving Averages
The CAC 40's current close at 8223.42 is above its 50-day EMA of 7883.47 and its 200-day EMA of 7644.64, indicating a bullish trend. Additionally, it is also above the 10-day EMA of 8129.49 and the 20-day EMA of 8076.21, suggesting upward momentum in the shorter term.
Moving Averages Trend (MACD)
Based on the stock data for CAC 40 (France), the MACD value is 86.78, while the MACD Signal is higher at 102.13. This suggests the index is experiencing a bearish divergence, as the MACD is below the MACD Signal, indicating potential downward momentum.

RSI Analysis
RSI Analysis for CAC 40 (France): The current RSI for CAC 40 is 61.81, indicating a neutral position. This suggests that the index is neither overbought nor oversold, which may imply a stable outlook unless other indicators suggest a change.

Analysis for FTSE 100 (UK) - March 05, 2025

The FTSE 100 (UK) opened at 8759.0 and closed higher at 8815.09, resulting in a 0.64% increase with a points change of 56.09. The day's high was 8835.72 and the low was 8752.46. The RSI is 61.32, suggesting moderate momentum, while the MACD of 67.09 is below the signal line of 70.33, indicating a potential weakening of the bullish trend.

Relationship with Key Moving Averages
FTSE 100 (UK) closed at 8815.09, above its 10-day EMA of 8765.61, indicating short-term bullish momentum. The index is also trading above its 50-day EMA of 8581.85 and 200-day EMA of 8300.05, suggesting a strong long-term uptrend.
Moving Averages Trend (MACD)
FTSE 100 (UK) is showing a slightly bearish trend as the MACD (67.09) is below the MACD Signal (70.33). This indicates that the momentum might be slowing down, although it remains above the zero line, suggesting overall positive sentiment.

RSI Analysis
The current RSI for the FTSE 100 index is 61.32, which indicates a neutral stance suggesting that the index is neither overbought nor oversold. Traders might watch for any further movement in RSI levels to predict potential buying or selling opportunities.

Analysis for DAX (Germany) - March 05, 2025

DAX (Germany) opened at 22,804.81 and closed at 23,116.72, marking a notable increase with a 3.54% change and a point gain of 789.91 over the previous close of 22,326.81. The index showed strong upward momentum with a high of 23,176.39 and an RSI of 63.05, indicating a bullish trend supported by the MACD and EMAs.

Relationship with Key Moving Averages
The index is trading above all key moving averages, with a current close of 23116.72 surpassing the 50-day EMA (21623.74), 200-day EMA (19778.37), 10-day EMA (22648.86), and 20-day EMA (22384.94), indicating a strong upward momentum.
Moving Averages Trend (MACD)
The MACD for DAX (Germany) is 381.73, which is slightly below the MACD Signal line of 399.94. This indicates a potential weakening of bullish momentum, suggesting that the upward trend might be slowing down. Traders should watch for further movements to confirm any trend reversal.

RSI Analysis
RSI Analysis for DAX (Germany): The Relative Strength Index (RSI) for DAX currently stands at 63.05, suggesting that the market is in a neutral to mildly overbought condition. As it is below the 70 threshold, the index is not yet in overbought territory, indicating there may still be room for upward price movement without immediate risk of a reversal.

Analysis for S&P 500 (US) - March 05, 2025

The S&P 500 (US) saw a decline, closing at 5778.15 and down by approximately 1.22% or 71.57 points from the previous close of 5849.72. With the Relative Strength Index (RSI) at 33.22, the index may be oversold, indicating potential for a rebound. The current MACD reading of -42.04 against the MACD Signal of -9.35 suggests bearish momentum.

Relationship with Key Moving Averages
The S&P 500's closing price of 5778.15 is below its 50-day EMA of 5985.69 and 20-day EMA of 5978.04, indicating a bearish trend. However, it remains slightly above the 200-day EMA of 5709.76, suggesting longer-term support.
Moving Averages Trend (MACD)
The MACD for the S&P 500 indicates a bearish trend as it is below the signal line. With a MACD value of -42.04 and a signal value of -9.35, the index is experiencing downward momentum, which may suggest further declines.

RSI Analysis
RSI Analysis for S&P 500 (US): The Relative Strength Index (RSI) for the S&P 500 is 33.22, indicating that it is approaching oversold conditions. RSI below 30 typically suggests that a security may be undervalued and possibly poised for a reversal or corrective upward movement.

Analysis for Hang Seng Index (Hong Kong) - March 05, 2025

The Hang Seng Index opened at 23,200.42, reaching a high of 23,636.65 and closing at 23,594.21, reflecting a 2.84% increase from the previous close. The index experienced a substantial points change of 652.44, with a 10-day EMA of 23,101.11, indicating strong upward momentum. The RSI of 66.35 suggests the index is nearing overbought conditions.

Relationship with Key Moving Averages
The Hang Seng Index is trading above both its 50-day EMA of 21450.04 and 200-day EMA of 19682.45, indicating a strong upward trend. Additionally, it is also above its 10-day EMA of 23101.11 and 20-day EMA of 22559.59, further suggesting bullish momentum.
Moving Averages Trend (MACD)
The Hang Seng Index (Hong Kong) shows a MACD of 743.93 and a MACD Signal of 779.43, which indicates that the MACD line is below the signal line. This suggests a potential bearish momentum; however, with the stock showing a positive percentage change in price, it's advisable to watch for a potential crossover or confirmation of the trend reversal.

RSI Analysis
The RSI for the Hang Seng Index is 66.35, indicating it is approaching the overbought territory. This suggests that the index may experience a pullback or consolidation if the RSI continues to rise above 70. It's important to monitor any further movement in RSI for signs of a potential reversal.

Analysis for IBEX 35 (Spain) - March 05, 2025

IBEX 35 (Spain) Performance: The IBEX 35 opened at 13,230.10 and closed higher at 13,313.40, marking a 2.16% increase from the previous close of 13,031.70 with a points gain of 281.70. The index experienced a high trading volume of 55,559,474, and its RSI is at 65.06, indicating a relatively strong market momentum.

Relationship with Key Moving Averages
The IBEX 35 is trading above its 10 EMA, 20 EMA, 50 EMA, and 200 EMA, indicating a strong upward trend. The current close is also above the previous close, highlighting a positive momentum. Additionally, the RSI is at 65.06, which suggests that the index is in the bullish territory but close to being overbought.
Moving Averages Trend (MACD)
The IBEX 35 index shows a MACD value of 261.02, which is slightly below the MACD Signal of 273.53, suggesting a potential weakening in upward momentum. However, with a recent close above key EMAs and an RSI of 65.06, the index demonstrates considerable buying interest, though it is approaching overbought territory.

RSI Analysis
The RSI (Relative Strength Index) for IBEX 35 is 65.06, indicating a relatively strong trend towards the overbought territory, as it is above the typical midpoint of 50. However, it is not yet exceeding the level of 70, which would suggest overbought conditions. Monitor for potential trend reversals as the RSI approaches that level.

Analysis for NASDAQ Composite (US) - March 05, 2025

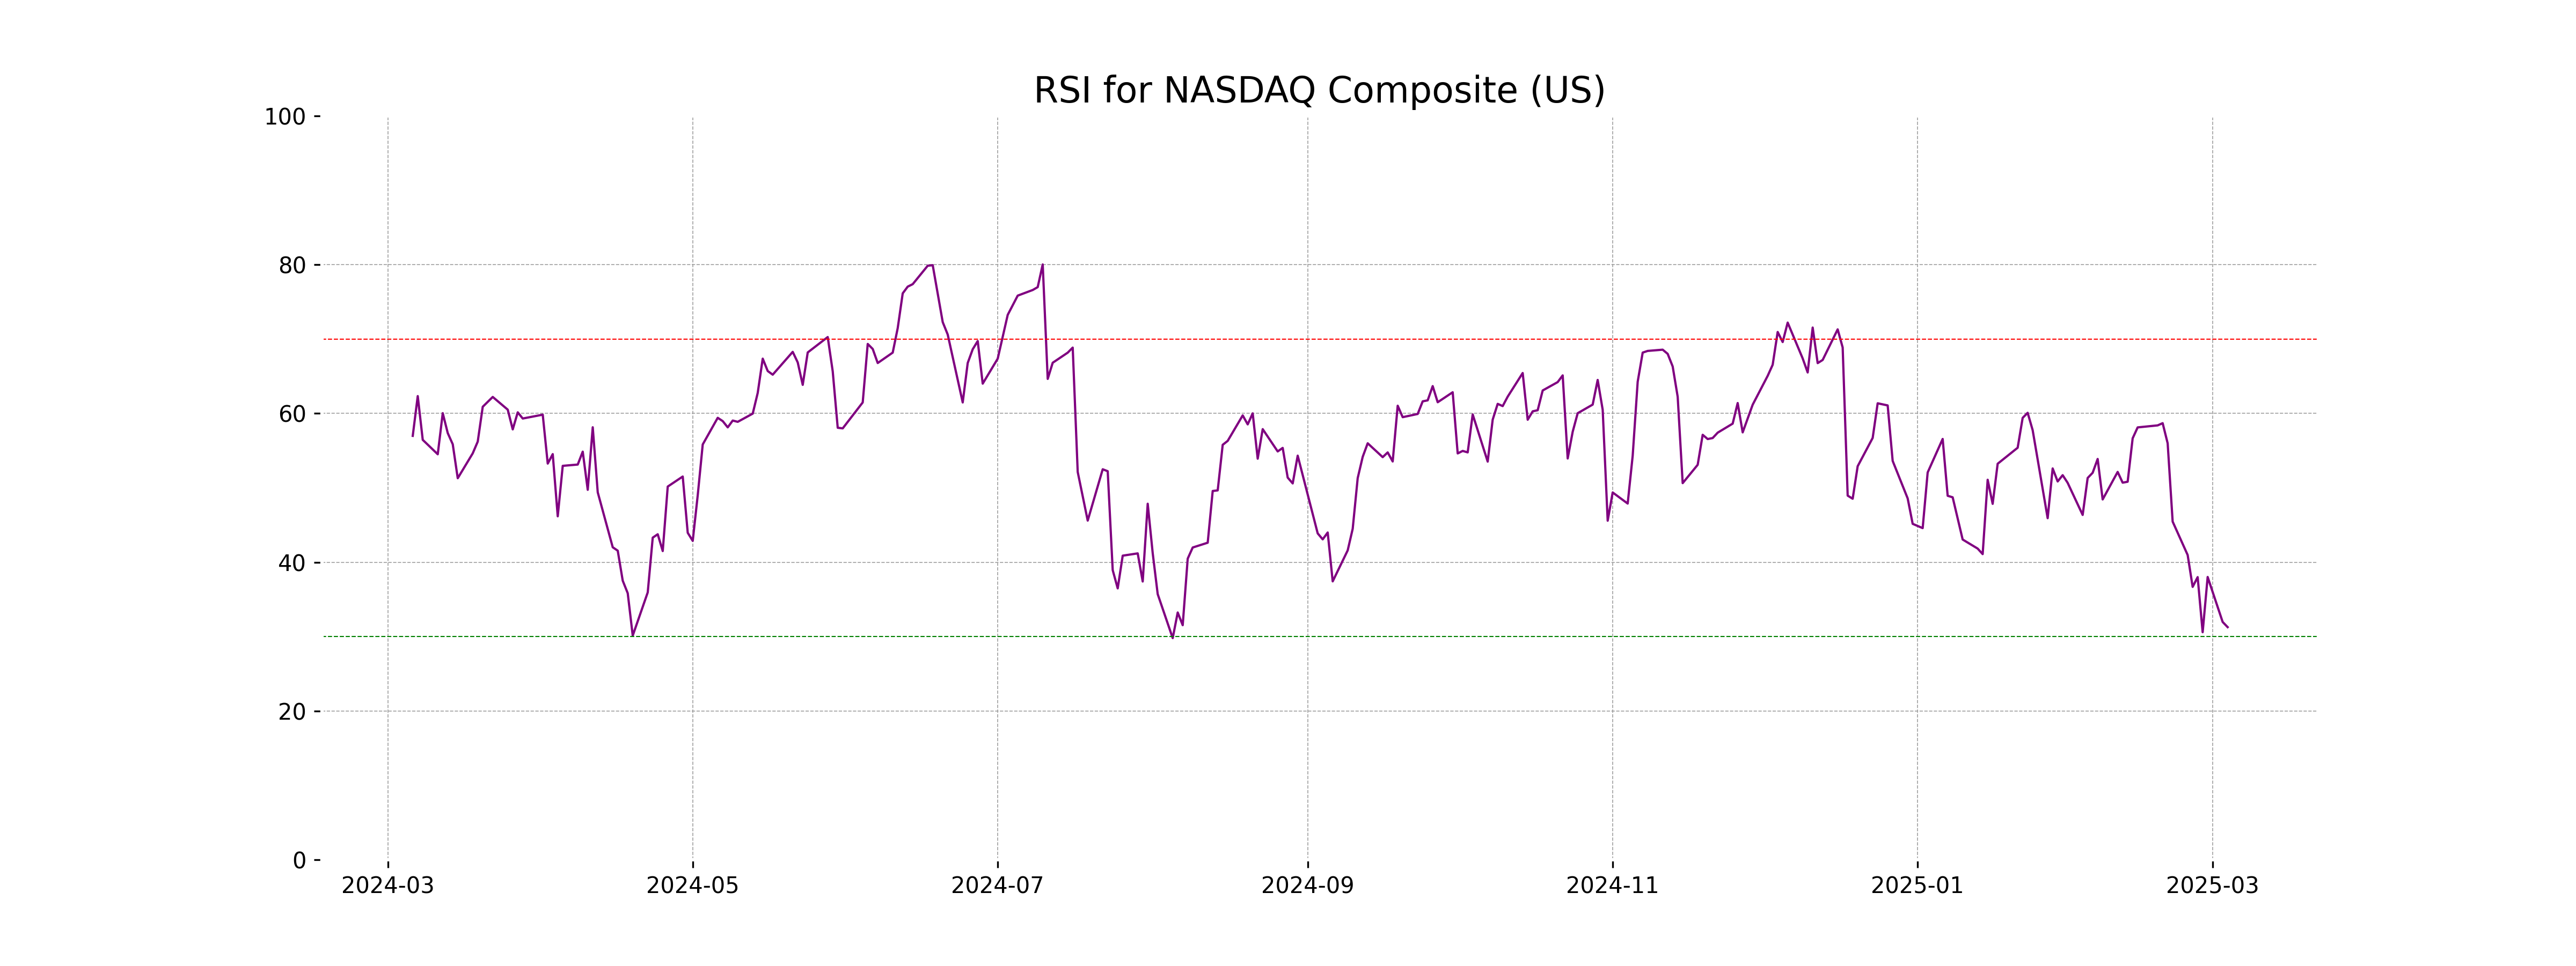
NASDAQ Composite (US) Performance: On the day in question, the NASDAQ Composite opened at 18176.43, reached a high of 18589.49, and closed at 18285.16, reflecting a decrease of 0.35% (65.03 points) from the previous close of 18350.19. The index volume stood at approximately 8.47 billion, with technical indicators such as the RSI at 31.27 suggesting oversold conditions, and the MACD indicating a bearish trend.

Relationship with Key Moving Averages
The NASDAQ Composite closed below its key moving averages, with the 10-EMA at 18932.25, 50-EMA at 19374.58, and 200-EMA at 18325.84, indicating short-term bearish momentum. The index's close of 18285.16 is below these averages, and the RSI at 31.27 suggests it is in oversold territory, while the MACD of -289.54 further confirms potential downside pressure.
Moving Averages Trend (MACD)
The MACD analysis for the NASDAQ Composite indicates a bearish trend, with a MACD value of -289.54, which is below the MACD Signal value of -123.75. This suggests that the momentum is currently weak, and there could be further downward pressure on the market.

RSI Analysis
RSI Analysis for NASDAQ Composite (US): The RSI of 31.27 indicates that the index is approaching the oversold territory, as RSI values below 30 typically suggest. This could signal a potential buying opportunity if it reverses upward, but further analysis of market conditions is advised for confirmation.
Analysis for Nikkei 225 (Japan) - March 05, 2025
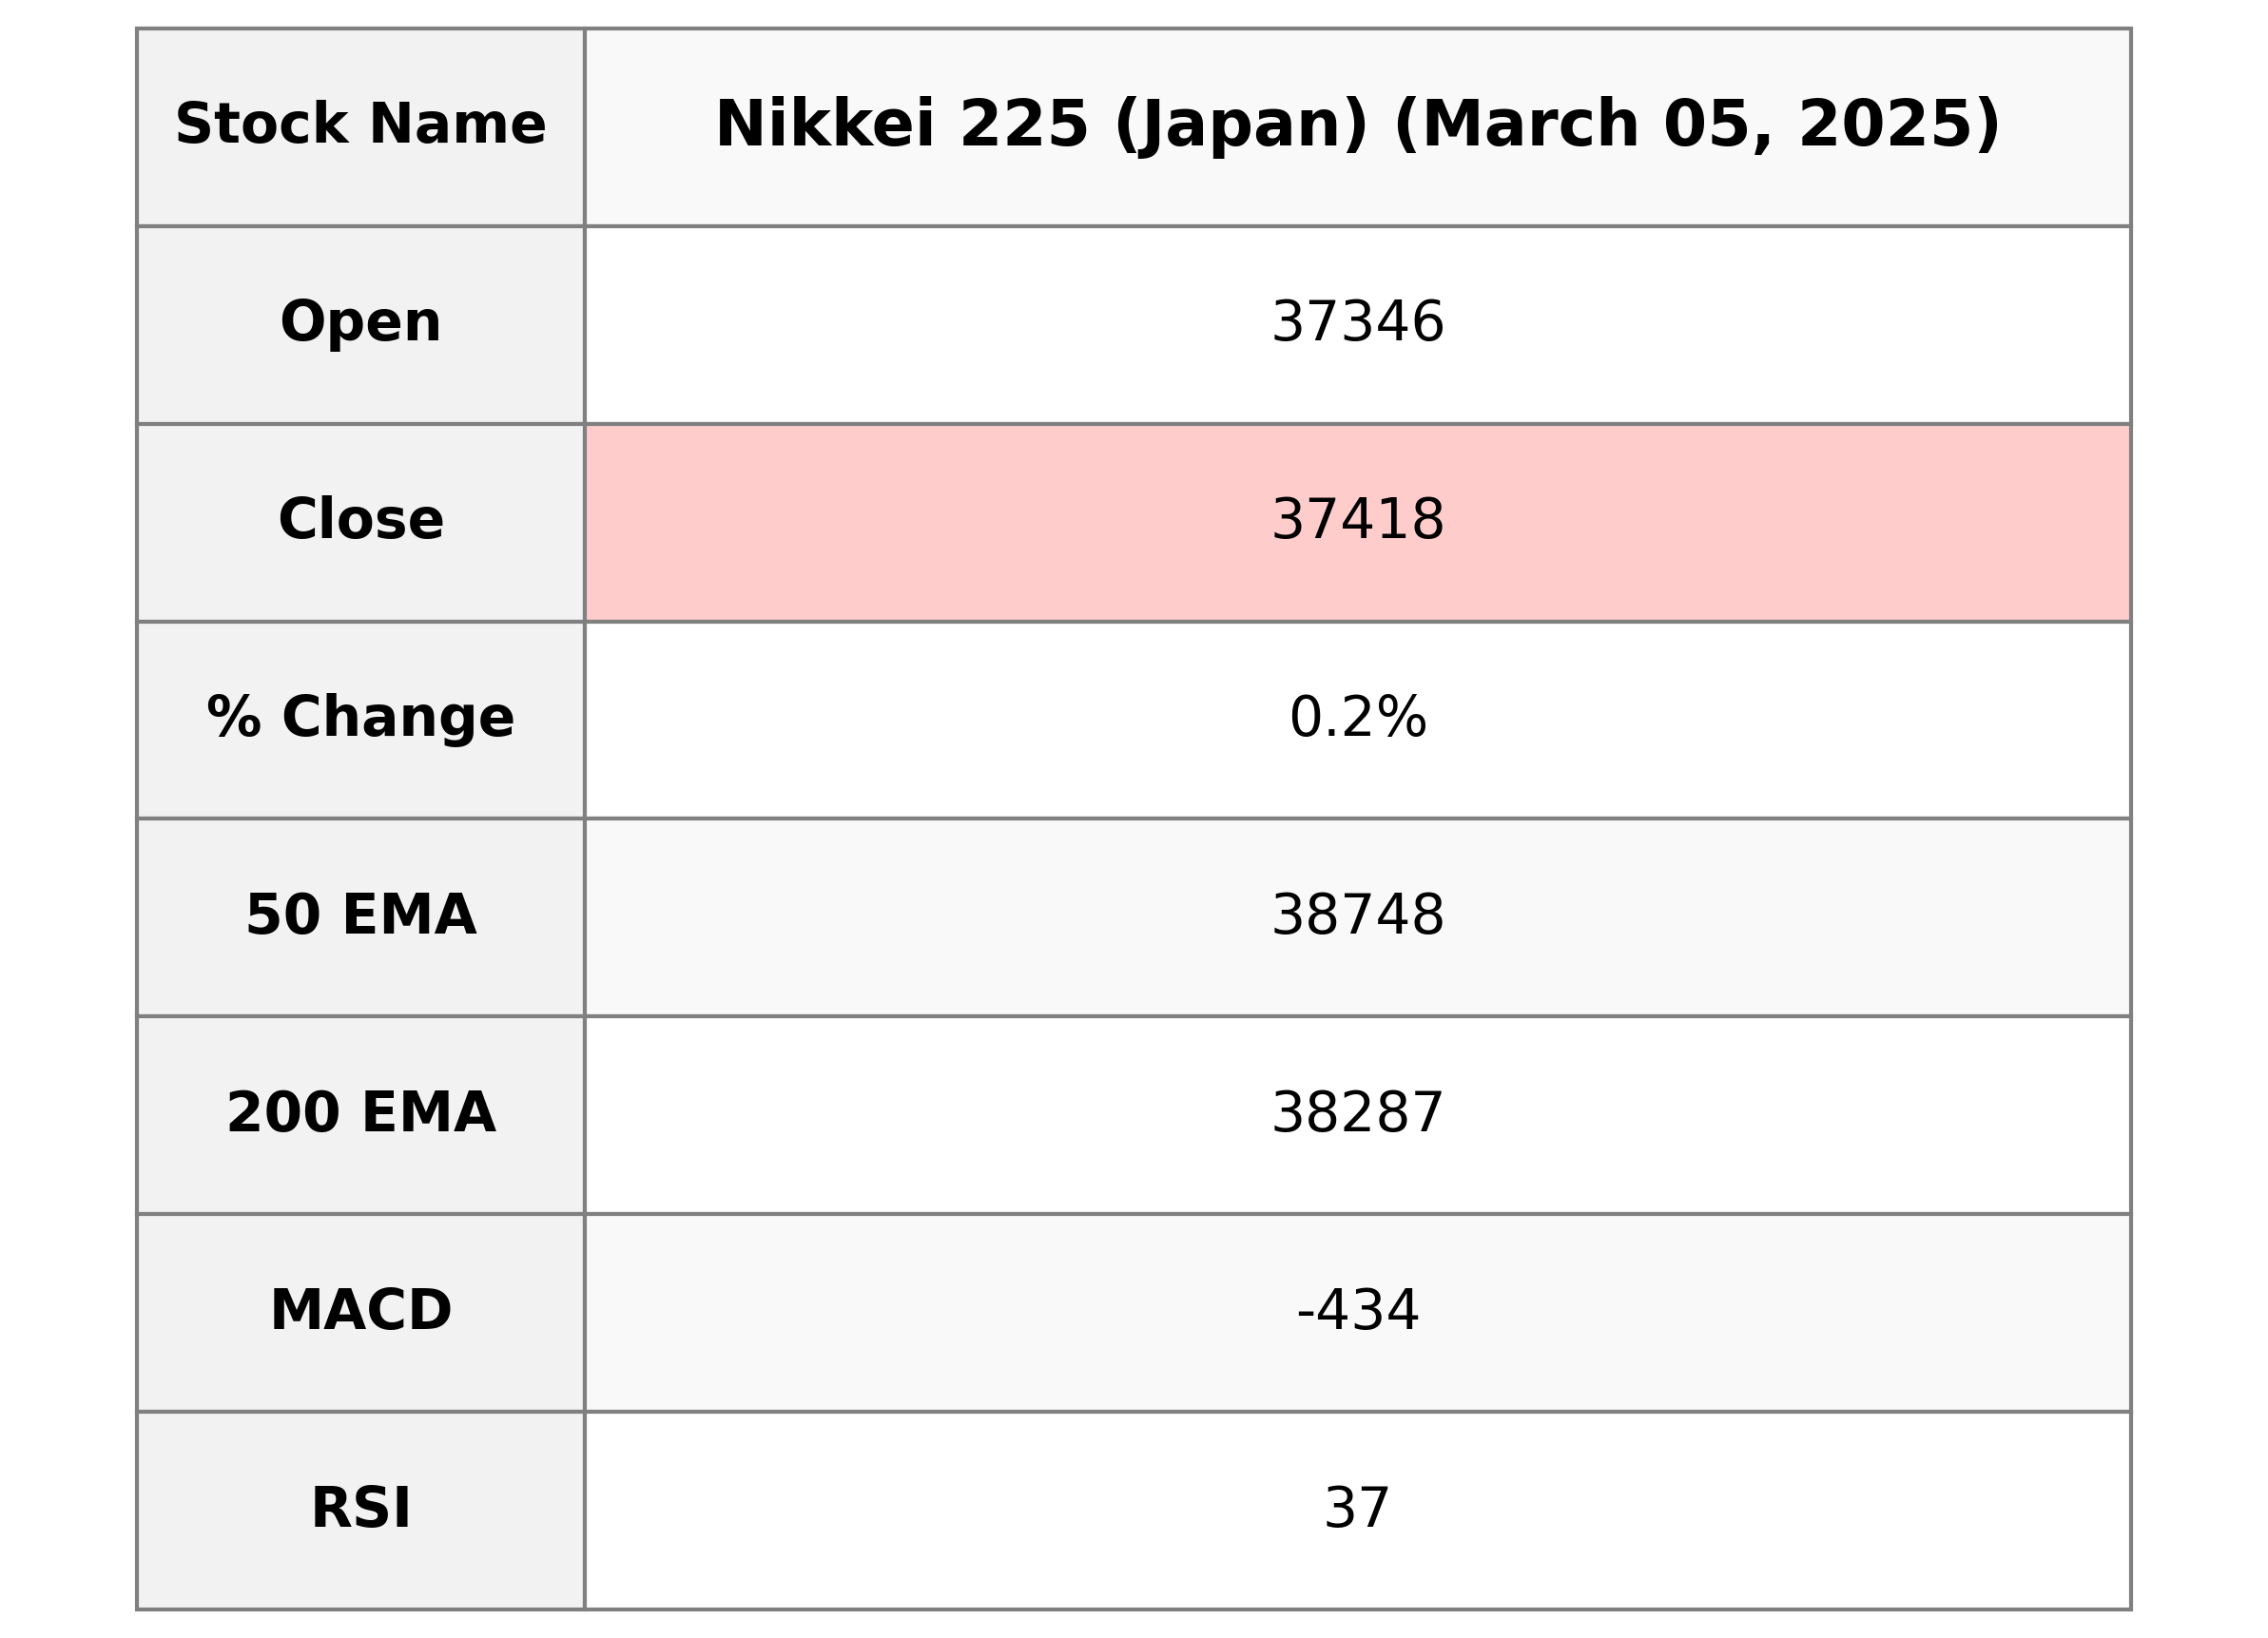
Nikkei 225 (Japan) opened at 37,345.74 and closed at 37,418.24, reflecting a slight increase of 0.23%, or 87.06 points, compared to its previous close of 37,331.18. The index exhibited volatility, trading between a high of 37,606.34 and a low of 37,178.72. The RSI indicates a level of 36.93, which might suggest that the index is approaching oversold conditions.

Relationship with Key Moving Averages
The Nikkei 225 is trading below its 50-day, 200-day, 10-day, and 20-day EMAs, indicating a possible bearish trend. The current price of 37,418.24 is below these key moving averages, suggesting weakness in the market's momentum. Additionally, an RSI of 36.93 may indicate the index is in or approaching oversold territory.
Moving Averages Trend (MACD)
Nikkei 225 is currently showing a bearish trend as the MACD value of -434.23 is below its signal line at -270.58. This suggests potential downward momentum in the market. Additionally, the RSI at 36.93 indicates that the index is nearing oversold conditions, which may foreshadow a possible reversal or continuation of the bearish trend.

RSI Analysis
The RSI value for Nikkei 225 is 36.93, indicating it is currently in the lower range and may be approaching an oversold condition. An RSI below 30 is generally considered oversold, suggesting potential for a price increase if the trend reverses.

Analysis for Nifty Bank - March 05, 2025

Nifty Bank opened at 48,241.30 and closed higher at 48,489.95, marking a positive change of 0.51% with a points change of 244.75. The technical indicators, such as the 10 EMA and 20 EMA, show that the price is below these moving averages, and the RSI at 41.86 indicates weak momentum. Additionally, the MACD is negative, suggesting a bearish trend in the market.

Relationship with Key Moving Averages
The Nifty Bank's current close at 48489.95 is below its 10 EMA of 48638.13 and significantly below its 50 EMA of 49573.84 and 200 EMA of 50024.25. This suggests that the index is in a short-term downtrend relative to these key moving averages.
Moving Averages Trend (MACD)
Based on the stock data, the MACD value for Nifty Bank is -354.60, which is below the MACD Signal of -280.34. This indicates a bearish momentum, suggesting that the stock price may continue to experience downward pressure.

RSI Analysis
Based on the stock data for Nifty Bank, the RSI stands at approximately 41.86. This indicates that the stock is in the lower range of the RSI scale, suggesting potential undervaluation or a bearish momentum. Investors may find this level appealing for further evaluation of buying opportunities.

Analysis for Nifty 50 - March 05, 2025

The Nifty 50 opened at 22,073.05 and closed higher at 22,337.30, marking a 1.15% increase with a point change of 254.65. Despite the gain, the RSI is relatively low at 33.97, indicating it might be approaching oversold conditions, and the MACD below its signal line suggests bearish momentum could still persist.

Relationship with Key Moving Averages
Nifty 50 closed at 22,337.30, which is below its 50-day EMA of 23,166.85 and 200-day EMA of 23,480.95, indicating potential bearish momentum. The index is also below its 10-day EMA of 22,459.03 and 20-day EMA of 22,717.24, further supporting the downward trend.
Moving Averages Trend (MACD)
MACD Analysis for Nifty 50: The MACD value of -309.03 compared to its signal line value of -245.73 suggests a bearish momentum, indicating potential continued downward pressure. This gap between the MACD and its signal line may hint at an ongoing weakening trend in the market.

RSI Analysis
The current RSI for Nifty 50 is 33.97, which indicates that the index is approaching oversold conditions. Typically, an RSI below 30 suggests that a stock is oversold, which might lead to a potential buying opportunity if other indicators are favorable.

Up Next

Global stock market indices: How the world markets performed today - 05 March 2025

Global stock market indices: How the world markets performed today - 11 April 2025

Sensex, Nifty surge nearly 2 pc as US suspends additional 26 pc tariffs on India till July 9

Indian stock market sector-wise performance today - April 11, 2025

NSE Nifty 50: Top 5 stock losers of April 11, 2025

Top 5 Nifty 50 gainers today – April 11, 2025: Biggest stock moves

More videos

Sensex, Nifty surge after White House tariff pause

Global stock market indices: How the world markets performed today - 10 April 2025

Asian stocks crack higher as Trump delays painful tariffs

Trump stuns with tariff backtrack but hikes China rate to 125%

Stock markets decline on global trends as fresh US tariffs unnerve investors

Global stock market indices: How the world markets performed today - 9 April 2025

Indian stock market sector-wise performance today - April 9, 2025

Top 5 Nifty 50 gainers today – April 9, 2025: Biggest stock moves

NSE Nifty 50: Top 5 stock losers of April 9, 2025

Trump's new tariffs take effect, with 104% on Chinese goods