


Highlights
- Sensex gained 1.19%, closing at 76,348.06 points
- Nifty Auto rose by 1.42%, reaching 21,623.05
- Nifty Bank increased to 0.72%, reaching 50,062.85
Latest news

Global stock market indices: How the world markets performed today - 21 March 2025

Indian stock market sector-wise performance today - March 21, 2025

Top 5 Nifty 50 gainers today – March 21, 2025: Biggest stock moves

NSE Nifty 50: Top 5 stock losers of March 21, 2025

Uttarakhand CM Dhami highlights three years of governance, women empowerment, and growth

Over 50,000 youth given self-employment in three years: Uttarakhand CM

Kuldeep Singh Dhaliwal holds 4th Monthly online NRI Milnee to resolve the grievances of NRI Punjabis

Bulldozer action on properties of two drug peddlers in Punjab's Fazilka
Indian stock market sector-wise performance today - March 20, 2025


The stock market on Thursday (March 20, 2025) witnessed a day of notable performances across various sectors and indices.
The BSE Sensex closed at 76,348.06, marking a significant daily increase of 1.19%. This positive movement was supported by multiple sectors showing strength.
The Nifty Auto index led the gains with an impressive rise of 1.42%. This surge in the automotive sector could be attributed to heightened investor confidence and potential upcoming developments in the sector influencing future growth prospects.
Elsewhere, the Nifty FMCG index saw a substantial increase of 1.29%, bolstered by an optimistic outlook on consumer demand and potential organic growth in fast-moving consumer goods.
The infrastructure sector also gained momentum as reflected by the Nifty Infra index's 1.45% rise, likely driven by positive government policy expectations or increased infrastructure spending announcements.
On a similar note, the Nifty IT and Nifty Metal indices reported respectable gains of 1.25% and 1.15%, respectively.
The IT sector often reacts to global technology trends and potential increases in international demand, while the metal sector's performance could be tied to fluctuations in raw material prices or industrial demand.
Additionally, the banking sector represented by Nifty Bank reported a more moderate gain of 0.72%, as banks continue to navigate interest rate adjustments and regulatory changes.
The Nifty Energy index experienced an increase of 0.81%, reflecting shifts within energy markets or speculative trading activities in energy stocks.
However, the spotlight of the day was on the Nifty Auto index, not only being the top gainer but also potentially displaying investor anticipation of strategic industry moves or new product developments bolstering its growth outlook.
The bullish sentiment across these sectors underscores a robust and diversified market day where optimism prevailed.
Overall, the market movements indicated healthy recovery patterns and an upbeat sentiment, rung in by optimism in both domestic and global economic conditions, pushing most sectors to close on a high note.

Analysis for Sensex - March 20, 2025

Stock Name: BSE Sensex Open: 75917.11 High: 76456.25 Low: 75684.58 Close: 76348.06 Previous Close: 75449.05 Percentage Change: 1.19% Points Change: 899.02 Volume: 0.0 50-Day EMA: 75923.65 200-Day EMA: 77151.25 10-Day EMA: 74870.72 20-Day EMA: 74893.51 RSI: 61.76 MACD: -254.23 MACD Signal: -592.47 Performance Summary: The BSE Sensex showed a positive performance with a significant increase of 899.02 points, closing at 76348.06. The Relative Strength Index (RSI) is at 61.76, indicating positive momentum. The index remains below its 200-day EMA, suggesting long-term trends are still to be observed.

Relationship with Key Moving Averages
The Sensex closed at 76348.06, above its 50-day EMA of 75923.65, indicating a short-term bullish sentiment. However, it remains below the 200-day EMA of 77151.25, suggesting a longer-term bearish trend.
Moving Averages Trend (MACD)
MACD Analysis for Sensex: The MACD value of -254.23 is above its signal line at -592.47, indicating a bullish momentum. This crossover suggests a potential upward trend continuation for Sensex.

RSI Analysis
RSI Analysis for Sensex: The RSI of the Sensex is 61.76, indicating a moderately strong momentum in the current market condition. This suggests that the index is leaning toward the overbought region but has not yet entered into the overbought territory, which is typically considered over 70.

Analysis for Nifty Auto - March 20, 2025

Nifty Auto opened at 21,444.30 and closed at 21,623.05, registering a percentage change of 1.42% with a points increase of 303.55 from the previous close. The RSI stands at 53.38, indicating a neutral market condition. MACD is currently at -283.87, suggesting a bearish trend; however, the positive change in the closing price may indicate a potential reversal or consolidation.

Relationship with Key Moving Averages
Nifty Auto opened at 21444.3 and closed at 21623.05, showing a 1.42% increase from the previous close of 21319.5. The closing price is below the 50-day EMA of 21915.54 and the 200-day EMA of 22816.58, indicating potential resistance levels. However, it is above the 10-day EMA of 21100.45 and the 20-day EMA of 21247.15, suggesting short-term bullish momentum.
Moving Averages Trend (MACD)
Nifty Auto MACD Analysis: The MACD for Nifty Auto is currently at -283.87, while the MACD Signal is at -420.35. This indicates a recent bullish crossover and suggests some upward momentum in the price trend. However, being negative implies that the index is still in bearish territory overall.

RSI Analysis
RSI Analysis for Nifty Auto: The Relative Strength Index (RSI) for Nifty Auto is currently at 53.38, which indicates a neutral market position, suggesting neither overbought nor oversold conditions. This level implies a balance between bullish and bearish momentum, and traders may watch for potential directional shifts.

Analysis for Nifty Energy - March 20, 2025

Nifty Energy opened at 33013.15, fluctuated between a high of 33042.95 and a low of 32580.35, and closed slightly lower at 33001.05. The index witnessed a positive change of 0.81%, gaining 266 points over the previous close of 32735.05. The RSI stands at 62.27, indicating bullish momentum, supported by a positive MACD level at 43.68.

Relationship with Key Moving Averages
Nifty Energy is currently trading above its 50 EMA of 32620.41, indicating a short-term bullish trend. However, it is below its 200 EMA of 36030.83, suggesting that in the longer term, it may still be in a bearish phase. The 10 EMA and 20 EMA values are also below the current price, supporting the short-term upward momentum.
Moving Averages Trend (MACD)
Nifty Energy MACD Analysis: The MACD value of 43.68 is significantly above the MACD Signal of -265.39, indicating a strong positive momentum. This suggests a potential bullish trend for Nifty Energy in the short term.

RSI Analysis
RSI Analysis for Nifty Energy: The current RSI for Nifty Energy stands at 62.27, which indicates a moderately strong momentum, suggesting that the stock is approaching overbought conditions. This implies potential caution is advised for new investments or holding positions, as a continued rise may precede a reversal.

Analysis for Nifty FMCG - March 20, 2025

Nifty FMCG Performance Nifty FMCG opened at 52,443.45 and closed at 52,857.90, showing a percentage change of 1.29% and a points change of 673.80. The index's RSI stands at 52.23, indicating a neutral trend. The MACD of -461.81, with the signal at -732.17, suggests bearish momentum still persists, but it is narrowing.

Relationship with Key Moving Averages
Nifty FMCG closed at 52857.90, which is above the 10-day EMA of 52156.72 and the 20-day EMA of 52352.40, indicating a short-term bullish trend. However, it remains below the 50-day EMA of 53717.03 and the 200-day EMA of 56431.99, suggesting long-term bearishness.
Moving Averages Trend (MACD)
The MACD value for Nifty FMCG is -461.81, which is higher than the MACD signal line at -732.17. This suggests a bullish crossover, indicating potential upside momentum developing in the index. The RSI at 52.23 supports a neutral to slightly positive outlook, suggesting moderate buying interest.

RSI Analysis
RSI Analysis for Nifty FMCG: The Relative Strength Index (RSI) for Nifty FMCG stands at 52.23, indicating a neutral position. An RSI level around 50 suggests that the stock neither overbought nor oversold, implying a balance between buying and selling pressures in the market.

Analysis for Nifty Infra - March 20, 2025

Nifty Infra opened at 8225.30 and closed higher at 8282.45, showing a percentage change of approximately 1.45% and a points change of 118.5. The relative strength index (RSI) is at 64.26, indicating a moderately strong upward momentum. The moving averages show the 50 EMA at 8128.03, contrasting the lower 10 EMA at 8044.50, suggesting some recent upward movement.

Relationship with Key Moving Averages
Nifty Infra closed above the 50 EMA and 10 EMA, indicating a short-term bullish trend, while it remains below the 200 EMA, suggesting a potential longer-term downtrend. The RSI value of 64.26 indicates moderate momentum, leaning slightly towards the overbought territory.
Moving Averages Trend (MACD)
The MACD value for Nifty Infra is 6.7312, which is above the MACD Signal line at -47.8112. This suggests a bullish crossover, indicating potential upside momentum in the near term.

RSI Analysis
The RSI for Nifty Infra is 64.26, which suggests that the stock is approaching overbought conditions. Traders often view RSI values above 70 as overbought and values below 30 as oversold, so the current RSI indicates some upward momentum but isn't yet at overbought levels.

Analysis for Nifty IT - March 20, 2025

Nifty IT opened at 36444.55, reached a high of 37109.85, and closed at 36676.65. The index saw a percentage change of 1.25%, translating to a points change of 453.15. Despite the positive daily performance, Nifty IT's 50 EMA and 200 EMA values are significantly higher than the closing price, indicating a potential bearish trend. The RSI value of 32.79 suggests it is in the oversold territory.

Relationship with Key Moving Averages
Nifty IT closed at 36676.65, which is below its 50 EMA of 39934.31, 200 EMA of 40231.23, and slightly below its 10 EMA of 36938.14, indicating a potential bearish sentiment in the short to medium term. The RSI at 32.79 suggests that it may be approaching oversold conditions.
Moving Averages Trend (MACD)
Nifty IT MACD Analysis: The MACD of -1343.26 and the MACD Signal of -1337.21 suggest a bearish momentum for Nifty IT. With the MACD line below the signal line, the current trend is expected to remain downward unless there's a significant shift in momentum.

RSI Analysis
The RSI for Nifty IT stands at 32.79, which is below the typical threshold of 30, indicating that the index is nearing oversold territory. This suggests potential downward momentum might shift, possibly leading to a buying opportunity if other indicators align.

Analysis for Nifty Metal - March 20, 2025

Nifty Metal Performance: Nifty Metal experienced a positive trading session, with a closing price of 9254.10, representing a 1.15% increase from the previous close of 9148.55. The trading indicators suggest strong momentum, highlighted by a high RSI of 69.55 and an MACD of 181.97, both indicating bullish tendencies in the market.

Relationship with Key Moving Averages
The closing price of Nifty Metal is 9254.10, which is above the 50-EMA of 8656.07, 200-EMA of 8800.06, 10-EMA of 8930.55, and 20-EMA of 8760.53, indicating bullish momentum with a significant gap from these key moving averages.
Moving Averages Trend (MACD)
The MACD for Nifty Metal is 181.97, while the signal line is 118.83, indicating a positive trend with bullish momentum as the MACD line is above the signal line. This suggests that the index might continue to experience upward movement if the trend persists. Additionally, with the RSI at 69.55, Nifty Metal is nearing overbought conditions.

RSI Analysis
RSI Analysis for Nifty Metal The Relative Strength Index (RSI) for Nifty Metal is at 69.55, indicating that the index is nearing overbought territory. An RSI above 70 suggests that the asset may be overvalued and could be due for a pullback or a trend reversal. With the current reading close to this level, investors should monitor the market closely for signs of a potential correction.

Analysis for Nifty Bank - March 20, 2025

Nifty Bank opened at 49,947.60 and closed at 50,062.85, marking a 0.72% increase with a points change of 360.25 from the previous close of 49,702.60. The trading session saw a high of 50,155.30 and a low of 49,771.65. The Relative Strength Index (RSI) of 64.02 indicates that the index is in a moderately strong position.

Relationship with Key Moving Averages
The current close price of Nifty Bank, 50,062.85, is above its 50-day EMA (49,296.97), 20-day EMA (48,866.29), and 10-day EMA (48,956.71), indicating a bullish trend. However, it is slightly above the 200-day EMA (49,899.14), suggesting a possible reversal if it can't maintain this position.
Moving Averages Trend (MACD)
The MACD for Nifty Bank is -15.97, which is below the MACD Signal line at -232.21, indicating a potential bullish momentum as it is moving towards the signal line. The position of the MACD suggests that while it's still in the negative territory, it may be showing signs of transition that traders could interpret as a possible upcoming positive trend.

RSI Analysis
The RSI value for Nifty Bank is 64.02, indicating a moderately strong momentum in the stock price. Since it is below 70, it suggests that the stock is not yet in the overbought zone, allowing for potential further upward movement.

Analysis for Nifty 50 - March 20, 2025

Nifty 50 opened at 23036.60 and closed at 23190.65, marking a positive change of 1.24% from the previous close of 22907.60. The index experienced a high of 23216.70 and a low of 22973.95 during the trading session, with notable points change of 283.05. The RSI stands at 62.94, indicating a relatively strong momentum, while the MACD suggests an ongoing bearish trend but with signs of convergence.
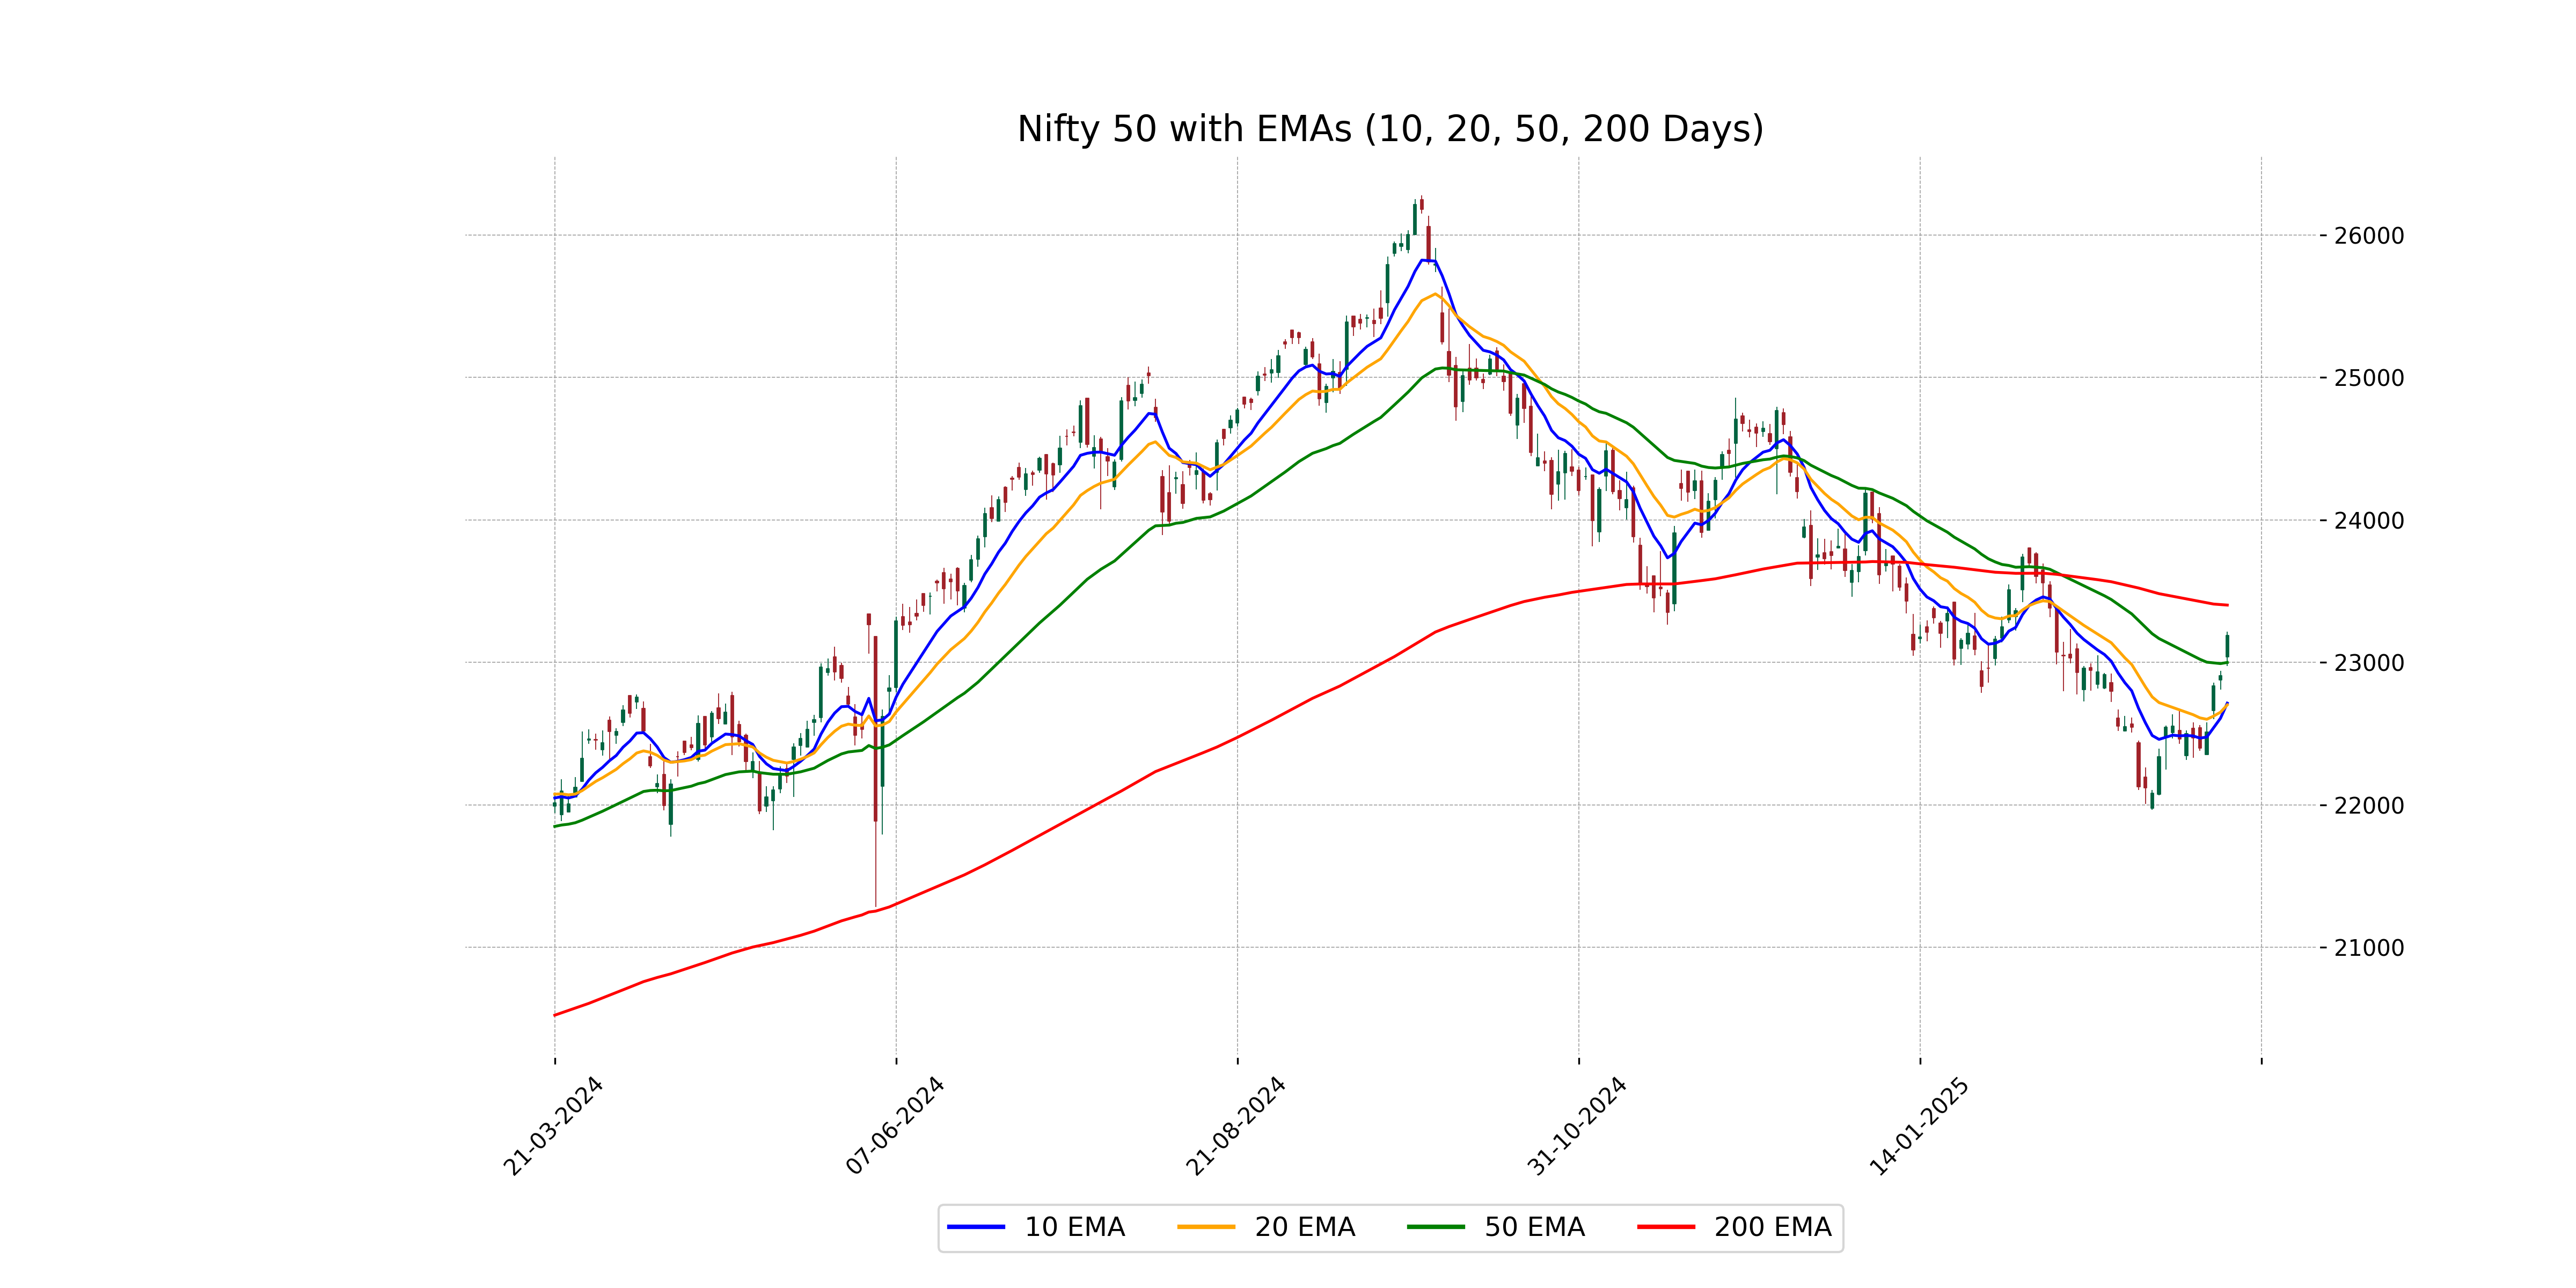
Relationship with Key Moving Averages
The Nifty 50 closed above its 50-day EMA, indicating a short-term bullish trend, and it also surpassed its 20-day and 10-day EMAs. However, it remains below the 200-day EMA, suggesting a long-term bearish trend.
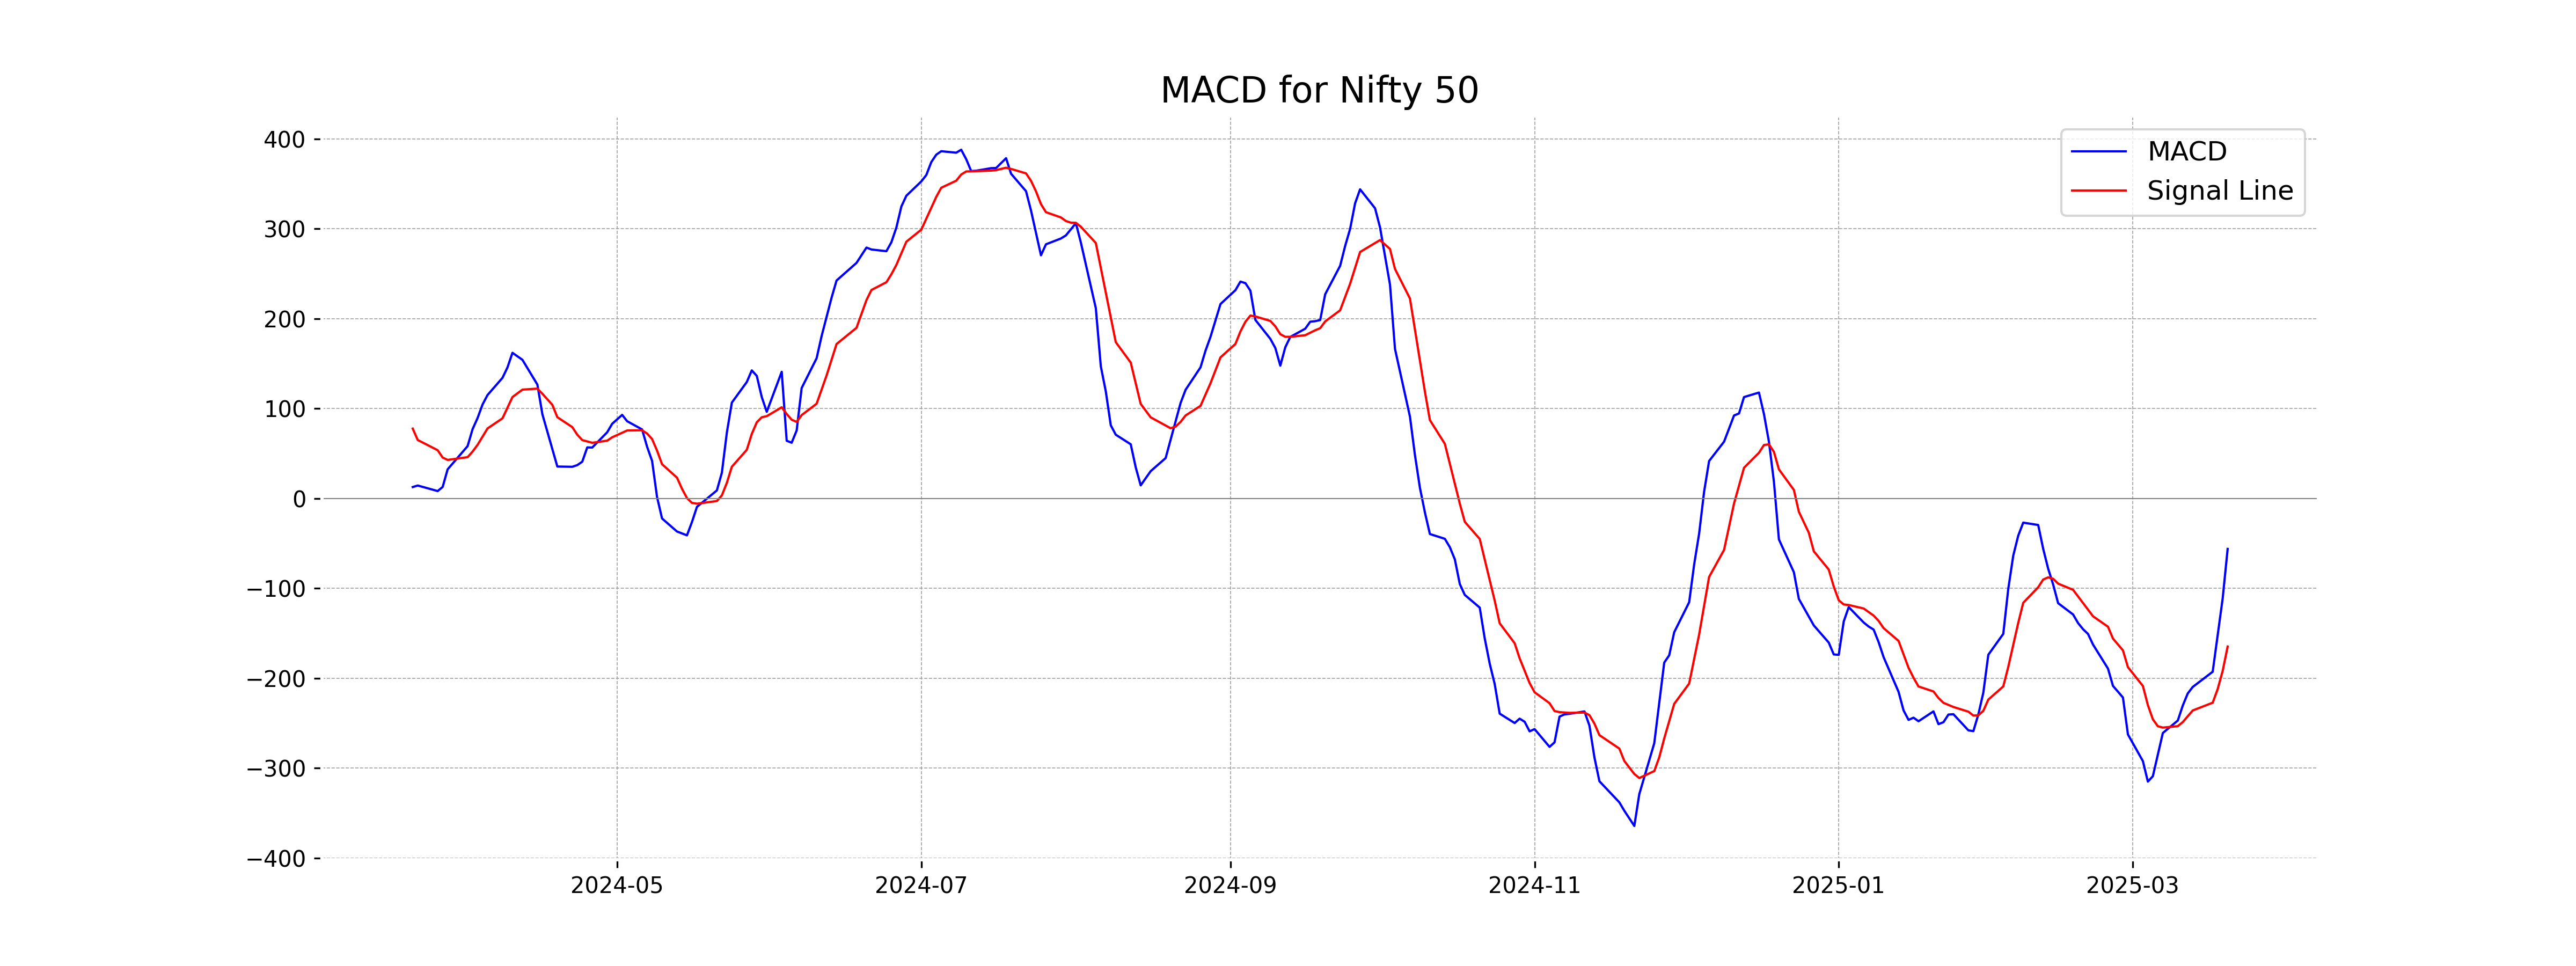
Moving Averages Trend (MACD)
Based on the MACD analysis for Nifty 50, the MACD value of -56.12 is higher than the MACD Signal value of -164.77, indicating potential bullish momentum. The RSI of 62.94 supports this by suggesting a moderately strong market, although investors should remain cautious of overbought conditions.
RSI Analysis
The RSI for Nifty 50 is 62.94, indicating that it is in a moderately strong position. Values above 60 suggest a potentially bullish trend, and it is approaching overbought conditions as RSI nears 70, warranting cautious optimism.

Up Next

Indian stock market sector-wise performance today - March 20, 2025
Global stock market indices: How the world markets performed today - 21 March 2025
Indian stock market sector-wise performance today - March 21, 2025
Top 5 Nifty 50 gainers today – March 21, 2025: Biggest stock moves
NSE Nifty 50: Top 5 stock losers of March 21, 2025

Global stock market indices: How the world markets performed today - 20 March 2025

More videos

Top 5 Nifty 50 gainers today – March 20, 2025: Biggest stock moves

NSE Nifty 50: Top 5 stock losers of March 20, 2025

Vodafone Idea explores satellite partnerships amid competitor moves

Global stock market indices: How the world markets performed today - 19 March 2025

Indian stock market sector-wise performance today - March 19, 2025

Top 5 Nifty 50 gainers today – March 19, 2025: Biggest stock moves

Global stock market indices: How the world markets performed today - 18 March 2025

Indian stock market sector-wise performance today - March 18, 2025

Top 5 Nifty 50 gainers today – March 18, 2025: Biggest stock moves

NSE Nifty 50: Top 5 stock losers of March 18, 2025