


Explore key technical insights into low-performing Indian stocks—CIPLA, HINDALCO, ONGC, Tata Motors, and Tata Steel—through MACD, RSI, and moving average trends as of April 2025.
Highlights
- Cipla, Tata Motors, Hindalco stocks trend bearish
- Low RSI suggests oversold conditions across stocks
- MACD indicators point to continued downward momentum
Latest news
Pahalgam tragedy casts shadow on Indo-Pak cricket
MS Dhoni to play his 400th T20 match as CSK faces SRH
India stands tall amid tragedy: Piyush Goyal
ED raids Congress MLA Vinay Kulkarni's properties
VHP stages protest in Kolkata over Pahalgam attack
Kartarpur corridor stays open amid tensions
Hero and terrorist: The tale of two Adils in Pahalgam
Pahalgam survivor recalls horror, wife prays Shiva
NSE Nifty 50: Top 5 stock losers of April 4, 2025


In this article, we will explore the technical indicators of some of the low-performing stocks on the Indian stock market, including CIPLA, HINDALCO, ONGC, TATAMOTORS, and TATASTEEL.
By looking at these stocks through the lens of key technical factors, we aim to better understand their price movements, trends, and potential future performance.

Analysis for Cipla - April 04, 2025

Cipla experienced a notable drop in its stock performance with a close at 1415.25, marking a decrease of approximately 5.38% from the previous close of 1495.70. Such a movement resulted in a points change of -80.45, and the stock registered a lower trading volume compared to averages, with the RSI at 40.26 indicating a possible oversold condition. In the Healthcare sector, specializing in Drug Manufacturers - Specialty & Generic, Cipla's current market cap is 1,142,979,952,640 INR.

Relationship with Key Moving Averages
Cipla's current stock price is trading below its key moving averages, with the close at 1415.25 compared to the 50 EMA of 1467.92, the 200 EMA of 1474.16, the 10 EMA of 1464.60, and the 20 EMA of 1468.21. This indicates a potential bearish trend as the current price is lower than these averages, suggesting downward momentum in the short to medium term.
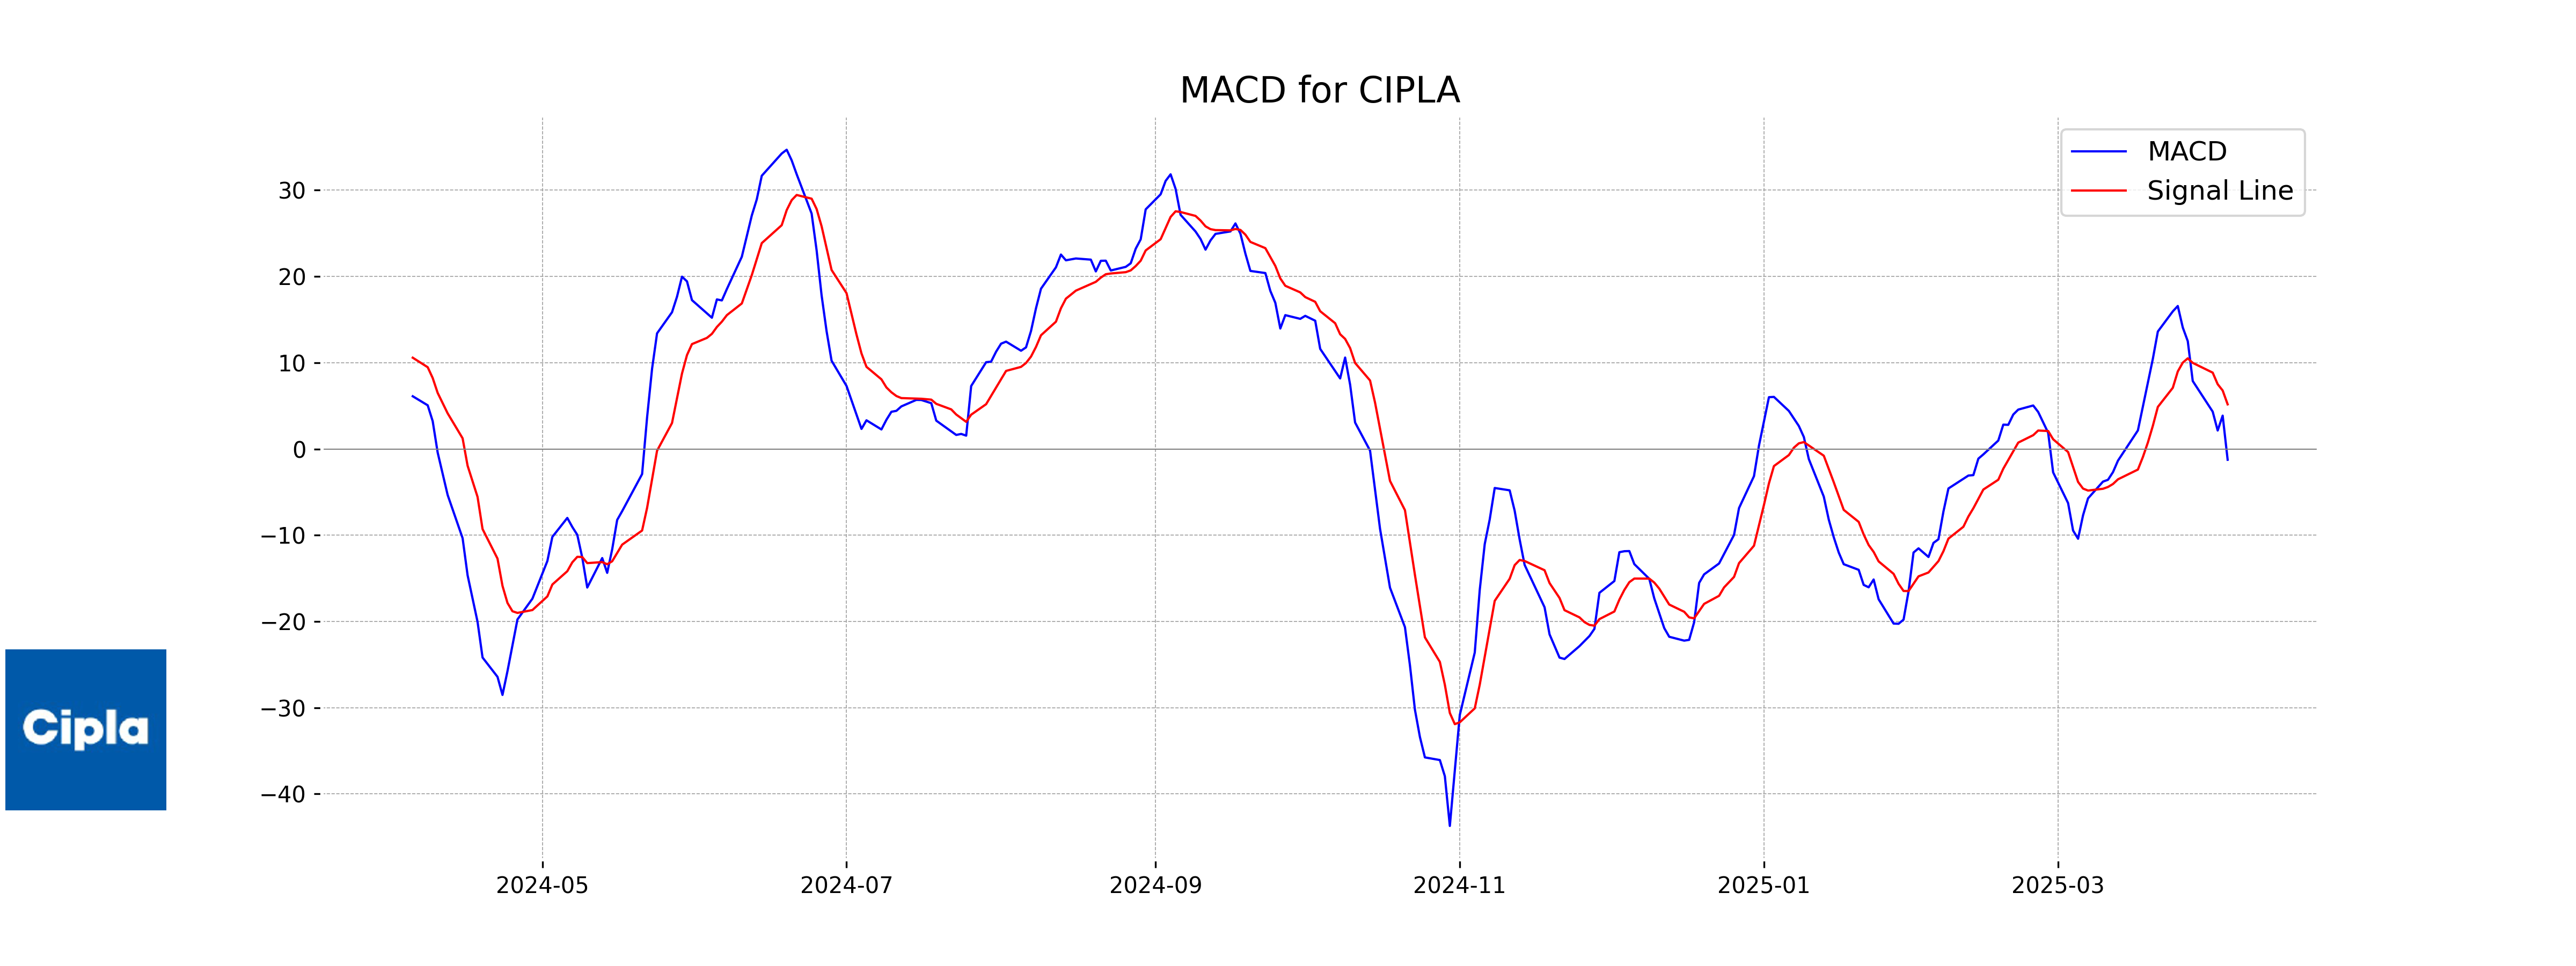
Moving Averages Trend (MACD)
Cipla's MACD value of -1.25 indicates that the stock's momentum is bearish, as the MACD line is below the signal line, suggesting potential further downside movements. Investors might want to exercise caution until a bullish reversal signal is observed.
RSI Analysis
Cipla's RSI is 40.26, which is below the neutral level of 50, indicating that the stock is leaning towards the oversold territory. This suggests potential bearish sentiment in the market for Cipla at the moment.

Analysis for HINDALCO - April 04, 2025

## HINDALCO Performance Hindalco recently experienced a significant decline in its stock price, closing at 599.95 compared to the previous close of 652.65, marking a decrease of approximately 8.07%. The Relative Strength Index (RSI) stands at 29, indicating that the stock might be oversold, and the company maintains a healthy PE Ratio of 9.62.

Relationship with Key Moving Averages
The stock price of Hindalco, with a closing price of 599.95, is below its key moving averages: 50 EMA (652.04), 200 EMA (639.60), 10 EMA (661.54), and 20 EMA (665.98). This indicates that the stock is currently in a downtrend relative to these averages.
Moving Averages Trend (MACD)
The MACD for Hindalco is positive at 1.03, however, the MACD line is below the signal line (11.99), suggesting a bearish trend. It may be indicative of downside momentum until a crossover or a reversal in trend is observed.

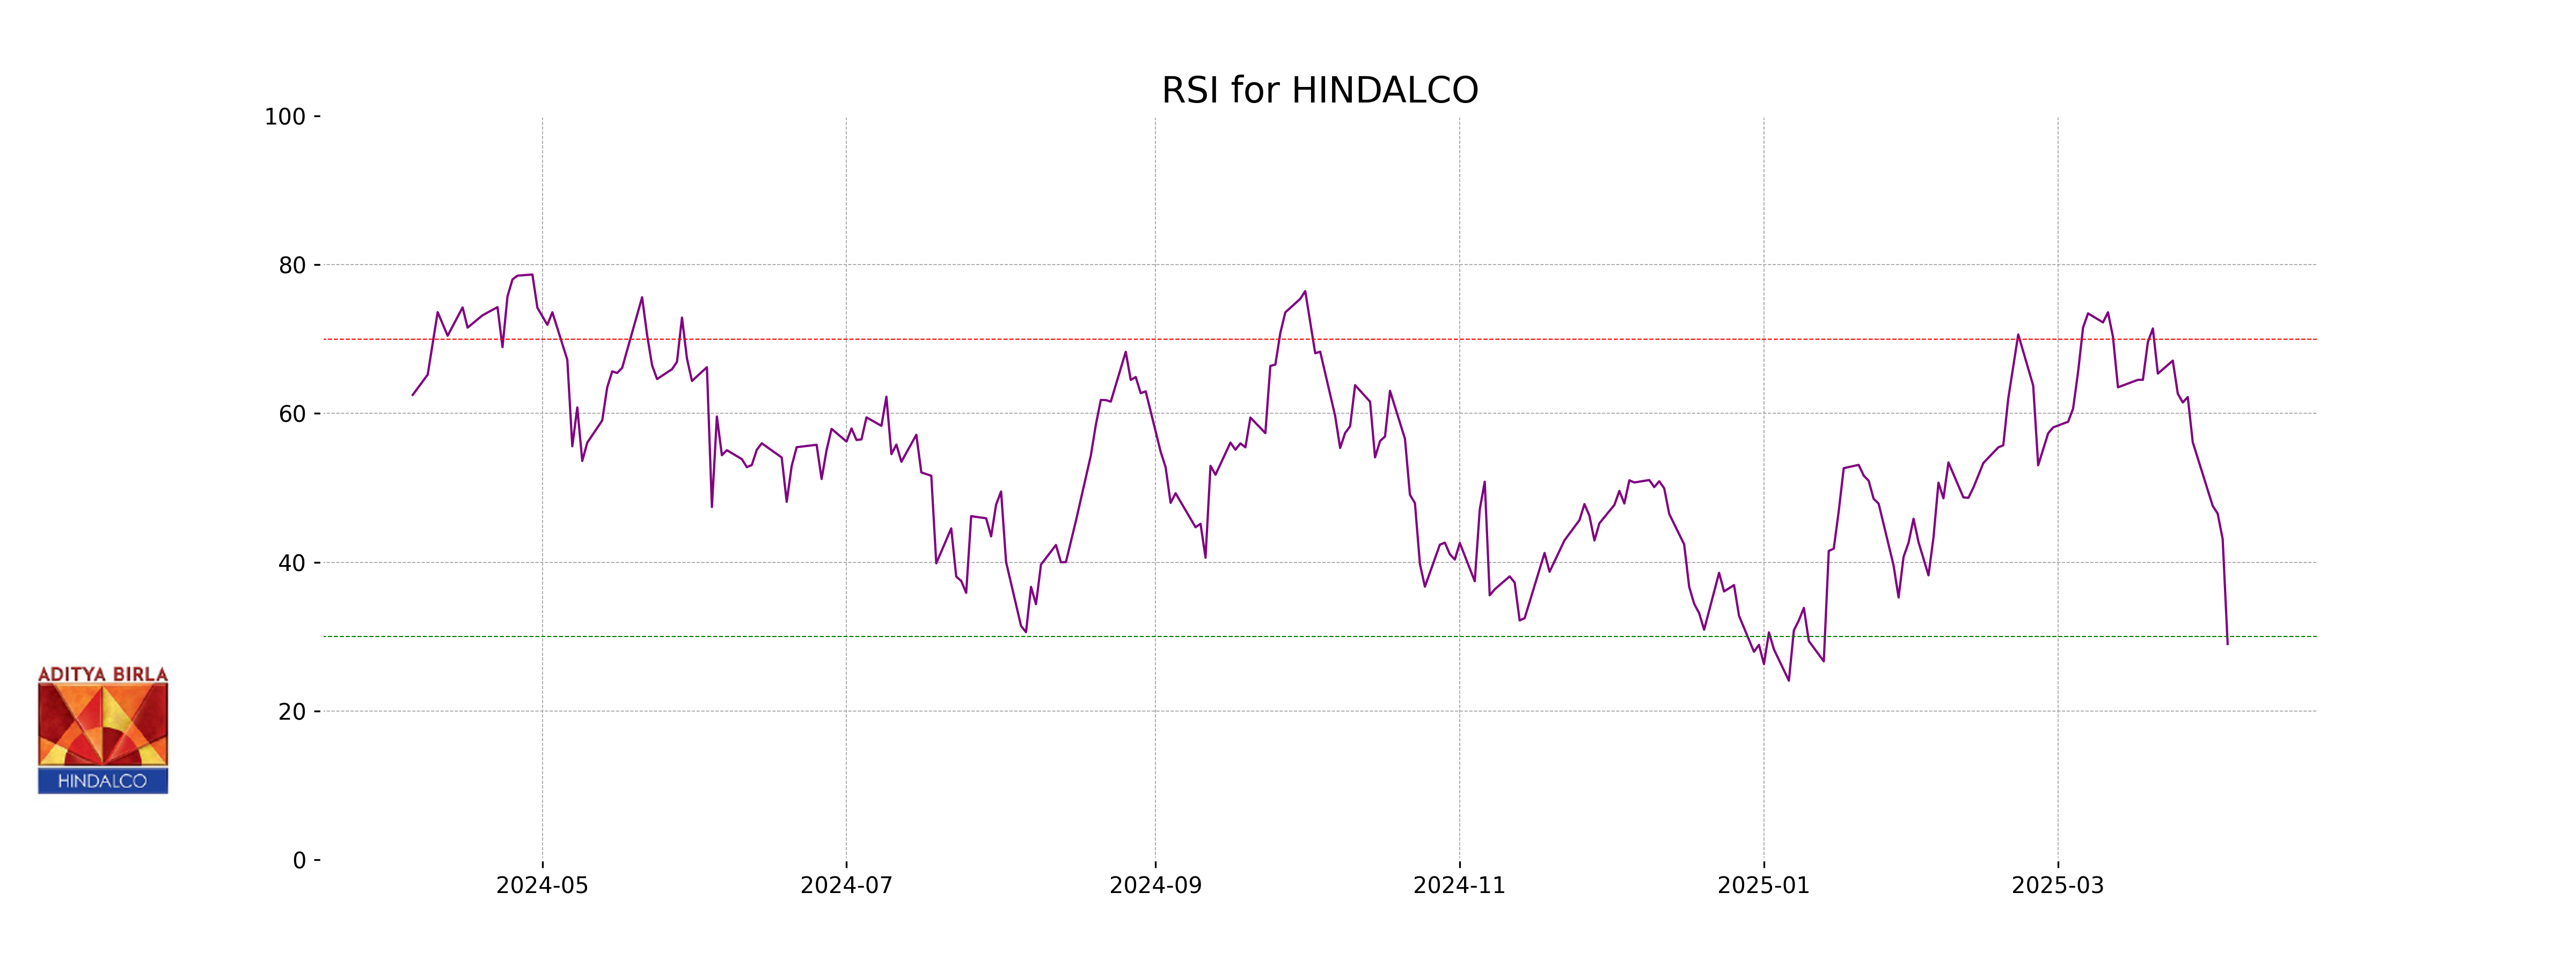
RSI Analysis
The RSI for Hindalco is 29.00, which typically indicates that the stock may be oversold and could be due for a potential rebound. An RSI below 30 often suggests overselling pressure and may warrant investor consideration for a possible opportunity.
Analysis for ONGC - April 04, 2025

ONGC has experienced a notable decrease in its stock price with a closing value of 226.01, reflecting a -7.11% change from the previous close of 243.31. The stock's technical indicators, such as an RSI of 39.21, suggest it's approaching oversold conditions. Despite a decline, the company maintains a strong market cap of 2,843,725,529,088 INR, indicating its significant role in the energy sector.

Relationship with Key Moving Averages
The current close of 226.01 is below both the 50-day EMA (239.66) and the 200-day EMA (249.24), indicating a bearish trend. The RSI at 39.21 further supports a weakened momentum, as it is below the neutral level of 50.
Moving Averages Trend (MACD)
The MACD for ONGC is 1.3575 with a MACD Signal of 1.0222, indicating a bullish crossover. This suggests potential positive momentum, although investors should monitor other technical factors like RSI and volume for confirmation.

RSI Analysis
The RSI (Relative Strength Index) for ONGC is 39.21, indicating that the stock is approaching oversold territory, as RSI values below 30 are generally considered oversold. This suggests that the stock may experience a potential reversal or bullish correction in the near term if selling pressure continues.

Analysis for Tata Motors - April 04, 2025

Tata Motors has shown a decline in its stock performance, with the closing price at 613.85, marking a significant drop of 6.13% from its previous close of 653.95. The Relative Strength Index (RSI) at 31.58 indicates the stock is nearing an oversold condition, while the MACD also signals bearish momentum with a negative value. Despite these indicators, the stock maintains a solid PE Ratio of 7.09, reflecting its earnings performance.

Relationship with Key Moving Averages
Tata Motors' latest closing price of 613.85 is below its key moving averages, namely the 10 EMA (663.92), 20 EMA (669.21), 50 EMA (688.73), and 200 EMA (791.86). This indicates a bearish trend, with the stock trading significantly below its short- and long-term average prices.
Moving Averages Trend (MACD)
Tata Motors' MACD analysis indicates a bearish trend, as the MACD value of -5.97 is below the MACD Signal value of -1.72. This suggests that the stock is experiencing downward momentum and traders might be cautious until a potential reversal signal appears.

RSI Analysis
RSI Analysis for Tata Motors The RSI (Relative Strength Index) for Tata Motors is 31.58, which indicates that the stock is approaching oversold territory. An RSI below 30 is typically considered oversold, suggesting potential for a reversal or a buying opportunity, but it's important to consider other factors and conduct further analysis before making investment decisions.

Analysis for Tata Steel - April 04, 2025

Tata Steel experienced a significant decline, with the stock price closing at 140.39, down from the previous close of 153.62, representing an 8.61% decrease. The stock traded with a high volume of 80,810,260 shares, and its RSI of 35.44 suggests it is approaching oversold conditions. Despite the drop, the 50-day and 200-day EMAs remain close, indicating potential future support at current levels.

Relationship with Key Moving Averages
Based on the data, Tata Steel's current stock price is below both its 50-day EMA (145.86) and 200-day EMA (145.59), indicating a bearish trend when compared to these key moving averages. Additionally, the 10-day EMA (151.81) and 20-day EMA (150.87) are above the closing price, reinforcing a recent downward momentum.
Moving Averages Trend (MACD)
Tata Steel's MACD is currently at 2.32, below the MACD Signal line of 4.05, indicating a bearish trend. The negative divergence suggests that the stock might continue to face downward pressure in the near term.

RSI Analysis
The RSI (Relative Strength Index) for Tata Steel is at 35.44, indicating that the stock is approaching oversold territory. An RSI below 30 is generally considered oversold, suggesting potential for a price rebound if other conditions are favorable.

Up Next

NSE Nifty 50: Top 5 stock losers of April 4, 2025

Global stock market indices: How the world markets performed today - 25 April 2025

Indian stock market sector-wise performance today - April 25 2025

Top 5 Nifty 50 gainers today – April 25, 2025: Biggest stock moves

NSE Nifty 50: Top 5 stock losers of April 25, 2025

Global stock market indices: How the world markets performed today - 24 April 2025

More videos

Indian stock market sector-wise performance today - April 24 2025

Top 5 Nifty 50 gainers today – April 24, 2025: Biggest stock moves
NSE Nifty 50: Top 5 stock losers of April 24, 2025

Global stock market indices: How the world markets performed today - 23 April 2025

Indian stock market sector-wise performance today - April 23, 2025
Top 5 Nifty 50 gainers today – April 23, 2025: Biggest stock moves

NSE Nifty 50: Top 5 stock losers of April 23, 2025

Sensex, Nifty rise for 6th day on foreign fund inflows, buying in banking shares

Global stock market indices: How the world markets performed today - 22 April 2025

Indian stock market sector-wise performance today - April 22, 2025
Editorji Technologies Pvt. Ltd. © 2022 All Rights Reserved.