In this article, we will explore the technical indicators of some of the low-performing stocks on the Indian stock market, including BHARTIARTL, EICHERMOT, KOTAKBANK, SUNPHARMA, and TATAMOTORS.
By looking at these stocks through the lens of key technical factors, we aim to better understand their price movements, trends, and potential future performance.

Analysis for Bharti Airtel - March 27, 2025

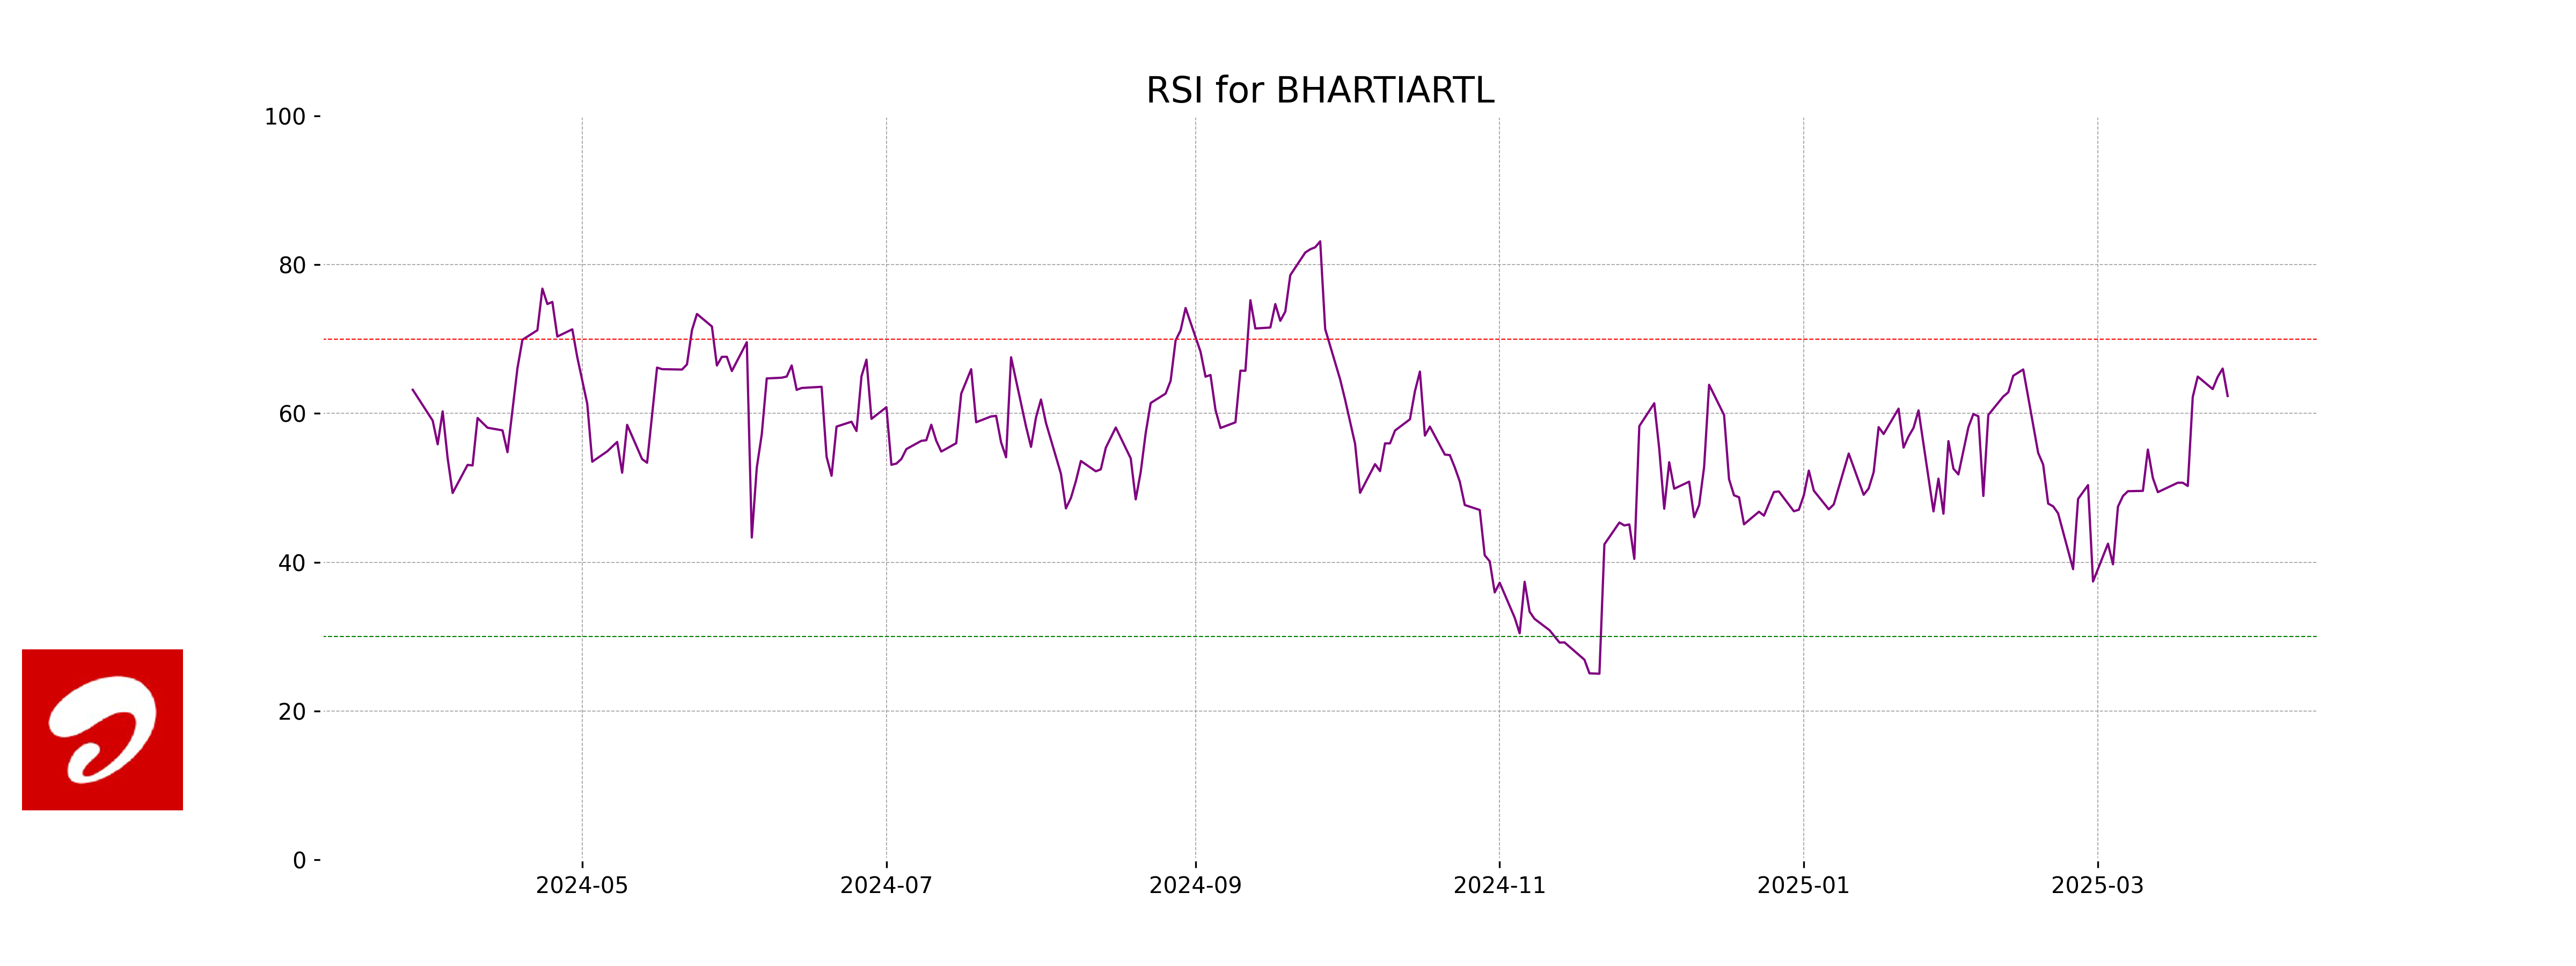
Bharti Airtel reported a modest decline in its stock performance, with a close at 1724.70, down by 0.80% or 13.85 points from the previous day. Despite this short-term dip, its technical indicators, including an RSI of 62.34, suggest relatively strong momentum, supported by a MACD of 23.58, well above the signal line. Operating in the Telecom Services sector within India, the company maintains a robust market capitalization of 10.33 trillion INR and a PE ratio of 41.86.

Relationship with Key Moving Averages
Bharti Airtel's current close price of 1724.70 is above its 50-day EMA of 1652.56 and its 200-day EMA of 1549.82, indicating an overall bullish trend. Additionally, the close is below the 10-day EMA of 1698.87 and the 20-day EMA of 1676.11, suggesting short-term bearishness against its recent upward movement.
Moving Averages Trend (MACD)
Bharti Airtel's MACD of 23.58 is above the MACD Signal of 12.67, which typically indicates a bullish trend, suggesting potential upward momentum. The positive MACD difference aligns with the RSI of 62.34, reinforcing the stock's current positive momentum within the Communication Services sector in India.

RSI Analysis
Based on the RSI value of 62.34 for Bharti Airtel, the stock is approaching the overbought zone but is currently in the neutral range. This suggests that while there might be upward price momentum, it has not yet reached extreme levels where caution is typically advised.

Analysis for Eicher Motors - March 27, 2025

Eicher Motors opened at 5329.45, reached a high of 5405.0, and closed at 5345.75, showing a percentage change of -1.07%. The stock's RSI is at 62.68, indicating a moderately strong momentum. It has a significant market cap of approximately 1.47 trillion INR, with a PE ratio of 33.09, and operates in the Consumer Cyclical sector, specifically in Auto Manufacturers, based in India.

Relationship with Key Moving Averages
The closing price of Eicher Motors is above its 50-day EMA and 200-day EMA, indicating a bullish trend over the medium to long term. However, the price is higher than the 10-day and 20-day EMAs, suggesting possible consolidation or short-term upward momentum.
Moving Averages Trend (MACD)
MACD Analysis for Eicher Motors: The MACD for Eicher Motors is 99.53, with a signal line at 55.80. This indicates a positive momentum, as the MACD is above the signal line, suggesting a potential bullish trend continuation.

RSI Analysis
RSI Analysis for Eicher Motors: The RSI value of 62.68 indicates that the stock is neither overbought nor oversold and is in a neutral or slightly bullish zone. This suggests that the stock has some upward momentum, but there is still room for further gains before reaching overbought levels.

Analysis for Kotak Mahindra Bank - March 27, 2025

Kotak Mahindra Bank's recent performance shows a slight decline, with the stock closing at 2128.65, a decrease of 0.76% from the previous close. Despite the downturn, the bank maintains a strong market position with a market cap of approximately 4,232 billion INR, and its RSI indicates a slightly overbought condition at 69.67. The bank, operating within the financial services sector, particularly in regional banking in India, maintains a healthy EPS of 111.96 and a PE ratio of 19.01.

Relationship with Key Moving Averages
For Kotak Mahindra Bank, the close price of 2128.65 is above its 50-day and 200-day EMAs, indicating a bullish trend in the medium to long term. However, the close price is below its 10-day EMA, suggesting a short-term bearish sentiment. Overall, the stock is trading with strong upward momentum relative to its longer-term moving averages.
Moving Averages Trend (MACD)
Kotak Mahindra Bank's MACD is currently 57.62, which is above the signal line at 40.33. This suggests that the stock is in a bullish momentum phase, indicating potential upward movement in its price.

RSI Analysis
The current RSI for Kotak Mahindra Bank is 69.67, which indicates that the stock is approaching an overbought condition. Typically, an RSI above 70 suggests that the stock may be overvalued and could be poised for a price correction.

Analysis for SUN Pharma - March 27, 2025

SUN Pharma Performance: SUN Pharma, operating within the healthcare sector in India, experienced a price decline with a closing price of 1731.45, marking a drop of 1.56% from the previous close. Despite this, the stock's relative strength with an RSI of 55.27 suggests moderate momentum. SUN Pharma's market capitalization stands robustly at 4,154.32 billion INR, indicating its significant presence in the drug manufacturing industry.

Relationship with Key Moving Averages
SUN Pharma's current closing price of 1731.45 is slightly above its 50-day EMA of 1714.16, indicating short-term bullish momentum, and above its 200-day EMA of 1695.71, suggesting a longer-term bullish trend. However, it is just below the 10-day EMA of 1733.62, indicating some near-term consolidation.
Moving Averages Trend (MACD)
Sun Pharma's MACD is 20.83, which is above its MACD Signal of 7.89, indicating a bullish trend. This suggests potential upward momentum in the stock.

RSI Analysis
Sun Pharma's RSI (Relative Strength Index) is 55.27, indicating a neutral market position. This value suggests that the stock is neither overbought nor oversold, allowing for potential upward or downward movements. However, it is closer to the upper range, which might point towards a slightly bullish outlook if the trend continues.

Analysis for Tata Motors - March 27, 2025

Performance of Tata Motors: Tata Motors' recent performance shows a close price of 668.55, a decline from the previous close of 708.25, indicating a percentage change of -5.61%. The stock experienced a trading volume of over 34 million shares. The RSI indicates a neutral momentum at 46.06, while the MACD suggests a possible positive trend. Notably, the company holds a significant market cap of approximately INR 2,461 billion, with a PE ratio of 7.72 and an EPS of 86.62 in the Consumer Cyclical sector.

Relationship with Key Moving Averages
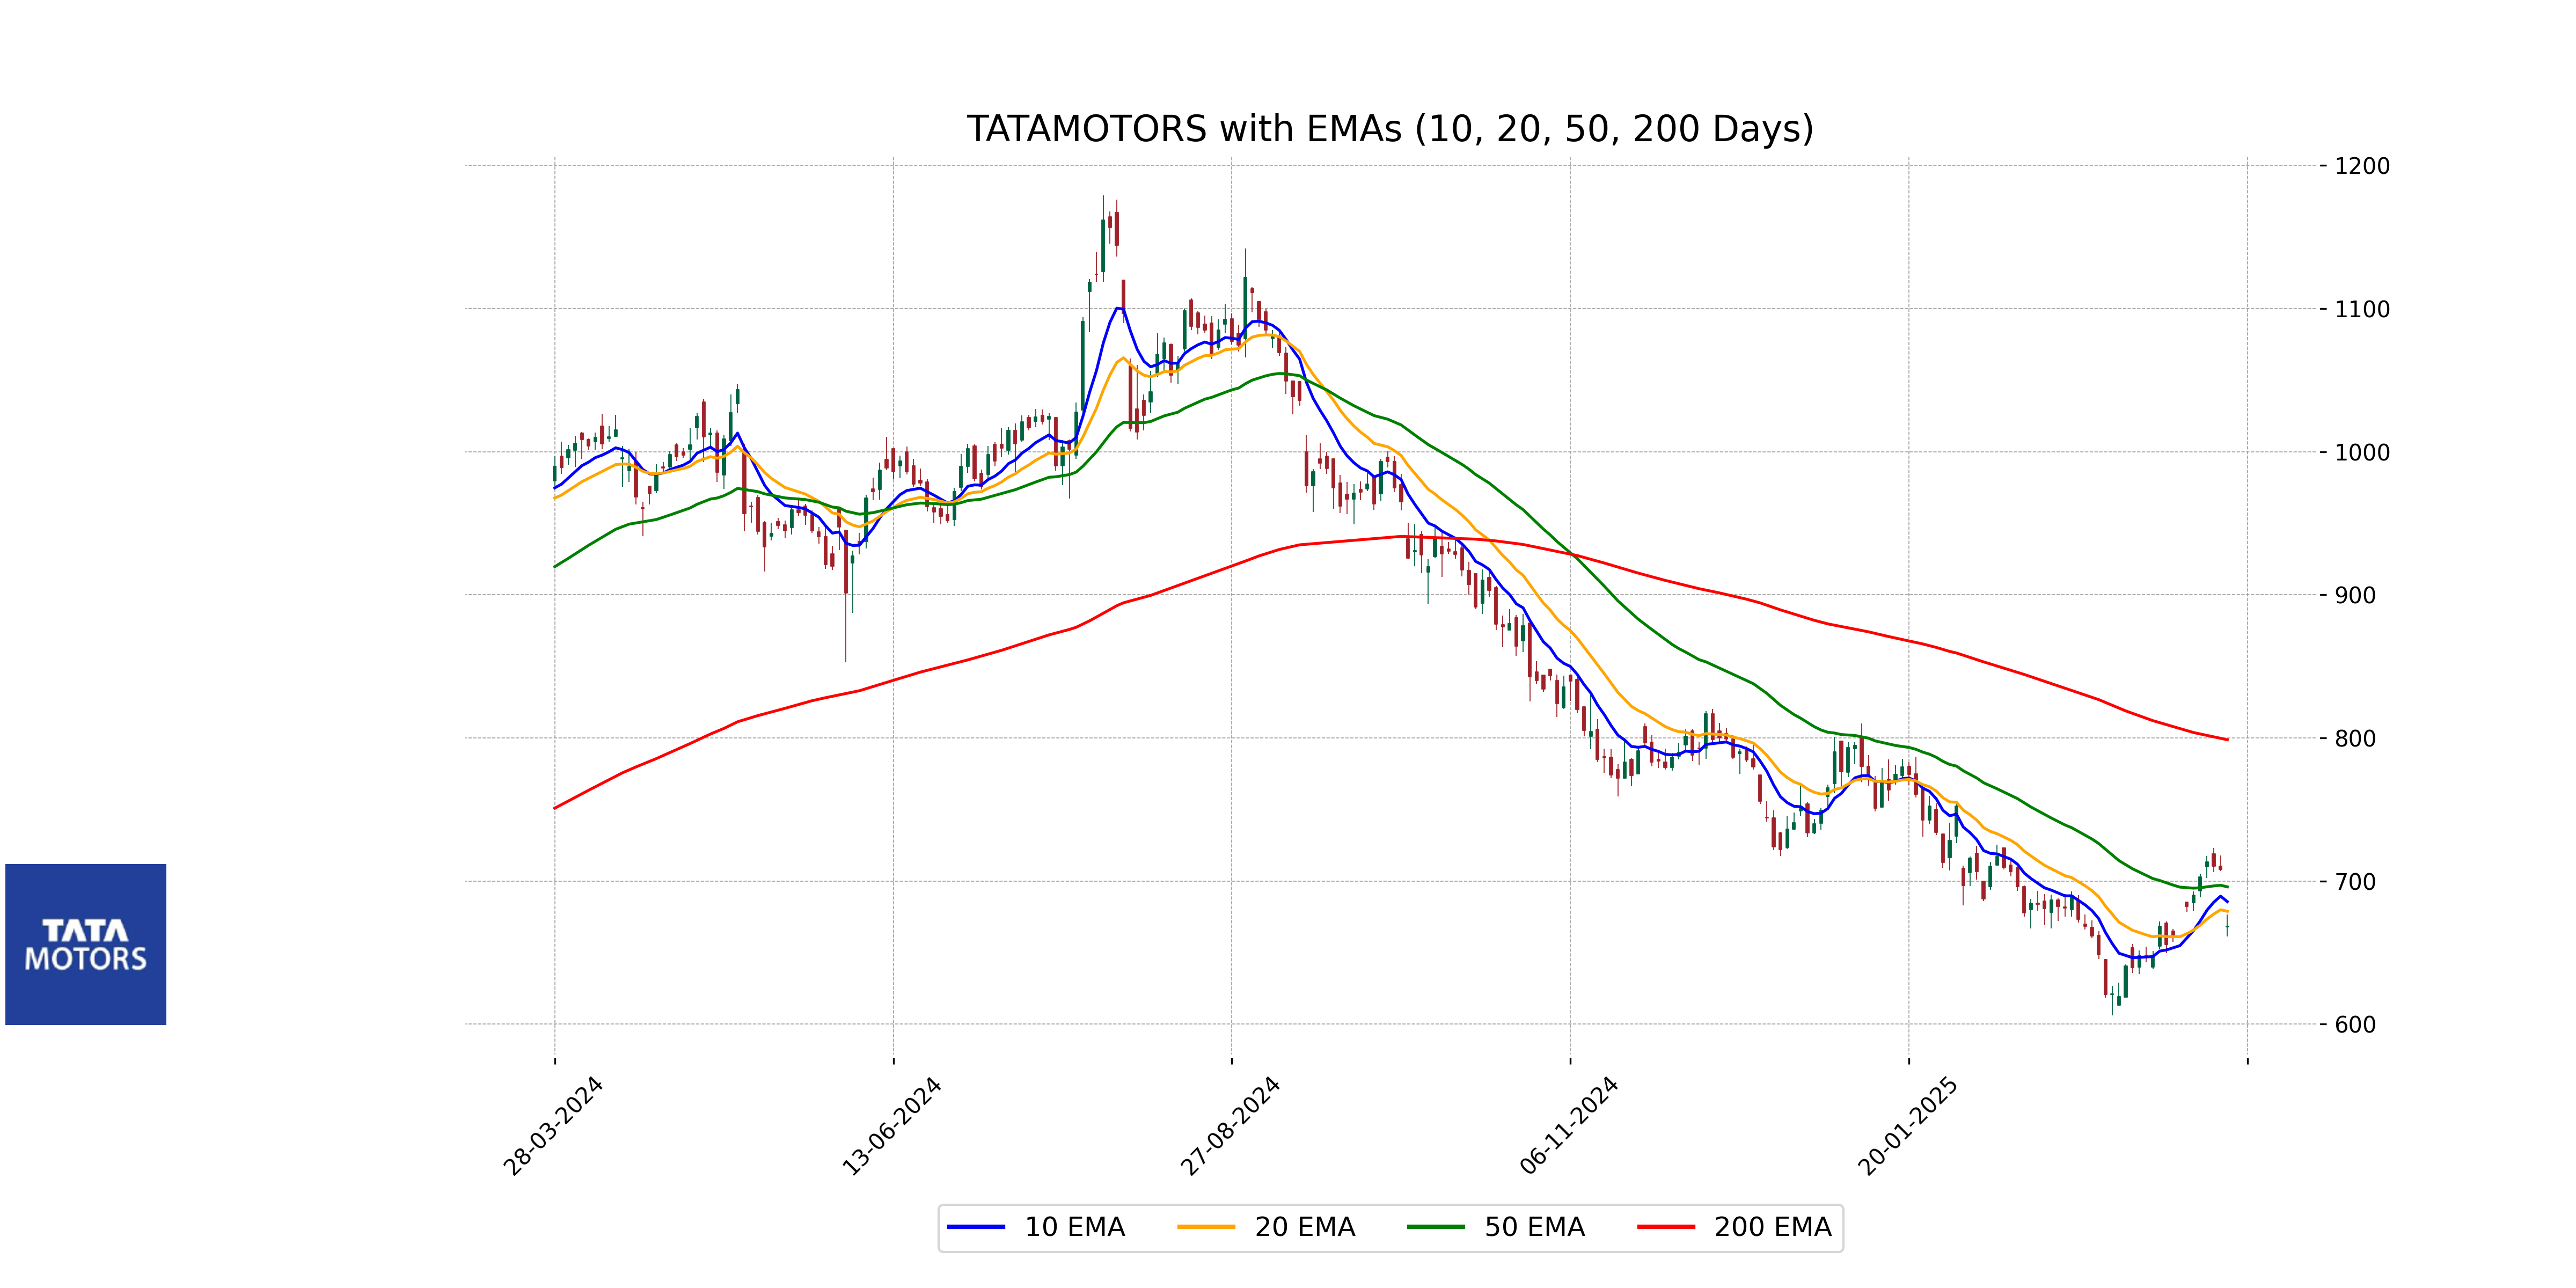
Tata Motors experienced a price close of 668.55, which is below its 50-day EMA of 695.96 and also below the 20-day EMA of 678.88. However, the close is slightly below the 10-day EMA of 685.65, indicating short-term bearish momentum relative to these key moving averages.
Moving Averages Trend (MACD)
The MACD for Tata Motors is 3.694998591452645, which is above the MACD Signal of -2.60158966937123. This suggests a potential bullish momentum, as the MACD line is above the signal line, indicating potential buying pressure.

RSI Analysis
The current RSI for Tata Motors is 46.06, which suggests that the stock is neither overbought nor oversold. An RSI value between 30 and 70 typically indicates a neutral market condition.


