


Highlights
- Sensex saw a modest gain with a 0.46% increase
- Nifty IT registered the smallest change at only 0.04%
- Nifty Metal showed notable growth with a 0.77% rise
Latest news

Global stock market indices: How the world markets performed today - 20 March 2025

Indian stock market sector-wise performance today - March 20, 2025

Top 5 Nifty 50 gainers today – March 20, 2025: Biggest stock moves

NSE Nifty 50: Top 5 stock losers of March 20, 2025

Nothing Phone 3a Pro Review: Flashy & Competent
")
Realme P3 Ultra Review: A real contender! (iQOO Neo 10R Compared)

Tesla service center attacked with Molotovs and gunfire

Esha Deol discusses single parenthood challenges post split
Indian stock market sector-wise performance today - March 17, 2025


The stock market on Monday (March 17, 2025) experienced a mixed day with varying performances across different indices.
Notably, the BSE Sensex recorded a marginal increase, closing higher by 0.46%. This positive movement was mirrored by the Nifty Auto index, which saw a rise of 0.91%, indicating some strength in the automotive sector.
The Nifty Energy index also made gains, appreciating by 0.56%. This increase suggests a modest resurgence in energy stocks, which could be attributed to fluctuating oil prices or sector-specific developments.
In contrast, the Nifty FMCG index dipped slightly by 0.20%, reflecting some weaknesses in the fast-moving consumer goods sector. On the other hand, the Nifty Infra experienced a modest gain of 0.13%, suggesting stability within the infrastructure sector.
The Nifty IT index saw a negligible rise of just 0.04%, indicating a relatively stagnant performance in the information technology sector. Meanwhile, the Nifty Metal index experienced a significant positive change, appreciating by 0.77%.
This suggests increased investor interest or positive news influencing metal stocks. The NSE Bank also saw a healthy gain of 0.61%, indicating strength within the banking sector, potentially due to favorable economic indicators or policy announcements.
In broader market movements, the Nifty 50 index increased by 0.50%, highlighting a day of overall positive sentiment in the market. The Nifty Metal's notable performance, with a gain of 0.77%, can be linked to strong demand for metals globally, possibly driven by rising industrial activity or infrastructure developments.
This sector's positive change reflects investor confidence in the growth prospects for metals.
Overall, the day's market movements suggest optimism in several sectors, particularly in banking and metals, while the FMCG sector saw a slight pullback. Market participants could be responding to various economic indicators, sector-specific news, or broader global economic trends influencing investor behavior.

Analysis for Sensex - March 17, 2025

Sensex Performance Summary: On the given trading day, Sensex opened at 73,830.03 and closed higher at 74,169.95, marking a gain of 341.05 points or 0.46%. The trading range was between a low of 73,796.06 and a high of 74,376.35, with an RSI of 40.84 indicating potential bearish tendencies. The market showcased modest recovery compared to the previous close but remains below its 50-day and 200-day exponential moving averages, suggesting prevailing bearish trends.

Relationship with Key Moving Averages
The Sensex closed at 74169.95, which is above its 10-day EMA of 74127.55 but below the 50-day EMA of 75950.45 and the 20-day EMA of 74598.91. This suggests a short-term strength above the 10-day EMA but indicates a weaker position against the longer-term 50-day and 20-day EMAs.
Moving Averages Trend (MACD)
The current MACD value for Sensex is -696.43, which is above the MACD Signal line at -784.00. This suggests that the Sensex is experiencing a bullish momentum in the short term, but the negative MACD indicates overall bearish conditions in the longer term. Keep an eye on these values to gauge potential trend reversals.

RSI Analysis
The RSI (Relative Strength Index) for Sensex is 40.84, which is below the neutral level of 50. This suggests that the index is currently in a weaker phase and approaching the oversold region, indicating potential bearish sentiment.

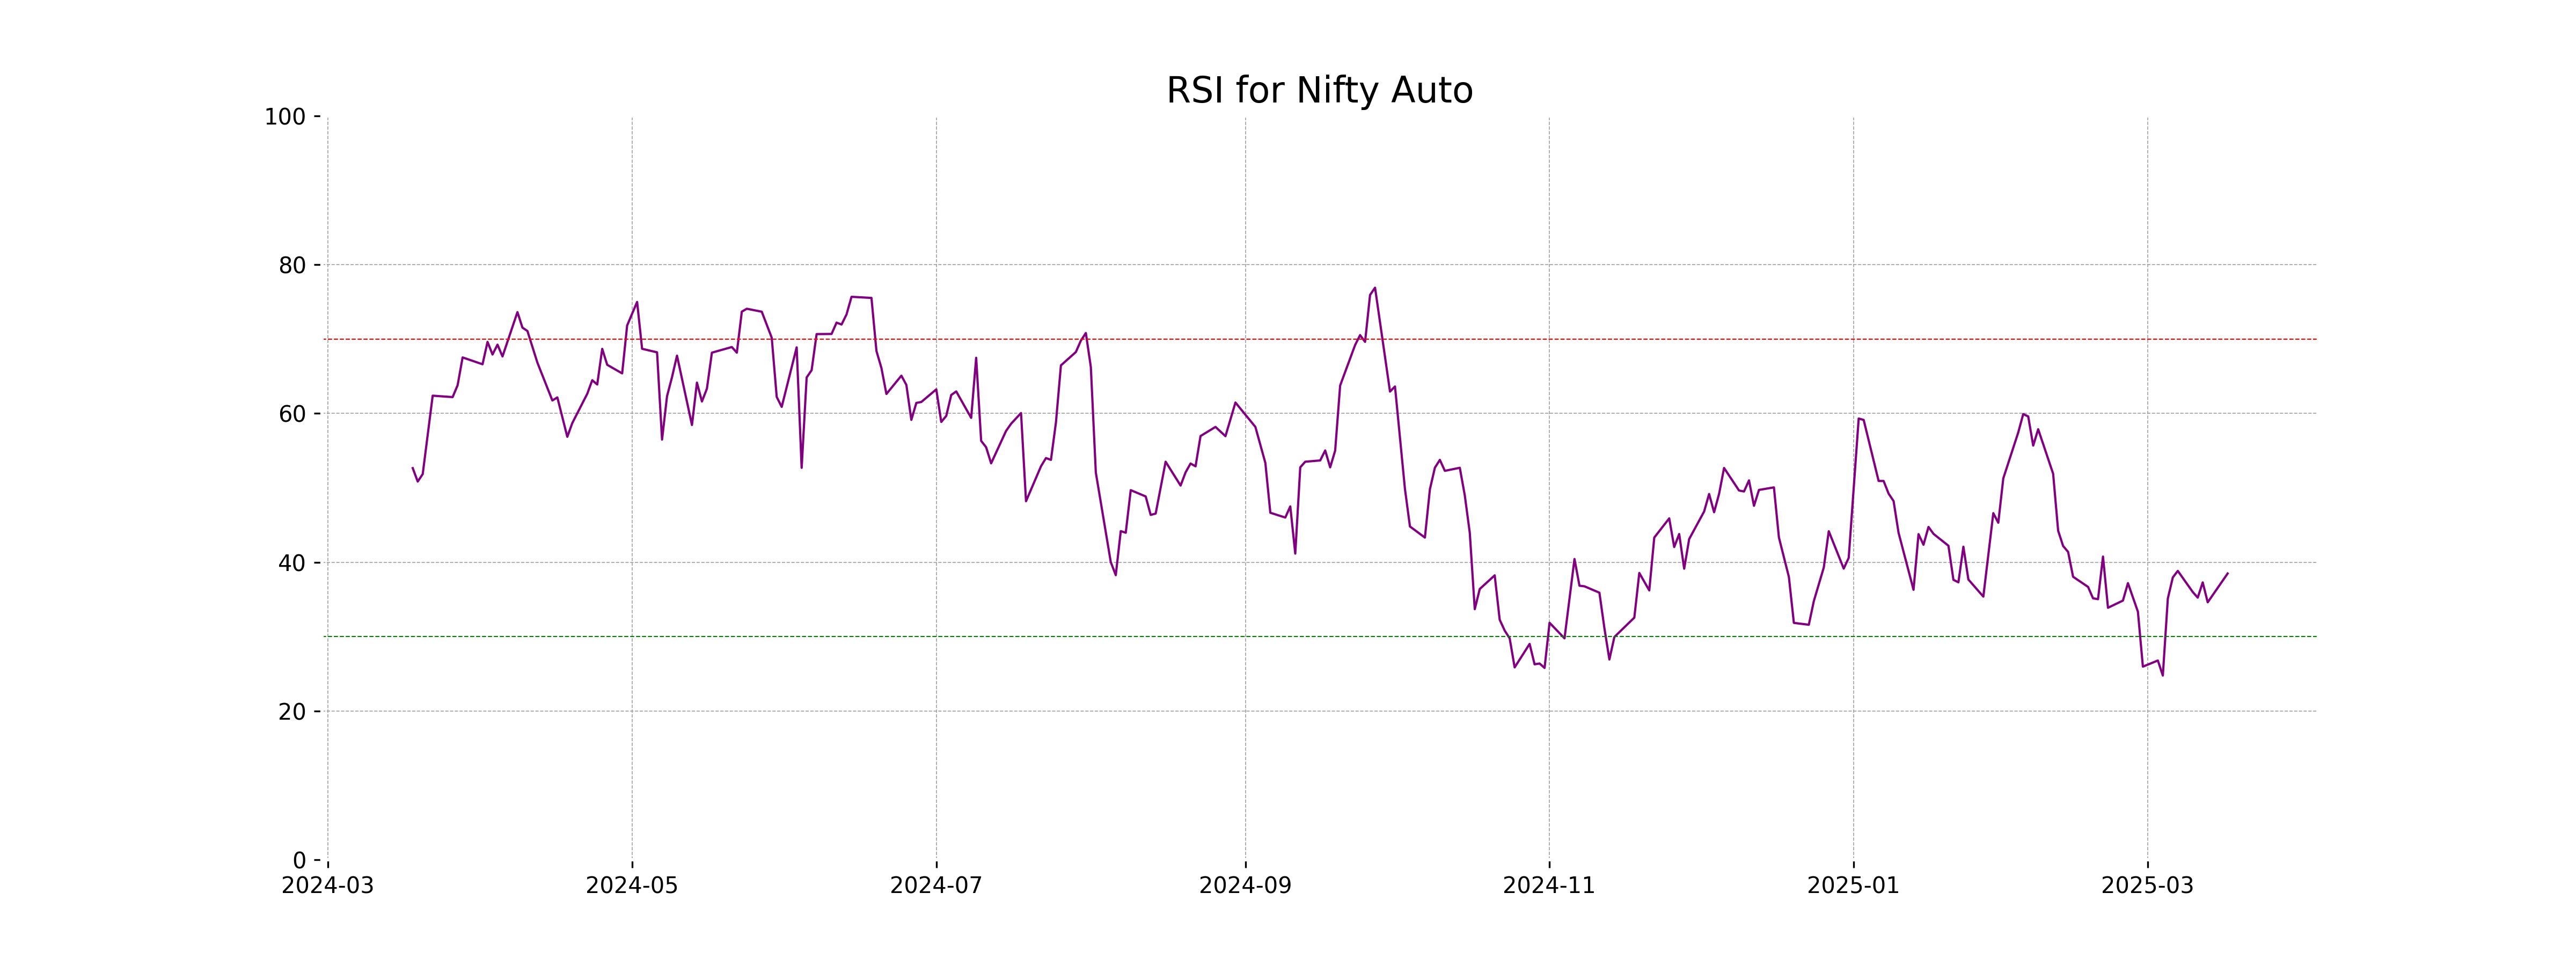
Analysis for Nifty Auto - March 17, 2025
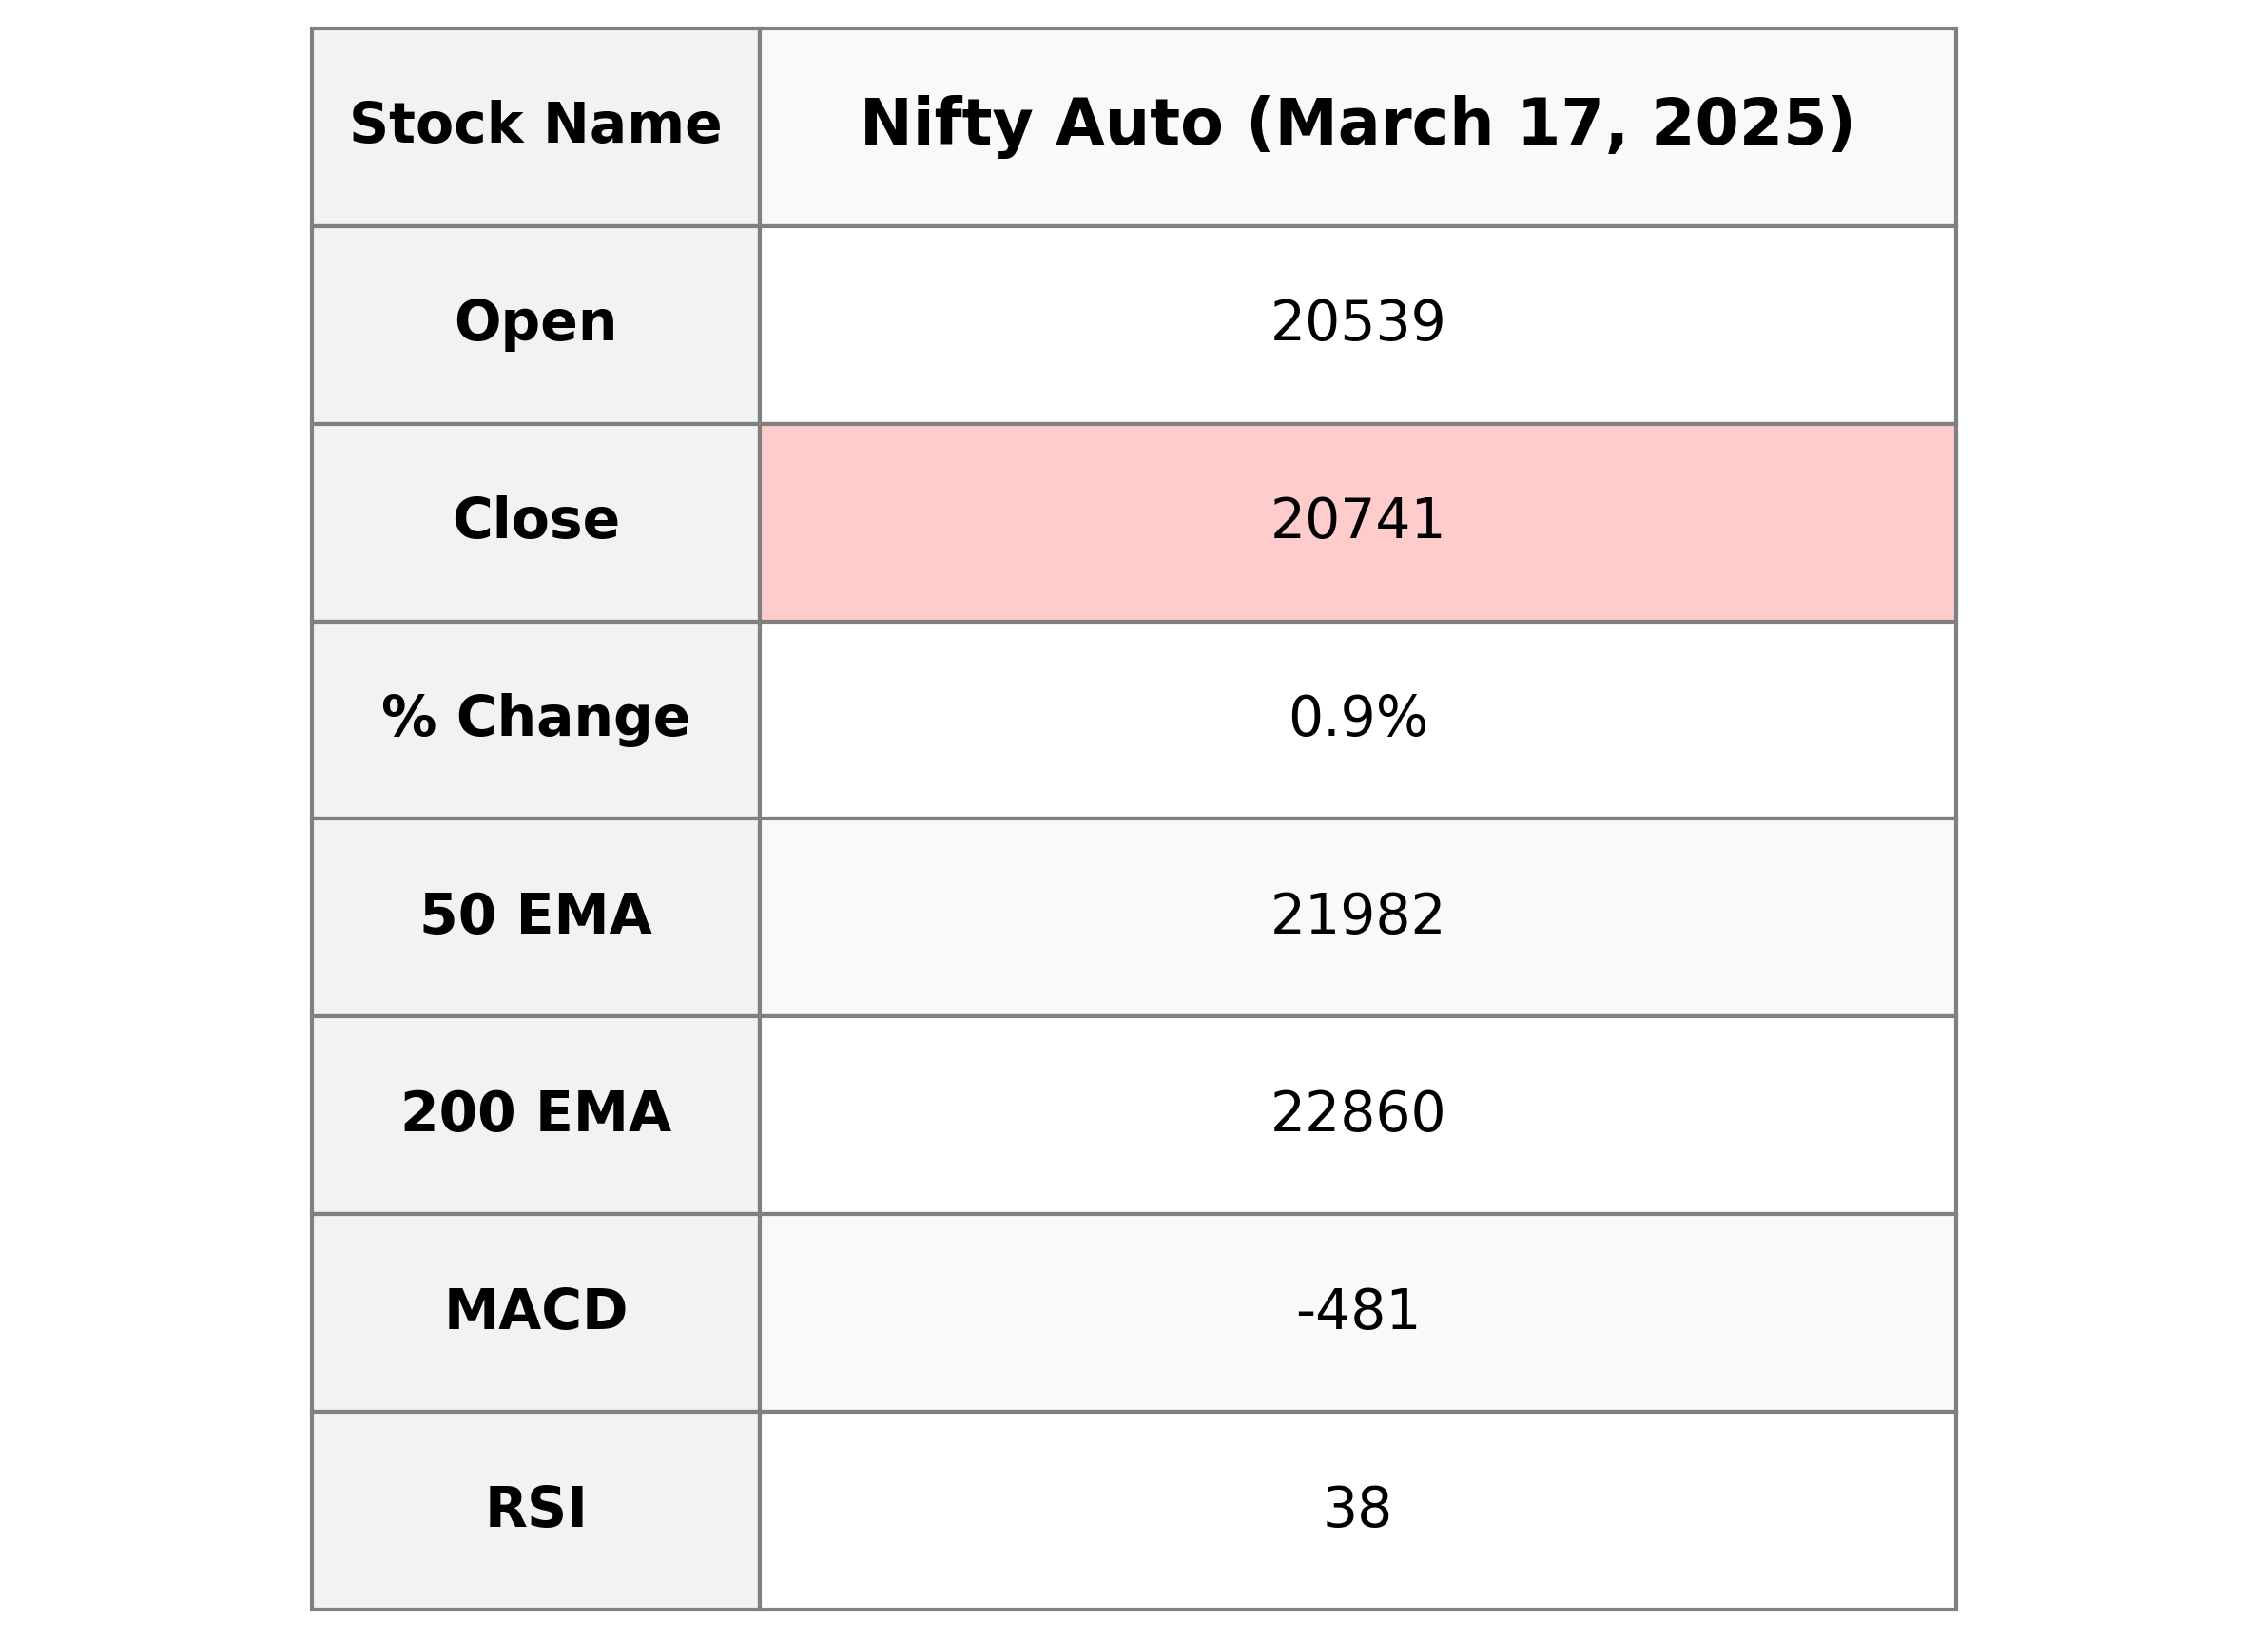
Nifty Auto opened at 20,539, with a high of 20,926.35 and a low of 20,538.05, closing at 20,741.15. It showed a positive movement with a percentage change of 0.91% and a points change of 187.10 from the previous close of 20,554.05. The index's RSI is at 38.48, indicating approaching oversold conditions, while the MACD shows a negative trend at -481.33.

Relationship with Key Moving Averages
The current close price of Nifty Auto at 20,741.15 is below the 50 EMA of 21,981.57 and the 200 EMA of 22,859.53, indicating a bearish trend. However, it is just slightly below the 10 EMA of 20,837.58 and the 20 EMA of 21,191.68, suggesting possible short-term resistance.
Moving Averages Trend (MACD)
The MACD for Nifty Auto at -481.33, along with the MACD Signal at -493.01, indicates a weak bearish momentum as the MACD line is above the signal line. With a low RSI of 38.48, the index might be nearing an oversold condition, suggesting a potential for a reversal if the trend changes.

RSI Analysis
The RSI for Nifty Auto is at 38.48, indicating that the stock is approaching the oversold territory. This suggests that the stock has experienced recent selling pressure and could be undervalued, potentially signaling a buying opportunity if other indicators align.
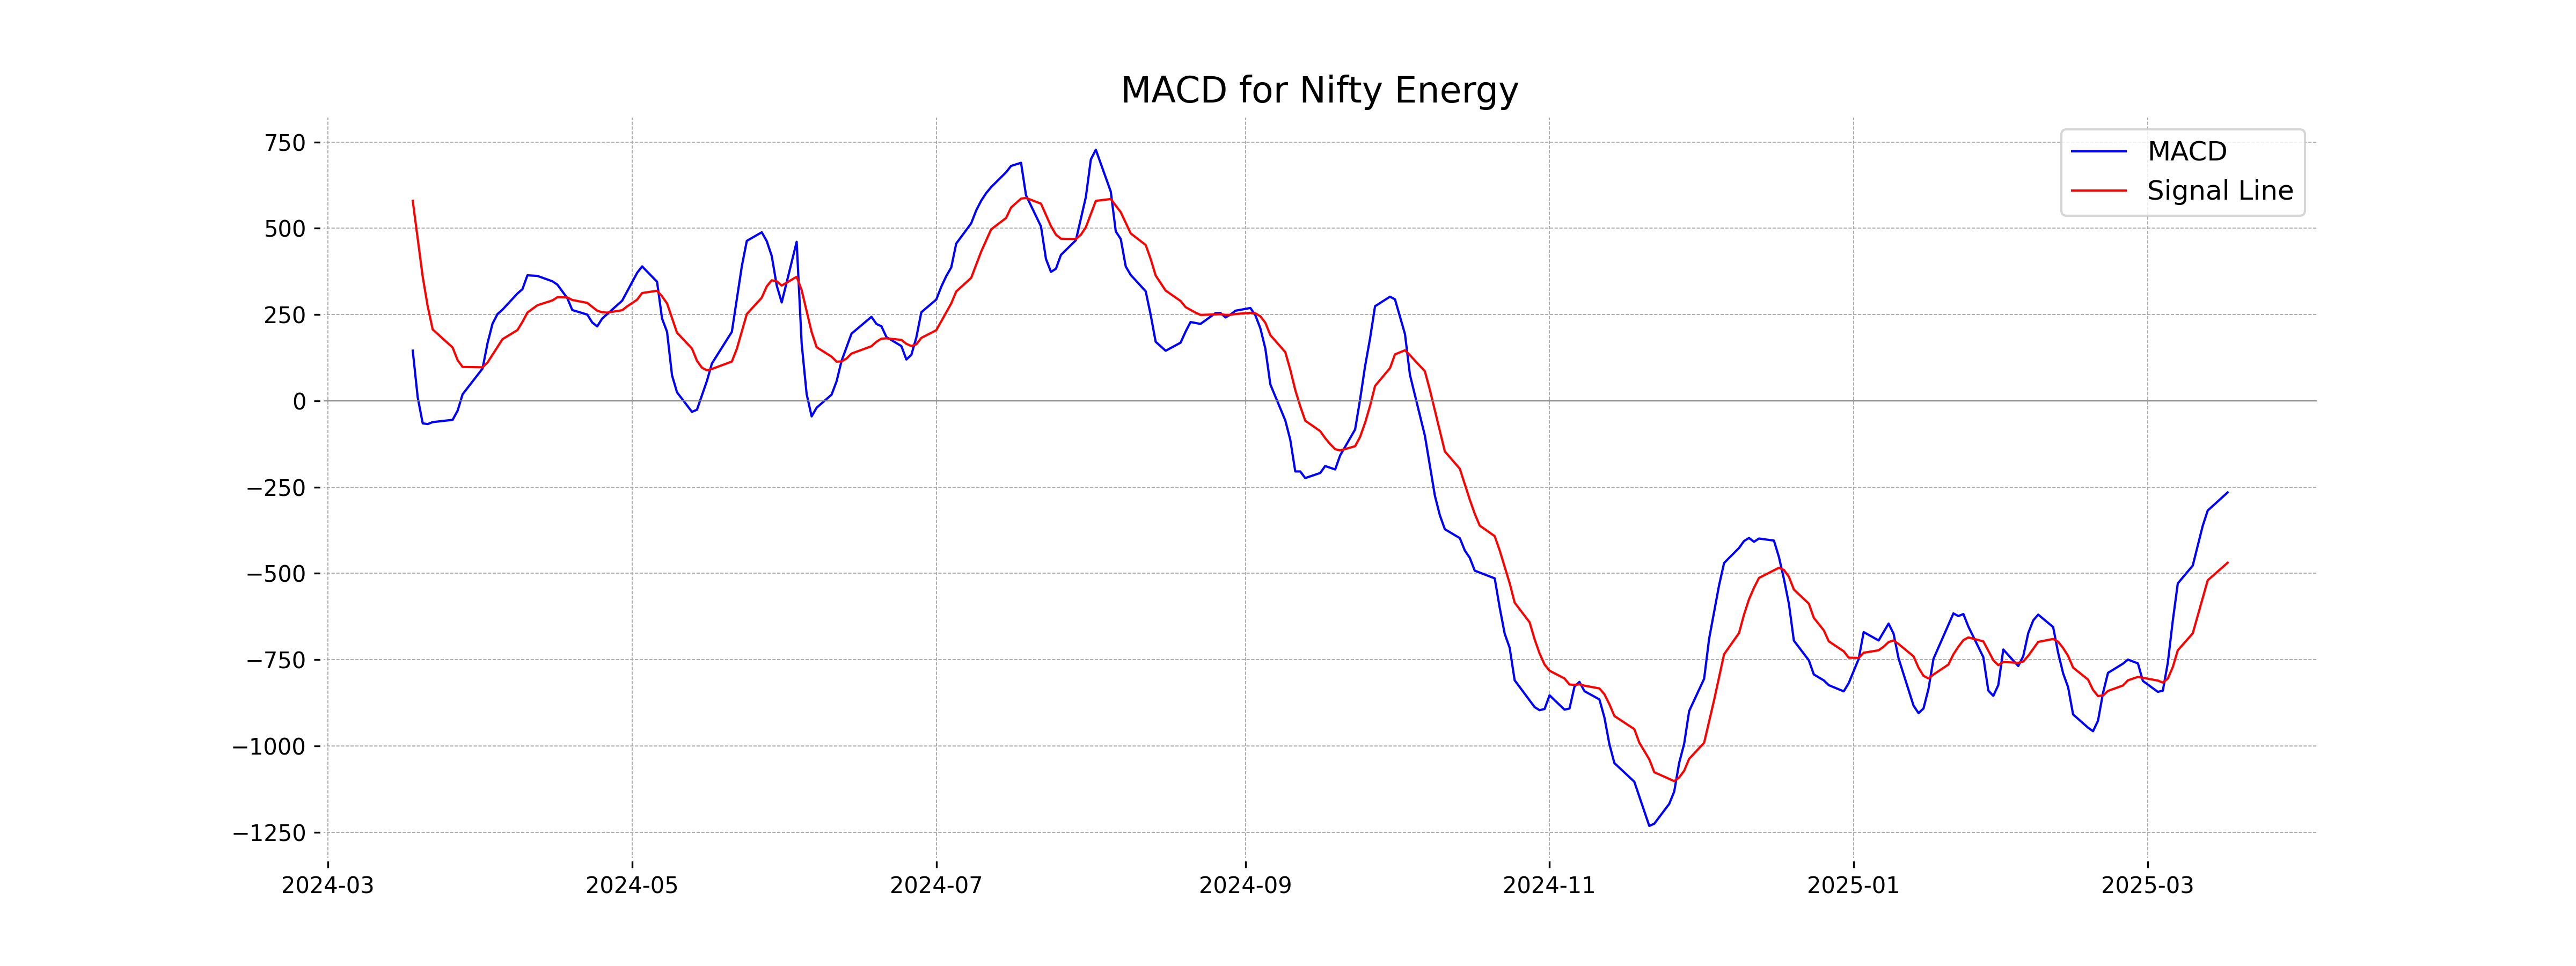
Analysis for Nifty Energy - March 17, 2025

Nifty Energy opened at 31,560.60 and closed slightly higher at 31,660.15, marking a 0.56% increase with a 177.15-point change from the previous close of 31,483. The technical indicators show a mixed scenario with RSI at a neutral 50.08, while the MACD indicator reflects bearish momentum.

Relationship with Key Moving Averages
Nifty Energy is currently trading below its key moving averages, with the close price (31,660.15) below the 50 EMA (32,617.27) and 200 EMA (36,133.88), but above the 10 EMA (31,372.24) and 20 EMA (31,444.89). This indicates a short-term upward movement against a longer-term bearish trend.
Moving Averages Trend (MACD)
MACD Analysis for Nifty Energy: The MACD value of -265.39 indicates a bearish trend since it is below the MACD Signal line of -469.12. This suggests that the momentum may be shifting and could potentially indicate a buying opportunity as the MACD is moving towards the signal line.
RSI Analysis
RSI Analysis for Nifty Energy: The Relative Strength Index (RSI) for Nifty Energy is 50.08, indicating a neutral momentum. This suggests that the index is neither overbought nor oversold, showing a balanced market condition.

Analysis for Nifty FMCG - March 17, 2025

Nifty FMCG closed at 51773.15, slightly down from its previous close of 51879.25, showing a percentage change of -0.20% and a points change of -106.10. The RSI value of 37.97 suggests that the index is nearing the oversold territory. The MACD value of -733.11 compared to the MACD Signal of -912.92 indicates a potential positive convergence.

Relationship with Key Moving Averages
The Nifty FMCG closed at 51,773.15, which is below its 10 EMA (51,845.79), 20 EMA (52,294.07), 50 EMA (53,870.83), and 200 EMA (56,550.97). This indicates a short to long-term bearish trend, as the current price is trading below all key moving averages.
Moving Averages Trend (MACD)
Nifty FMCG MACD Analysis: The MACD value for Nifty FMCG is -733.11, indicating a bearish momentum as it is below the signal line of -912.92. This situation usually suggests that the market may continue its downward trend based on recent momentum indicators.

RSI Analysis
RSI Analysis for Nifty FMCG: The RSI (Relative Strength Index) for Nifty FMCG is 37.97, suggesting that the index is approaching the oversold territory. This indicates that the index may be experiencing a downward momentum but has potential for a trend reversal if the RSI moves closer to or below 30.

Analysis for Nifty Infra - March 17, 2025

Nifty Infra opened at 7923.75 and closed marginally higher at 7950.05, showing a positive change of 0.13% or 10.30 points. The Relative Strength Index (RSI) is at 47.46, indicating a neutral momentum. The Moving Average Convergence Divergence (MACD) is -51.37, with a signal value of -80.58, suggesting a bearish trend.

Relationship with Key Moving Averages
The Nifty Infra closed at 7950.05, which is below the 50 EMA of 8123.04 and significantly below the 200 EMA of 8408.05, indicating a bearish trend relative to these longer-term averages. However, it is just above the 10 EMA of 7932.81 but slightly below the 20 EMA of 7954.16, suggesting some short-term consolidation.
Moving Averages Trend (MACD)
The MACD for Nifty Infra is currently at -51.37, with a signal line at -80.58, indicating a bullish crossover. This suggests a potential shift in momentum towards buying, as the MACD line is moving upwards and crossing above the signal line.

RSI Analysis
The current RSI for Nifty Infra is 47.46, which suggests a neutral position as it is neither in the overbought (above 70) nor oversold (below 30) territory. This indicates that the index does not currently demonstrate strong momentum in either direction.

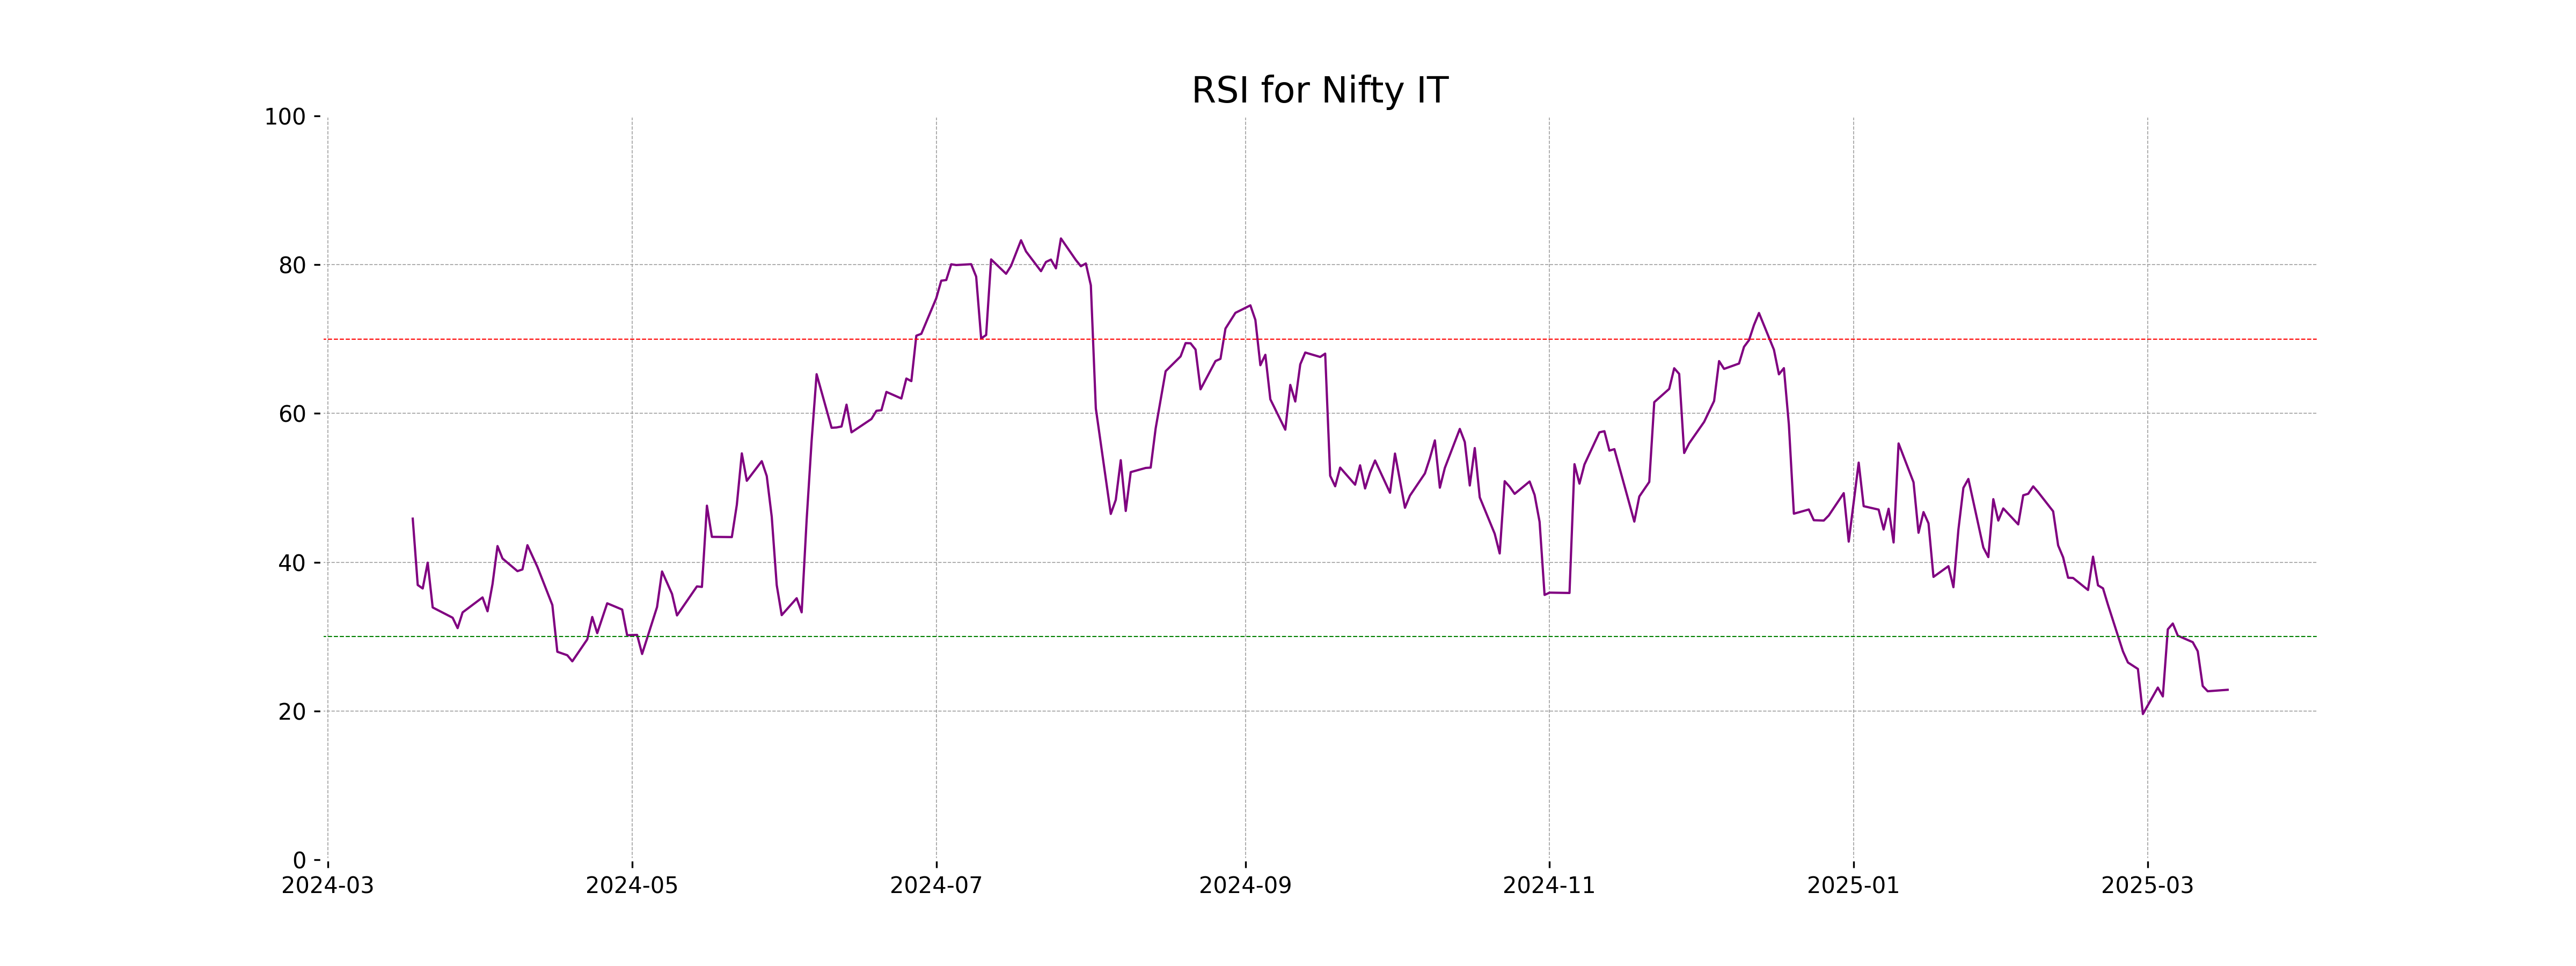
Analysis for Nifty IT - March 17, 2025

Nifty IT Performance Nifty IT opened at 35,828.05 and closed slightly higher at 36,137.20, marking a marginal gain of 0.04% with a points change of 14.70 from the previous close. Despite the gain, technical indicators like the RSI at 22.85 suggest that it may be in oversold territory, while the MACD is negative at -1,448.69, indicating bearish sentiment.

Relationship with Key Moving Averages
The closing price of Nifty IT is 36137.20, which is below the key moving averages of the 10-day EMA (37289.88), 20-day EMA (38441.64), 50-day EMA (40371.30), and 200-day EMA (40344.34). This indicates a bearish trend for Nifty IT, as the price is trading significantly below all key EMA levels.
Moving Averages Trend (MACD)
Nifty IT: The MACD value of -1448.69, which is below the MACD Signal of -1294.54, indicates a bearish momentum in the market. This suggests that the Nifty IT index may be experiencing downward pressure and could continue to face selling interest in the short term.

RSI Analysis
Based on the data provided, the RSI for Nifty IT is 22.85, which indicates that the index is in the oversold territory. This suggests that the stock may be undervalued at the moment, and could potentially be due for a bullish reversal if other indicators also align.
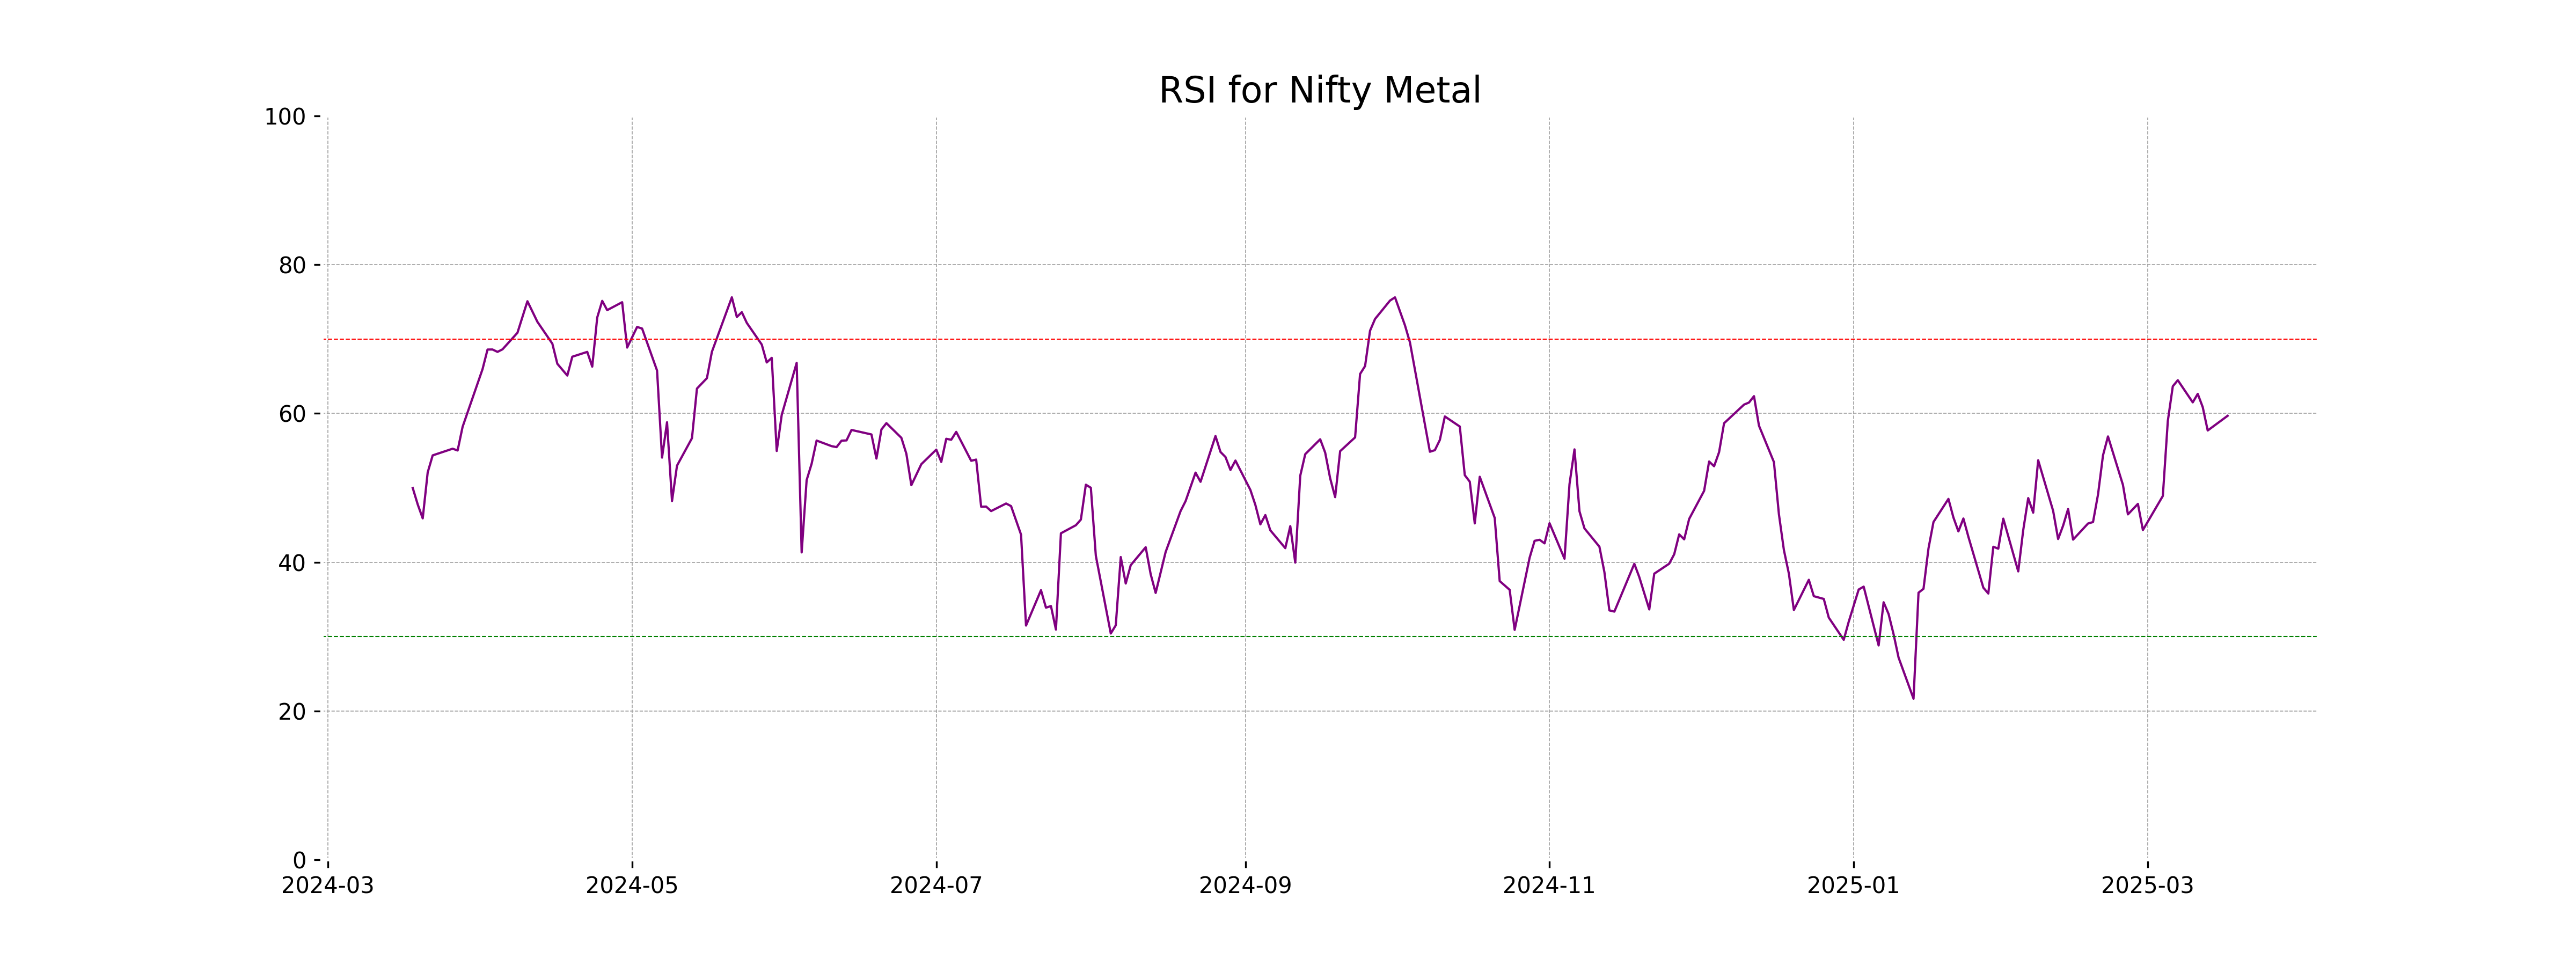
Analysis for Nifty Metal - March 17, 2025

Nifty Metal opened at 8810.2 and closed higher at 8845.25, showing a positive change of 0.77% with a points increase of 67.60. The relative strength index (RSI) stands at 59.69, indicating a mildly bullish sentiment. The MACD value of 121.68, compared to its signal of 76.68, suggests a bullish momentum in the sector.

Relationship with Key Moving Averages
The closing price for Nifty Metal is 8845.25, which is above its 50-day EMA of 8593.31 and slightly above its 200-day EMA of 8789.36, indicating a positive trend in the short to medium term. Additionally, it is also above the 10-day and 20-day EMAs, further reinforcing short-term bullish sentiment.
Moving Averages Trend (MACD)
Nifty Metal: The MACD value of 121.68 is significantly above the MACD Signal line at 76.68, indicating a bullish momentum for Nifty Metal. This typically suggests that the stock may experience continued upward movement and traders might consider this as a buying signal.

RSI Analysis
The RSI of Nifty Metal is 59.69, indicating that the stock is approaching overbought territory but is not quite there yet. Typically, an RSI above 70 would suggest overbought conditions, while an RSI below 30 would indicate oversold conditions. Thus, current levels suggest moderate strength in the stock.
Analysis for Nifty Bank - March 17, 2025

Nifty Bank opened at 48,219.55 and closed at 48,354.15, marking a positive change of 0.61% with an increase of 293.75 points from the previous close. The index showed moderate volatility with a high of 48,481.35 and a low of 48,196.10. Despite the day's gain, the 50-day and 200-day EMAs indicate a bearish trend, supported by an RSI of 44.13 and a negative MACD line.

Relationship with Key Moving Averages
The closing price of Nifty Bank is currently below both its 50-day EMA and 200-day EMA, indicating a potential bearish trend in the short to long term. However, it is above the 10-day EMA but below the 20-day EMA, suggesting some short-term fluctuations in the trend.
Moving Averages Trend (MACD)
Based on the MACD analysis for Nifty Bank, the MACD line at -351.27 is below the signal line at -342.70, indicating a bearish momentum. This suggests that the Nifty Bank index may continue to experience downward pressure in the short term.

RSI Analysis
The RSI value for Nifty Bank is 44.13, indicating that it is below the neutral level of 50. This suggests that the stock may be experiencing weaker momentum, but it is not yet in oversold territory, typically considered below 30. The current RSI suggests caution as it indicates a potential for continued weakness, although not severe enough to signal an immediate reversal.

Analysis for Nifty 50 - March 17, 2025

Nifty 50 Performance: The Nifty 50 index opened at 22,353.15 and closed at 22,508.75, showing a positive change of 0.50% with a gain of 111.55 points from its previous close of 22,397.20. The index faced a day's high of 22,577.00 and remained relatively low on volume activity. The RSI indicator is at 42.91, indicating a slightly bearish momentum, while the MACD suggests the market is currently experiencing a downtrend. The 50-period EMA stands lower than the 200-period EMA, reinforcing a bearish sentiment in the medium term.

Relationship with Key Moving Averages
The Nifty 50 closed at 22,508.75, which is below both its 50-day EMA of 23,001.04 and 200-day EMA of 23,414.55, indicating a potential bearish trend. However, it is above its 10-day EMA of 22,475.15, suggesting short-term bullish momentum. The RSI is at 42.91, which is in the bearish territory.
Moving Averages Trend (MACD)
The MACD for Nifty 50 is currently negative, with the MACD line at -192.80 and the MACD Signal line at -227.26. This suggests a bearish momentum as the MACD line is above the Signal line, indicating a potential for further downside unless a crossover occurs.

RSI Analysis
The Relative Strength Index (RSI) for Nifty 50 is at 42.91. An RSI below 50 suggests that the market might be experiencing weaker momentum or is in a slightly bearish phase. However, it is not yet in the oversold zone, which typically lies below 30.

Up Next
Indian stock market sector-wise performance today - March 17, 2025
Indian stock market sector-wise performance today - March 20, 2025
Top 5 Nifty 50 gainers today – March 20, 2025: Biggest stock moves
NSE Nifty 50: Top 5 stock losers of March 20, 2025

Vodafone Idea explores satellite partnerships amid competitor moves

Global stock market indices: How the world markets performed today - 19 March 2025

More videos

Indian stock market sector-wise performance today - March 19, 2025

Top 5 Nifty 50 gainers today – March 19, 2025: Biggest stock moves

Global stock market indices: How the world markets performed today - 18 March 2025

Indian stock market sector-wise performance today - March 18, 2025

Top 5 Nifty 50 gainers today – March 18, 2025: Biggest stock moves

NSE Nifty 50: Top 5 stock losers of March 18, 2025

Global stock market indices: How the world markets performed today - 17 March 2025

Global stock market indices: How the world markets performed today - 14 March 2025

Indian stock market sector-wise performance today - March 14, 2025

Global stock market indices: How the world markets performed today - 13 March 2025