


Highlights
- Bajaj Finance shows bullish trend despite recent decline
- BPCL and Cipla maintain neutral momentum in market
- Tech Mahindra approaches oversold zone with bearish trend
Latest news

Pahalgam tragedy casts shadow on Indo-Pak cricket

MS Dhoni to play his 400th T20 match as CSK faces SRH

India stands tall amid tragedy: Piyush Goyal

ED raids Congress MLA Vinay Kulkarni's properties

VHP stages protest in Kolkata over Pahalgam attack

Kartarpur corridor stays open amid tensions

Hero and terrorist: The tale of two Adils in Pahalgam

Pahalgam survivor recalls horror, wife prays Shiva
NSE Nifty 50: Top 5 stock losers of March 26, 2025


In this article, we will explore the technical indicators of some of the low-performing stocks on the Indian stock market, including BAJFINANCE, BPCL, CIPLA, NTPC, and TECHM.
By looking at these stocks through the lens of key technical factors, we aim to better understand their price movements, trends, and potential future performance.

Analysis for Bajaj Finance - March 26, 2025

Bajaj Finance: The stock witnessed a decline, closing at 8866.05, down by 2.22% from the previous close. It traded with significant volume at 886,045 shares, and the MACD indicator suggests a mild bullish signal. Despite the drop, the stock maintains a strong Market Cap of ₹5.49 trillion and a healthy PE Ratio of 34.43, reflecting robust financial standing in the Credit Services industry.

Relationship with Key Moving Averages
Bajaj Finance: The stock's current closing price of 8866.05 is above the 50 EMA of 8261.07 and the 200 EMA of 7511.25, indicating a bullish trend over both medium and long-term periods. However, the price is also above the 10 EMA of 8787.23 and 20 EMA of 8636.45, suggesting a short-term positive momentum despite the recent decline.
Moving Averages Trend (MACD)
Bajaj Finance's MACD is 194.42, which is above the MACD Signal of 164.45, indicating a possible bullish trend. With an RSI at 61.44, the stock might be gaining momentum in the market, suggesting an opportunity for potential upward movement, but caution is necessary as it approaches overbought levels.

RSI Analysis
For Bajaj Finance, the RSI is 61.44, indicating a neutral state of momentum. Typically, an RSI above 70 is considered overbought, and below 30 is considered oversold. At 61.44, Bajaj Finance is neither overbought nor oversold, suggesting a balanced momentum in its stock price.

Analysis for BPCL - March 26, 2025

BPCL displayed a slight decline in performance with a close at 273.01, down by 2.19% from the previous close. Despite this drop, the stock shows resilience with an RSI of 58.20, indicating neutral momentum. The company is a key player in the Energy sector, specifically Oil & Gas Refining & Marketing in India.

Relationship with Key Moving Averages
Bharat Petroleum Corporation Limited (BPCL) is trading below its 200-day EMA of 279.64 but remains above its 50-day EMA of 265.58, indicating mixed strength with a potential for both support and resistance levels. Additionally, BPCL's 10-day EMA of 270.99 and 20-day EMA of 265.91 suggest a short-term uptrend over the past few weeks.
Moving Averages Trend (MACD)
For Bharat Petroleum Corporation Limited, the MACD line is at 5.07 while the MACD Signal line is at 2.87, indicating a potential bullish trend as the MACD line is above the Signal line. This suggests positive momentum in the stock.

RSI Analysis
The Relative Strength Index (RSI) for BPCL is 58.20, which suggests that the stock is in a neutral zone. It indicates neither overbought nor oversold conditions, providing a balanced outlook on stock momentum.

Analysis for Cipla - March 26, 2025

Cipla's stock opened at 1507.0 and closed at 1476.2, marking a decrease of -2.32% from the previous close of 1511.2. The stock experienced a volume of 1,375,475, with the day's high and low being 1512.35 and 1472.3, respectively. With a market cap of approximately 1.19 trillion INR, Cipla operates in the Healthcare sector, specifically within Drug Manufacturers - Specialty & Generic, in India.

Relationship with Key Moving Averages
Cipla's closing price of 1476.20 is slightly above its 50-day EMA of 1471.47, indicating a short-term upward momentum, yet it's close to the 200-day EMA of 1475.28, reflecting a neutral longer-term trend. The stock is currently below its 10-day and 20-day EMAs, suggesting recent bearish movement.
Moving Averages Trend (MACD)
The MACD value for Cipla is 14.078, which is higher than the MACD Signal of 10.003. This indicates a bullish trend as the MACD is above its signal line.

RSI Analysis
The RSI for Cipla is 50.33, indicating a neutral stance as it sits near the midpoint of the typical 30-70 range used to identify overbought or oversold conditions. At this level, the stock doesn't show a strong trend towards being overbought or oversold, suggesting that traders might be in a wait-and-see mode to determine a future direction.

Analysis for NTPC - March 26, 2025
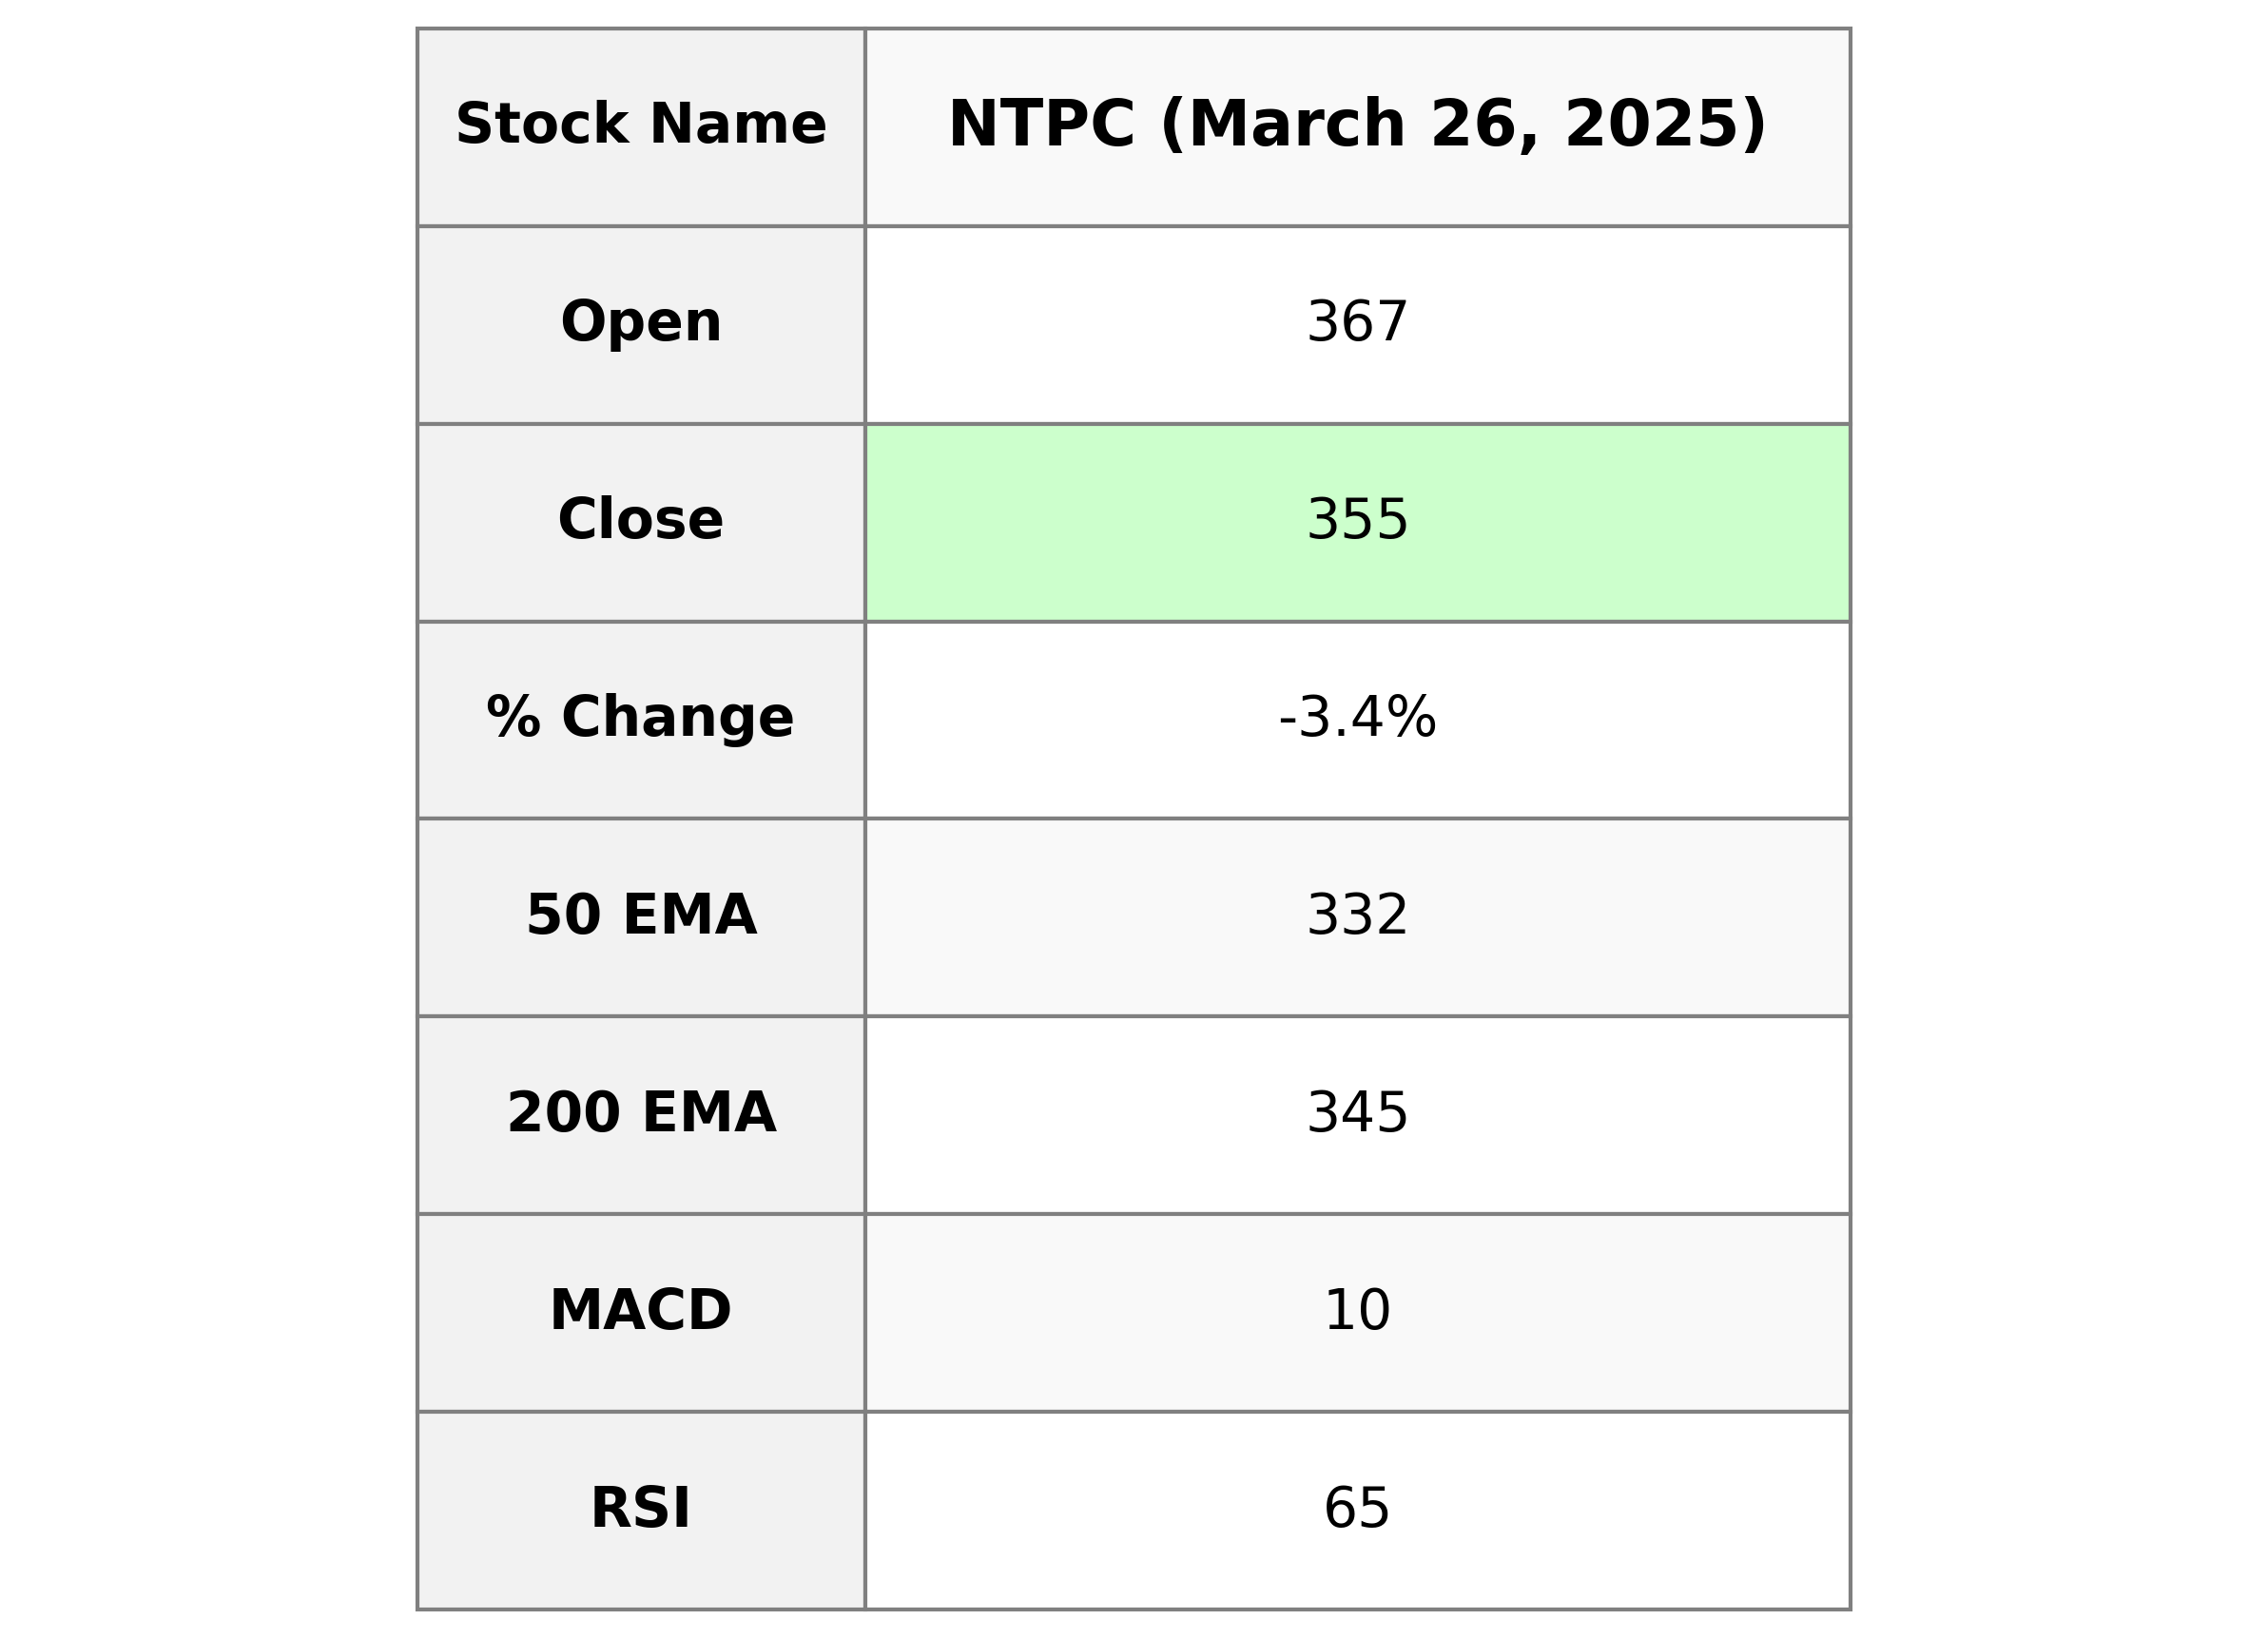
NTPC's Performance: NTPC experienced a decline in its stock price, with a closing value of 354.65 INR, down 3.35% from the previous close. Despite the drop, the company shows resilience with a strong RSI of 64.69, indicating potential future gains. Backed by a solid market cap and steady earnings in the “Utilities - Regulated Electric” industry, it remains a significant player in the utilities sector in India.

Relationship with Key Moving Averages
The current closing price of NTPC is 354.65, which is above the 50 EMA at 332.11 but below the 200 EMA at 344.64. This indicates a potential short-term bullish trend as it is above the shorter-term moving average, while still being below the longer-term moving average.
Moving Averages Trend (MACD)
Based on the given data, NTPC's MACD value is significantly higher than its MACD Signal, indicating strong bullish momentum. The MACD of 10.256 suggests that the stock's short-term momentum is positive, and it could potentially experience further upward movement if the trend continues.

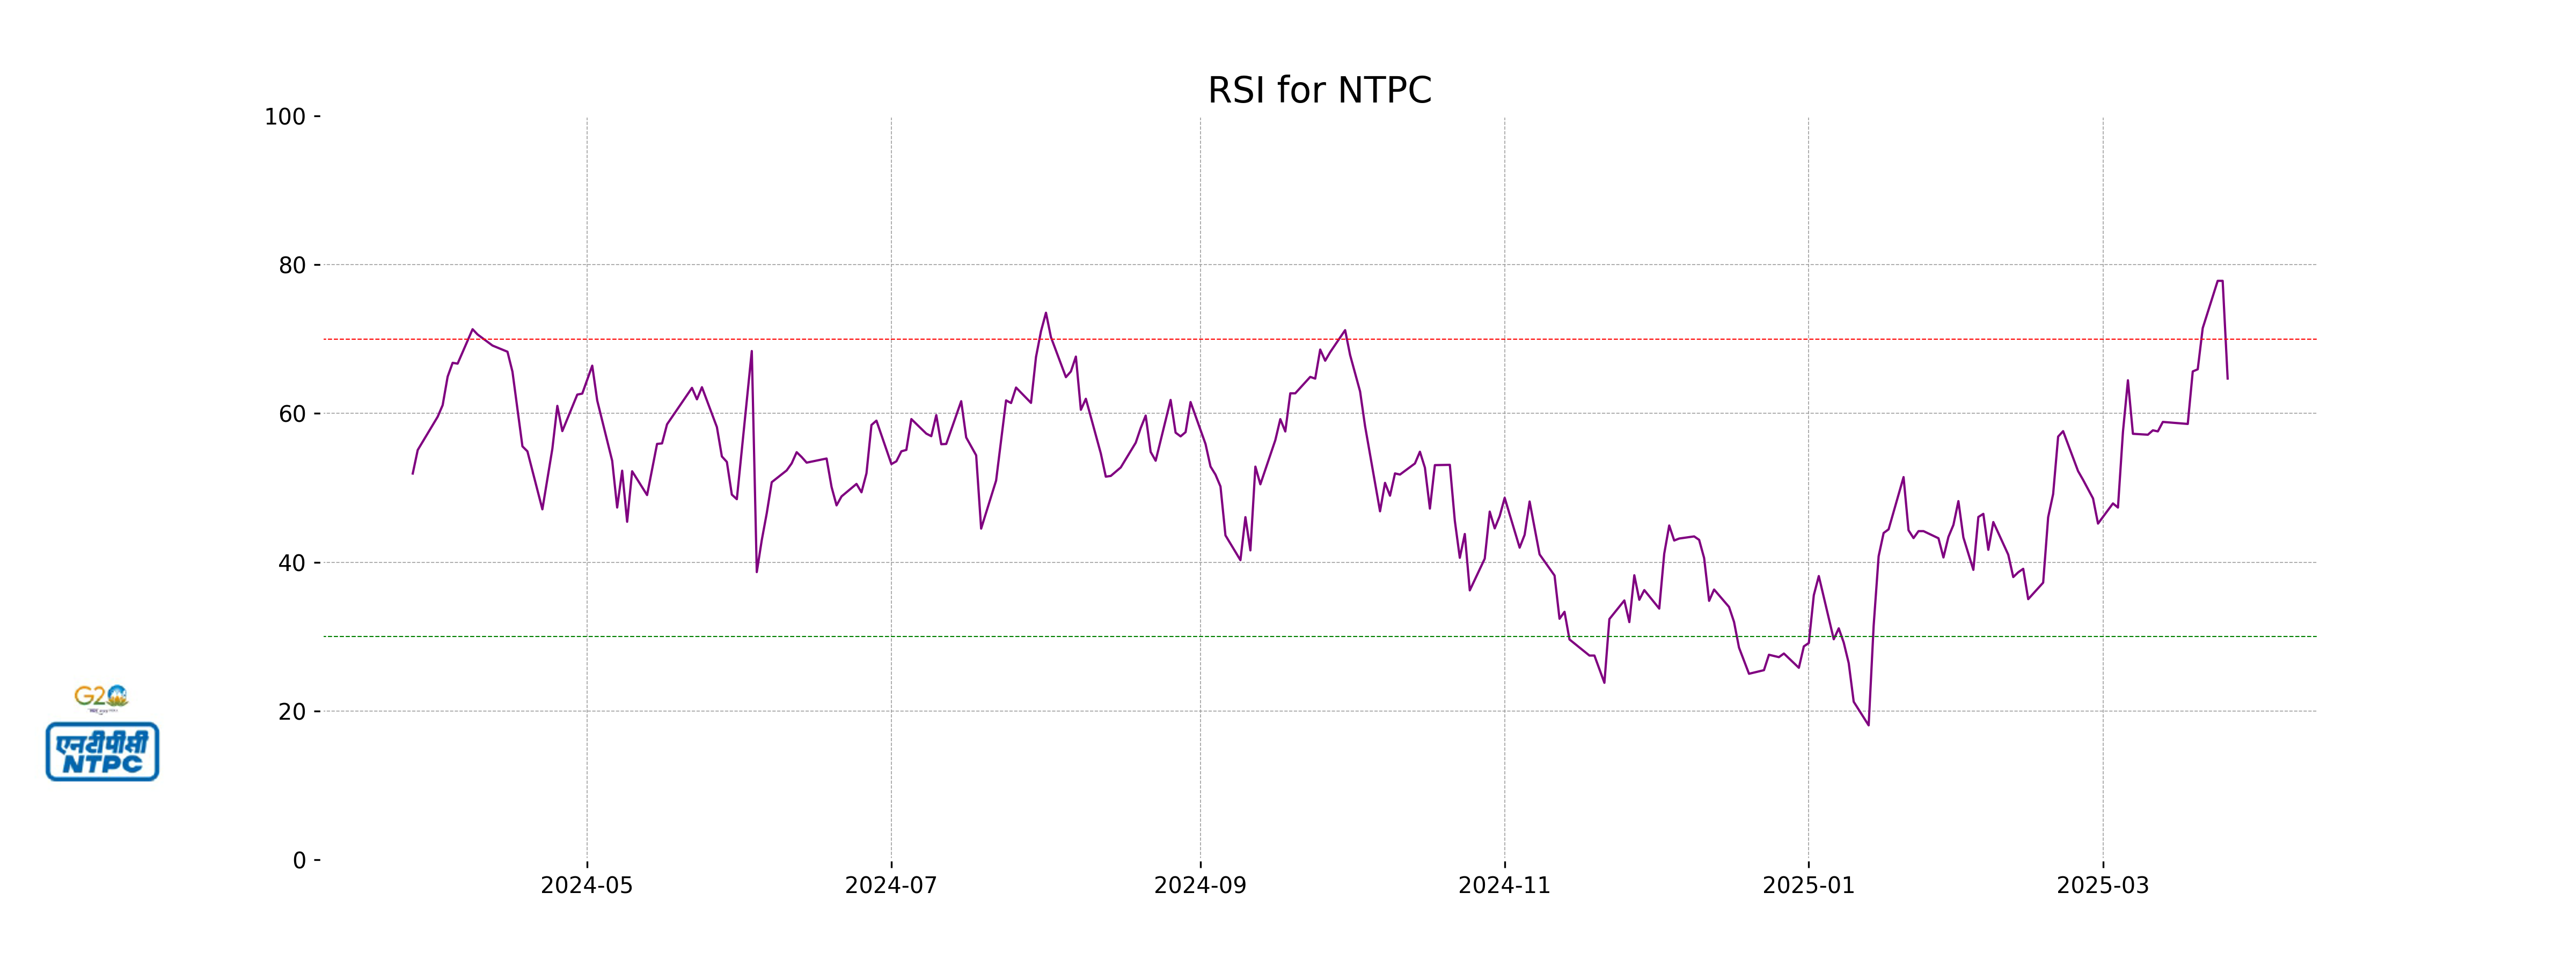
RSI Analysis
The RSI (Relative Strength Index) for NTPC stands at 64.69, indicating it is approaching overbought territory as it nears the 70 level. This suggests bullish momentum, but caution should be exercised as it might soon signal potential price reversal or consolidation.
Analysis for Tech Mahindra - March 26, 2025

Tech Mahindra experienced a decline in its stock price, closing at 1416.30, down 2.69% from the previous close of 1455.50. The stock's Relative Strength Index (RSI) of 33.64 indicates it is approaching oversold territory. With its MACD below the signal line, the momentum is bearish, and both the 50-EMA and 200-EMA are above the current price, suggesting a downward trend.

Relationship with Key Moving Averages
Tech Mahindra's current price is below its 50-day EMA (1559.66) and 200-day EMA (1558.42), indicating a bearish trend relative to these longer-term averages. The stock is also trading below the 10-day EMA (1442.97) and 20-day EMA (1480.36), suggesting recent weakness.
Moving Averages Trend (MACD)
Tech Mahindra's MACD value is -51.72, which is slightly above its MACD Signal of -54.43. This suggests a weak bullish signal, indicating a potential for a slight upward momentum, but overall the stock is in a bearish phase given the negative MACD.

RSI Analysis
Tech Mahindra's current RSI is 33.64, indicating that the stock is nearing oversold territories. An RSI below 30 typically suggests that a stock is oversold, so it is approaching potential buying interest if the trend continues.

Up Next

NSE Nifty 50: Top 5 stock losers of March 26, 2025

Global stock market indices: How the world markets performed today - 25 April 2025

Indian stock market sector-wise performance today - April 25 2025

Top 5 Nifty 50 gainers today – April 25, 2025: Biggest stock moves

NSE Nifty 50: Top 5 stock losers of April 25, 2025

Global stock market indices: How the world markets performed today - 24 April 2025

More videos

Indian stock market sector-wise performance today - April 24 2025

Top 5 Nifty 50 gainers today – April 24, 2025: Biggest stock moves
NSE Nifty 50: Top 5 stock losers of April 24, 2025

Global stock market indices: How the world markets performed today - 23 April 2025

Indian stock market sector-wise performance today - April 23, 2025
Top 5 Nifty 50 gainers today – April 23, 2025: Biggest stock moves

NSE Nifty 50: Top 5 stock losers of April 23, 2025

Sensex, Nifty rise for 6th day on foreign fund inflows, buying in banking shares

Global stock market indices: How the world markets performed today - 22 April 2025

Indian stock market sector-wise performance today - April 22, 2025