


Highlights
- BSE Sensex slightly up with a 0.04% increase
- Nifty IT jumps 1.32%, showing strong recovery
- Nifty Metal declines 1.40%, facing challenges
Latest news

Hamas warns of hostage risk amid Israeli air strikes on Gaza

'Why did you take my son’s life?', US mother faces teen accused of his murder

RCB's Swastik Chikara humorously pranked Virat Kohli by using his perfume

Ravichandran Ashwin endorsed Vijaykumar Vyshak as the real hero

BJP expels Basangouda Patil Yatnal for six years due to criticism of party

Kunal Kamra's satirical jabs stir political waters in Maharashtra

U.S. reconfigures Greenland approach amid backlash

Rahul Gandhi criticizes Speaker Om Birla for stifling opposition voices in Lok Sabha
Indian stock market sector-wise performance today - March 25, 2025


The stock market on Tuesday (March 25, 2025) witnessed mixed performances across various sectors and indices.
Overall, notable movements were recorded, though some sectors performed better than others.
The Nifty IT index was a standout performer with a significant increase of 1.32%. This upward movement in the technology sector suggests a renewed investor interest in tech stocks, possibly driven by favorable earnings reports or optimism around the technology ecosystem.
As technology firms continue to innovate, their growth potential often garners attention from both domestic and international investors.
Conversely, the Nifty Energy index faced the steepest decline, with a decrease of 1.33%. The downturn in the energy sector could be attributed to fluctuations in global energy prices or regulatory changes affecting the energy market.
The performance of energy stocks is often sensitive to geopolitical tensions and economic policies, which might have played a role in this decline.
Furthermore, the Nifty Metal index experienced a drop of 1.40%. The decline in the metal sector might reflect concerns over demand and supply dynamics or external factors affecting raw material prices.
Metal stocks can be volatile due to their reliance on industrial demand and commodity market trends.
Meanwhile, the BSESN, representing the broader market, had a marginal increase of 0.04%, indicating a day of relatively stable performance.
Other indices like the NSE Bank, Nifty FMCG, and Nifty Infrastructure experienced minor declines, signaling cautious sentiment in financial, consumer goods, and infrastructure sectors.
The Nifty Auto index also saw a decline of 0.92%, possibly influenced by market factors such as changes in automobile sales or policy impacts on the automotive industry.
It's important to consider these movements in the context of broader economic conditions, investor sentiment, and sector-specific developments.
While the technology sector soared, energy and metals faced headwinds, reflecting the diverse influences on the market landscape.
Overall, the mixed performances underscore a day where sectoral nuances dictated indices' movements rather than a uniform market trend.

Analysis for Sensex - March 25, 2025

### Sensex Performance Summary - Opening and Closing: Sensex opened at 78,296.28 and closed at 78,017.19, marking a slight increase from the previous close of 77,984.38, with a minimal percentage change of 0.042%. - Volatility and Trend: The index experienced a high of 78,741.69 and a low of 77,745.63. The RSI indicates a strong momentum at 71.30, suggesting the market is overbought. - Technical Indicators: The MACD value of 345.83, which is significantly above its signal line at -216.87, shows a bullish trend in the market. The 50 EMA at 76,118.94 and 200 EMA at 77,166.53 signify an upward momentum over these periods.

Relationship with Key Moving Averages
The Sensex is currently trading above its key moving averages, specifically above the 10-day EMA at 76,153.66, the 20-day EMA at 75,614.19, the 50-day EMA at 76,118.94, and the 200-day EMA at 77,166.53. This suggests a strong bullish trend, as the current close of 78,017.19 exceeds all these averages.
Moving Averages Trend (MACD)
Sensex MACD Analysis: The MACD for the Sensex is significantly higher than the MACD Signal, suggesting a strong bullish momentum in the market. The positive MACD value along with an RSI above 70 indicates an overbought condition, highlighting the possibility of a trend continuation or a potential price correction.

RSI Analysis
The Relative Strength Index (RSI) for Sensex is 71.30, which suggests that the market may be approaching an overbought condition. Typically, an RSI above 70 indicates that the stock may be overvalued, leading to a potential pullback. However, it is important to consider other indicators and market factors before drawing a conclusion.

Analysis for Nifty Auto - March 25, 2025

Nifty Auto Performance: Nifty Auto opened at 22,050.90 and closed at 21,737.60, reflecting a decrease of approximately 0.92% or 201.10 points from its previous close of 21,938.70. The RSI of 54.18 suggests a relatively stable market sentiment, while the MACD value of -93.30 indicates a bearish trend.

Relationship with Key Moving Averages
The Nifty Auto index closed at 21,737.60, which is below the 50 EMA of 21,903.66 and significantly below the 200 EMA of 22,787.21, indicating a potential bearish trend. However, it remains above both the 10 EMA of 21,420.78 and the 20 EMA of 21,393.12, suggesting some short-term support.
Moving Averages Trend (MACD)
The MACD for Nifty Auto is -93.30, which indicates a bearish trend, but it's above the MACD Signal line of -282.78, suggesting some potential for a reversal to the upside. This divergence implies that the bearish momentum might be weakening.

RSI Analysis
RSI Analysis for Nifty Auto: The RSI (Relative Strength Index) for Nifty Auto is at 54.18, indicating that the stock is in a neutral zone. It suggests that the stock is neither overbought nor oversold at present. The RSI value close to 50 often reflects a balanced momentum in the underlying index.

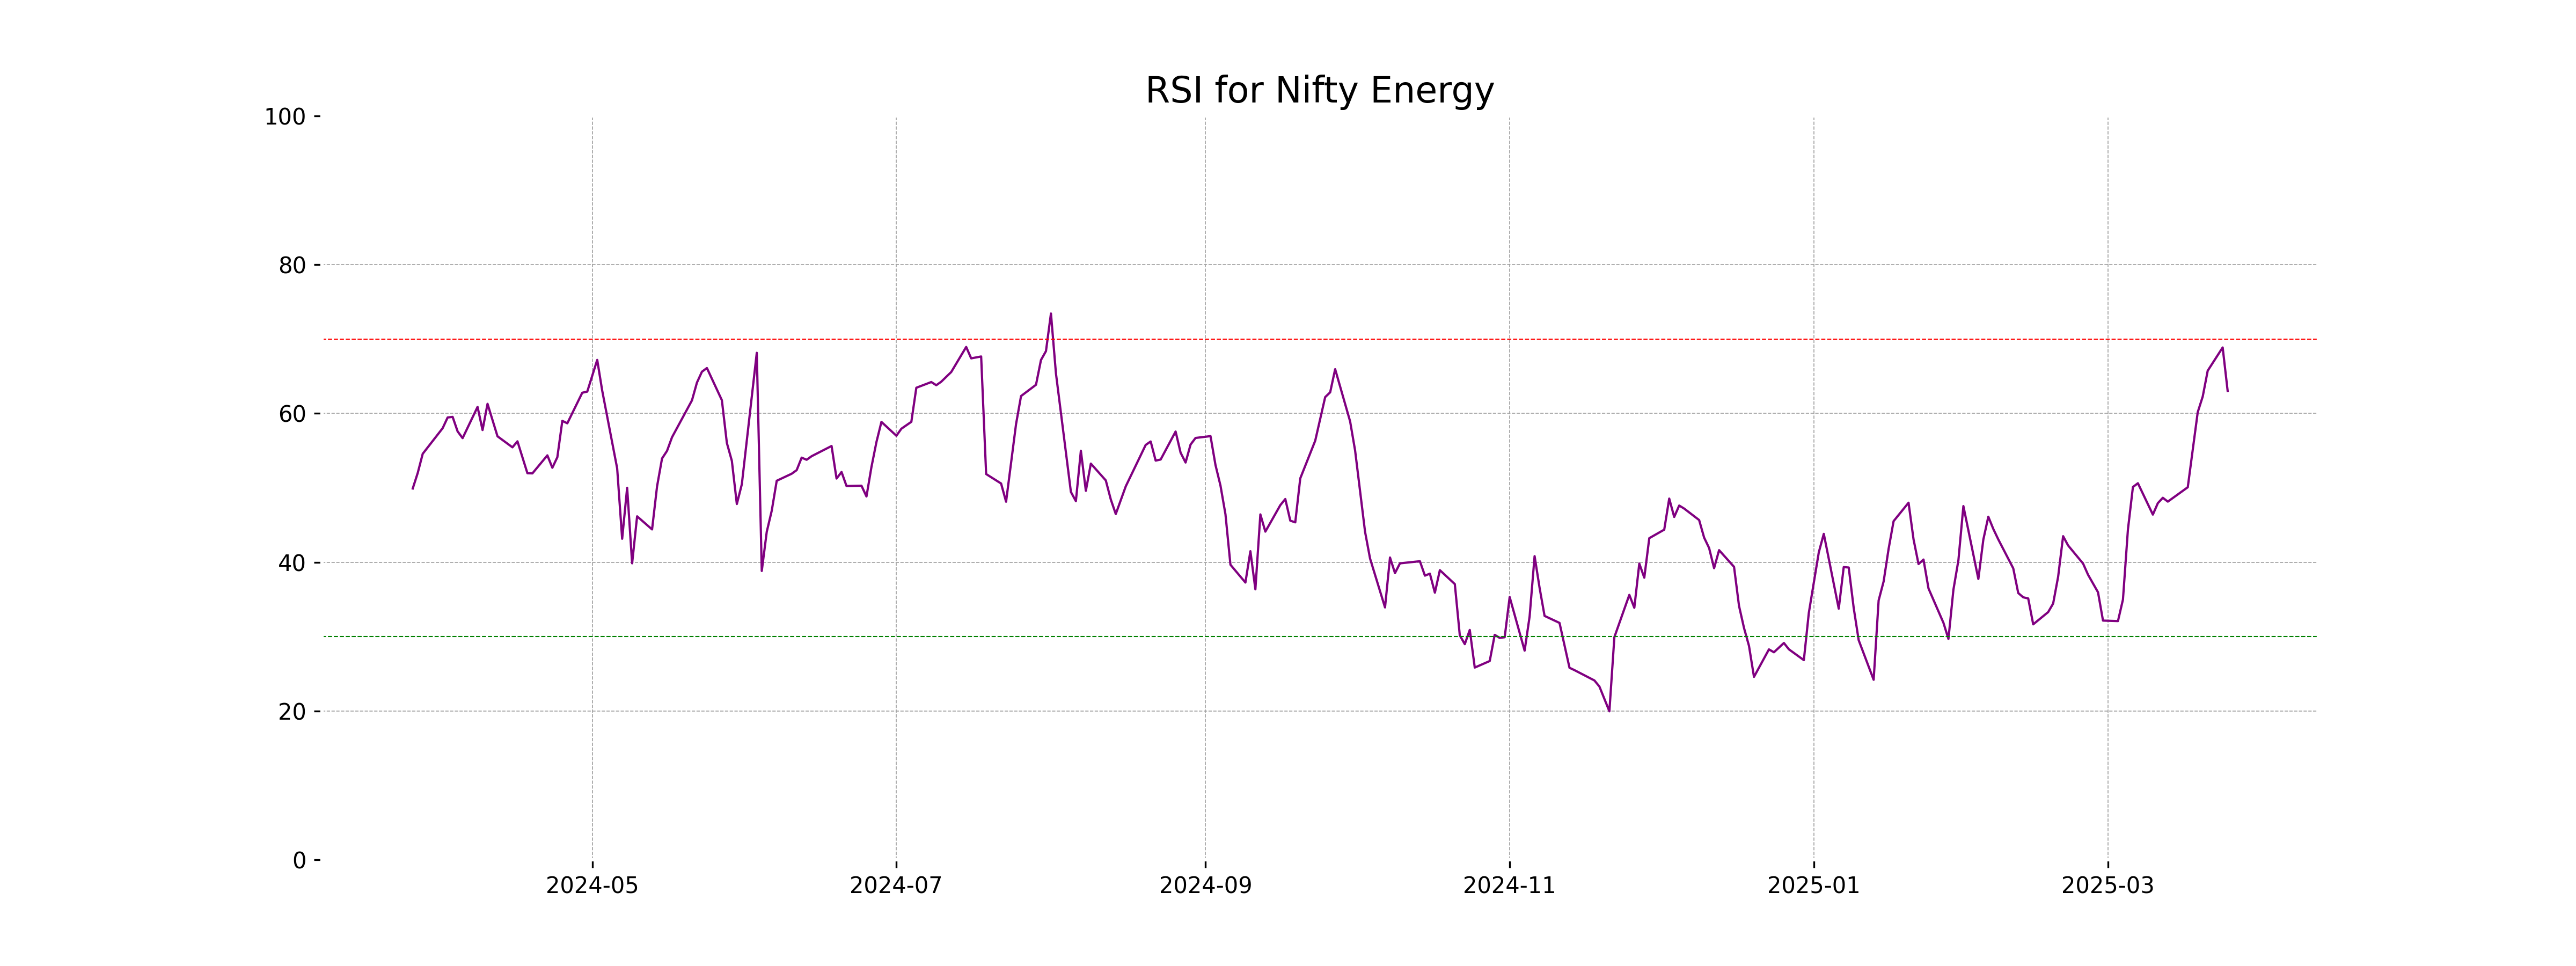
Analysis for Nifty Energy - March 25, 2025

Nifty Energy opened at 34,123.80, reached a high of 34,144.35, and closed at 33,502.40, showing a decline of approximately 1.33% from the previous close of 33,955. The index experienced a points drop of 452.60, while the RSI indicates a moderately strong market with a value of 63.03. The MACD value suggests bullish momentum, being significantly above the MACD signal line.

Relationship with Key Moving Averages
Nifty Energy is trading above its 50 and 10-day EMAs, indicating short-term bullish momentum but remains below its 200-day EMA, suggesting longer-term bearish sentiment. The recent price close is slightly below the 50-day EMA, but it is well above the 20-day EMA, pointing to a recovery trend from recent lows.
Moving Averages Trend (MACD)
MACD Analysis for Nifty Energy: The MACD value for Nifty Energy is at 366.98, significantly above the MACD Signal line which is at 7.30. This suggests a potential bullish momentum. However, the recent negative percentage change in the stock’s price should be considered for a comprehensive analysis.

RSI Analysis
Nifty Energy RSI Analysis: The Relative Strength Index (RSI) for Nifty Energy is at 63.03, which indicates that the stock is approaching overbought levels, suggesting potential caution for further upward movement. Typically, an RSI above 70 is considered overbought, while below 30 is oversold; with the current value, the stock shows strong momentum but might face resistance soon.
Analysis for Nifty FMCG - March 25, 2025

Nifty FMCG opened at 53307.10 and closed at 53131.30, registering a decrease of 0.19% with a points change of -101.45 from its previous close of 53232.75. The 50 EMA stands at 53649.35, while the 200 EMA is at 56334.57, indicating a downward trend in comparison to these longer-term moving averages. The RSI of 54.76 suggests that the index is neither overbought nor oversold.

Relationship with Key Moving Averages
Nifty FMCG closed at 53,131.30, which is below both the 50 EMA (53,649.35) and 200 EMA (56,334.57), indicating a potential bearish trend or consolidation phase. However, it remains slightly above the 10 and 20 EMA, suggesting some short-term buying support.
Moving Averages Trend (MACD)
The Nifty FMCG index shows a MACD of -182.55 with a signal line of -498.85, indicating a bullish crossover scenario as the MACD has crossed above its signal line. The negative MACD values suggest momentum is still relatively weak, but the crossover could imply a potential shift to a positive trend if supported by further price action.

RSI Analysis
The RSI for Nifty FMCG is 54.76, indicating that the market is currently in a neutral zone. Values between 30 and 70 typically suggest a balanced market, neither overbought nor oversold. Thus, no immediate trend reversal is suggested by the current RSI level.

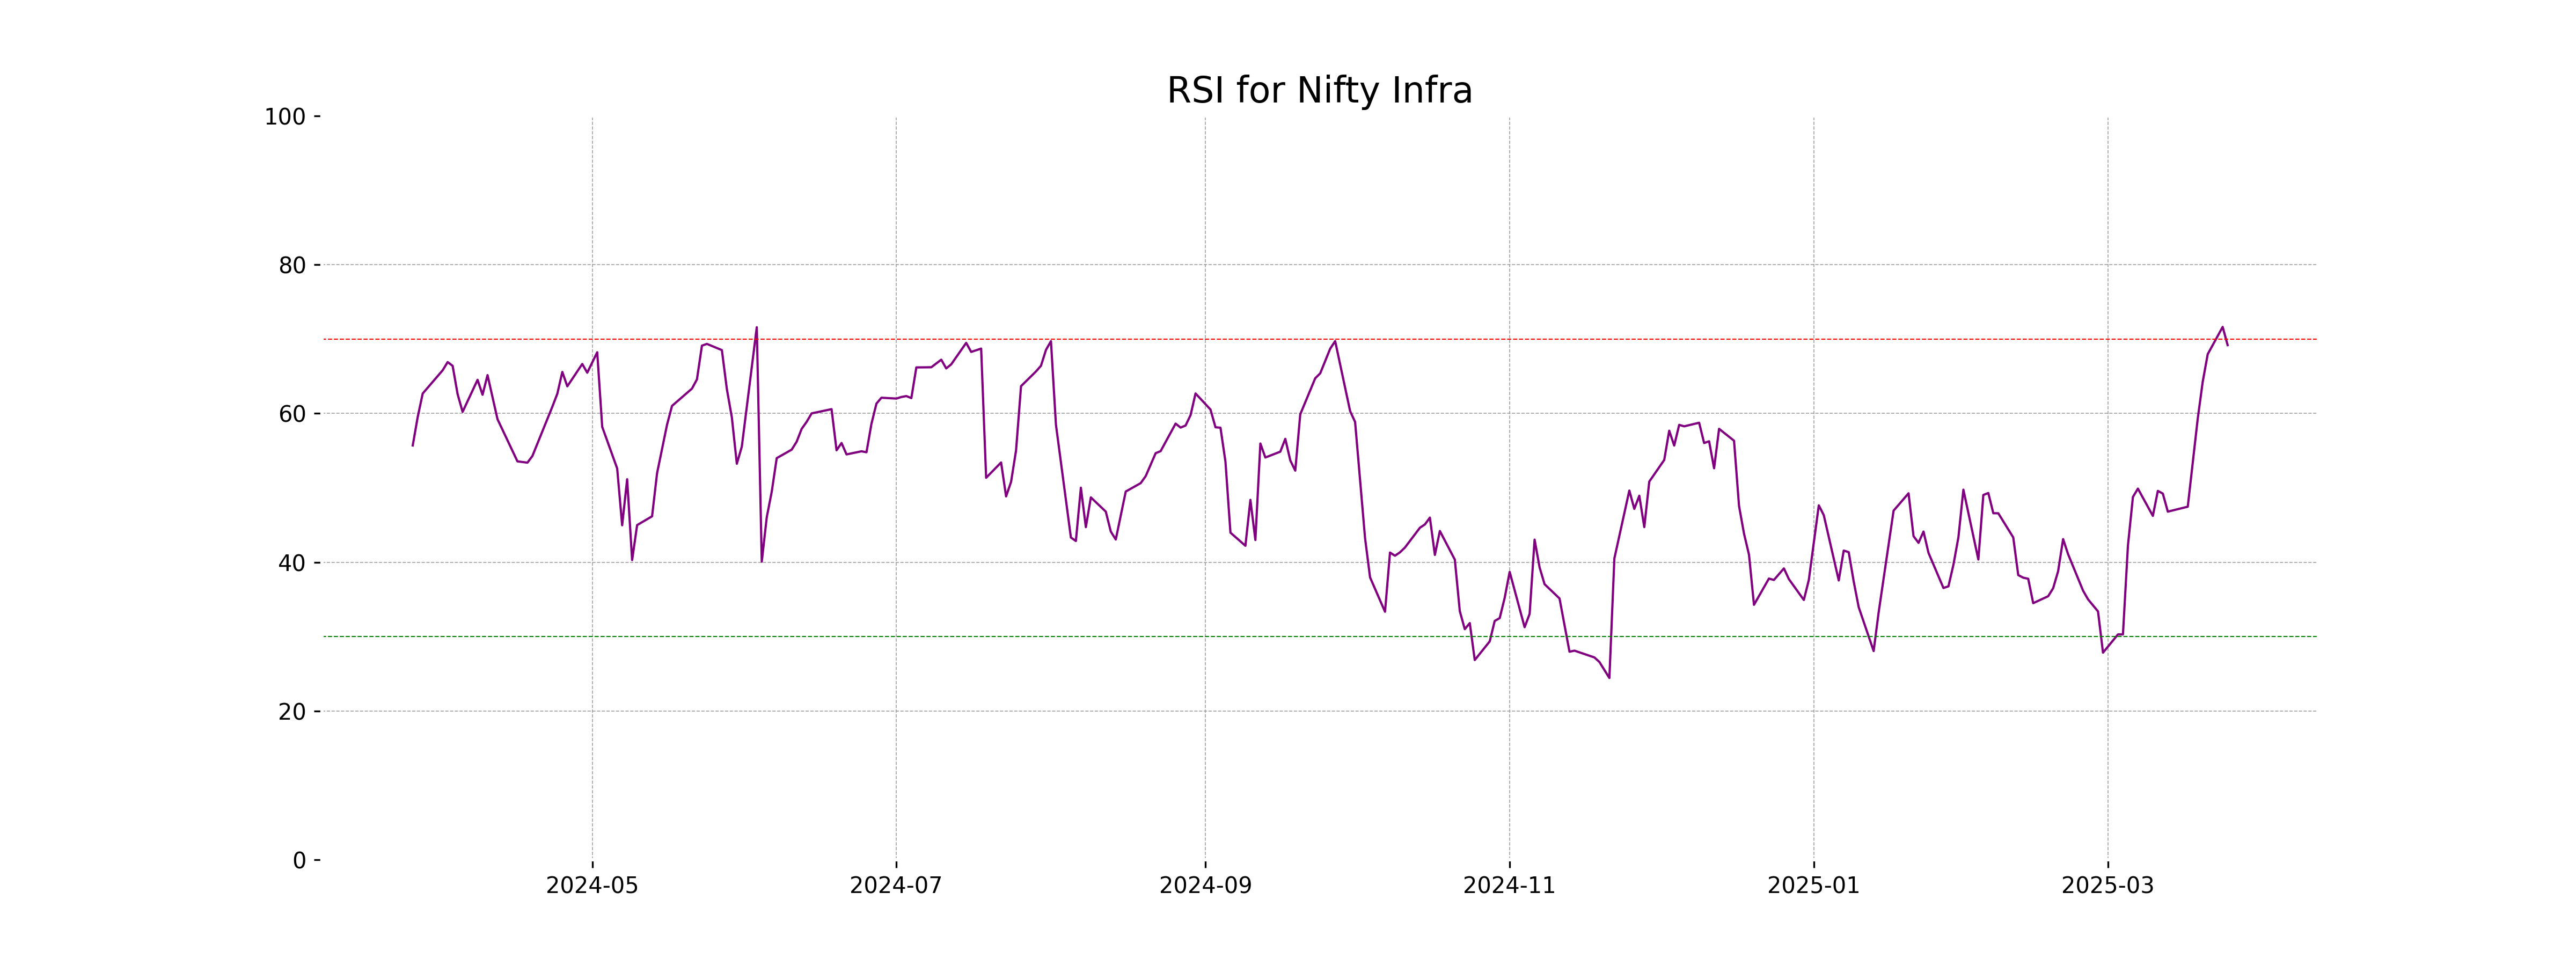
Analysis for Nifty Infra - March 25, 2025

Nifty Infra Performance: The Nifty Infra index opened at 8552.90 and closed at 8472.85, showing a slight decline of -0.41% from its previous close of 8507.50. Despite this dip, the Relative Strength Index (RSI) remains elevated at 69.18, indicating potential overbought conditions, while the MACD suggests a strong bullish trend.

Relationship with Key Moving Averages
Nifty Infra closed at 8472.85, which is above its 50 EMA of 8165.22 and close to its 200 EMA of 8402.76, indicating a potentially strong near-term trend. The presence of a high RSI value at 69.18 suggests that the index might be slightly overbought. Overall, the index appears to be in an upward trend given the positive MACD value of 86.96.
Moving Averages Trend (MACD)
MACD Analysis for Nifty Infra: The MACD value for Nifty Infra stands at 86.96, while the signal line is at 7.93, indicating a strong bullish trend. The positive divergence suggests upward momentum and potential for further price increase if this trend continues.

RSI Analysis
Based on the given data, the Relative Strength Index (RSI) for Nifty Infra stands at 69.18. This indicates that the index is approaching the overbought territory, as RSI values above 70 typically suggest strength but can also imply a potential for a price correction or pullback.
Analysis for Nifty IT - March 25, 2025

Nifty IT Performance: Nifty IT opened at 37,542.40 and closed at 37,706.90, marking a 1.32% increase with a points change of 489.85. The RSI is at 44.44, indicating a neutral trend, while the MACD is showing a bearish sign with a value of -1035.91. The 50 EMA and 200 EMA suggest that the index is trading below its long-term averages.

Relationship with Key Moving Averages
Nifty IT closed above its 10-day EMA but below its 20-day, 50-day, and 200-day EMAs, suggesting short-term bullishness but potential long-term resistance. The current price action shows a narrowing gap with the 20-day EMA, indicating a possible consolidation or trend reversal.
Moving Averages Trend (MACD)
MACD Analysis for Nifty IT: The MACD indicator for Nifty IT shows a value of -1035.91, which is below the MACD Signal line of -1242.94, suggesting a potential upward momentum. This indicates that the bearish trend might be weakening, and a bullish crossover could be possible if the trend continues.

RSI Analysis
The RSI for Nifty IT is 44.44, which suggests the index is neither in the overbought nor oversold territory. Generally, an RSI below 30 is considered oversold, while above 70 is overbought, so Nifty IT currently shows a neutral momentum.

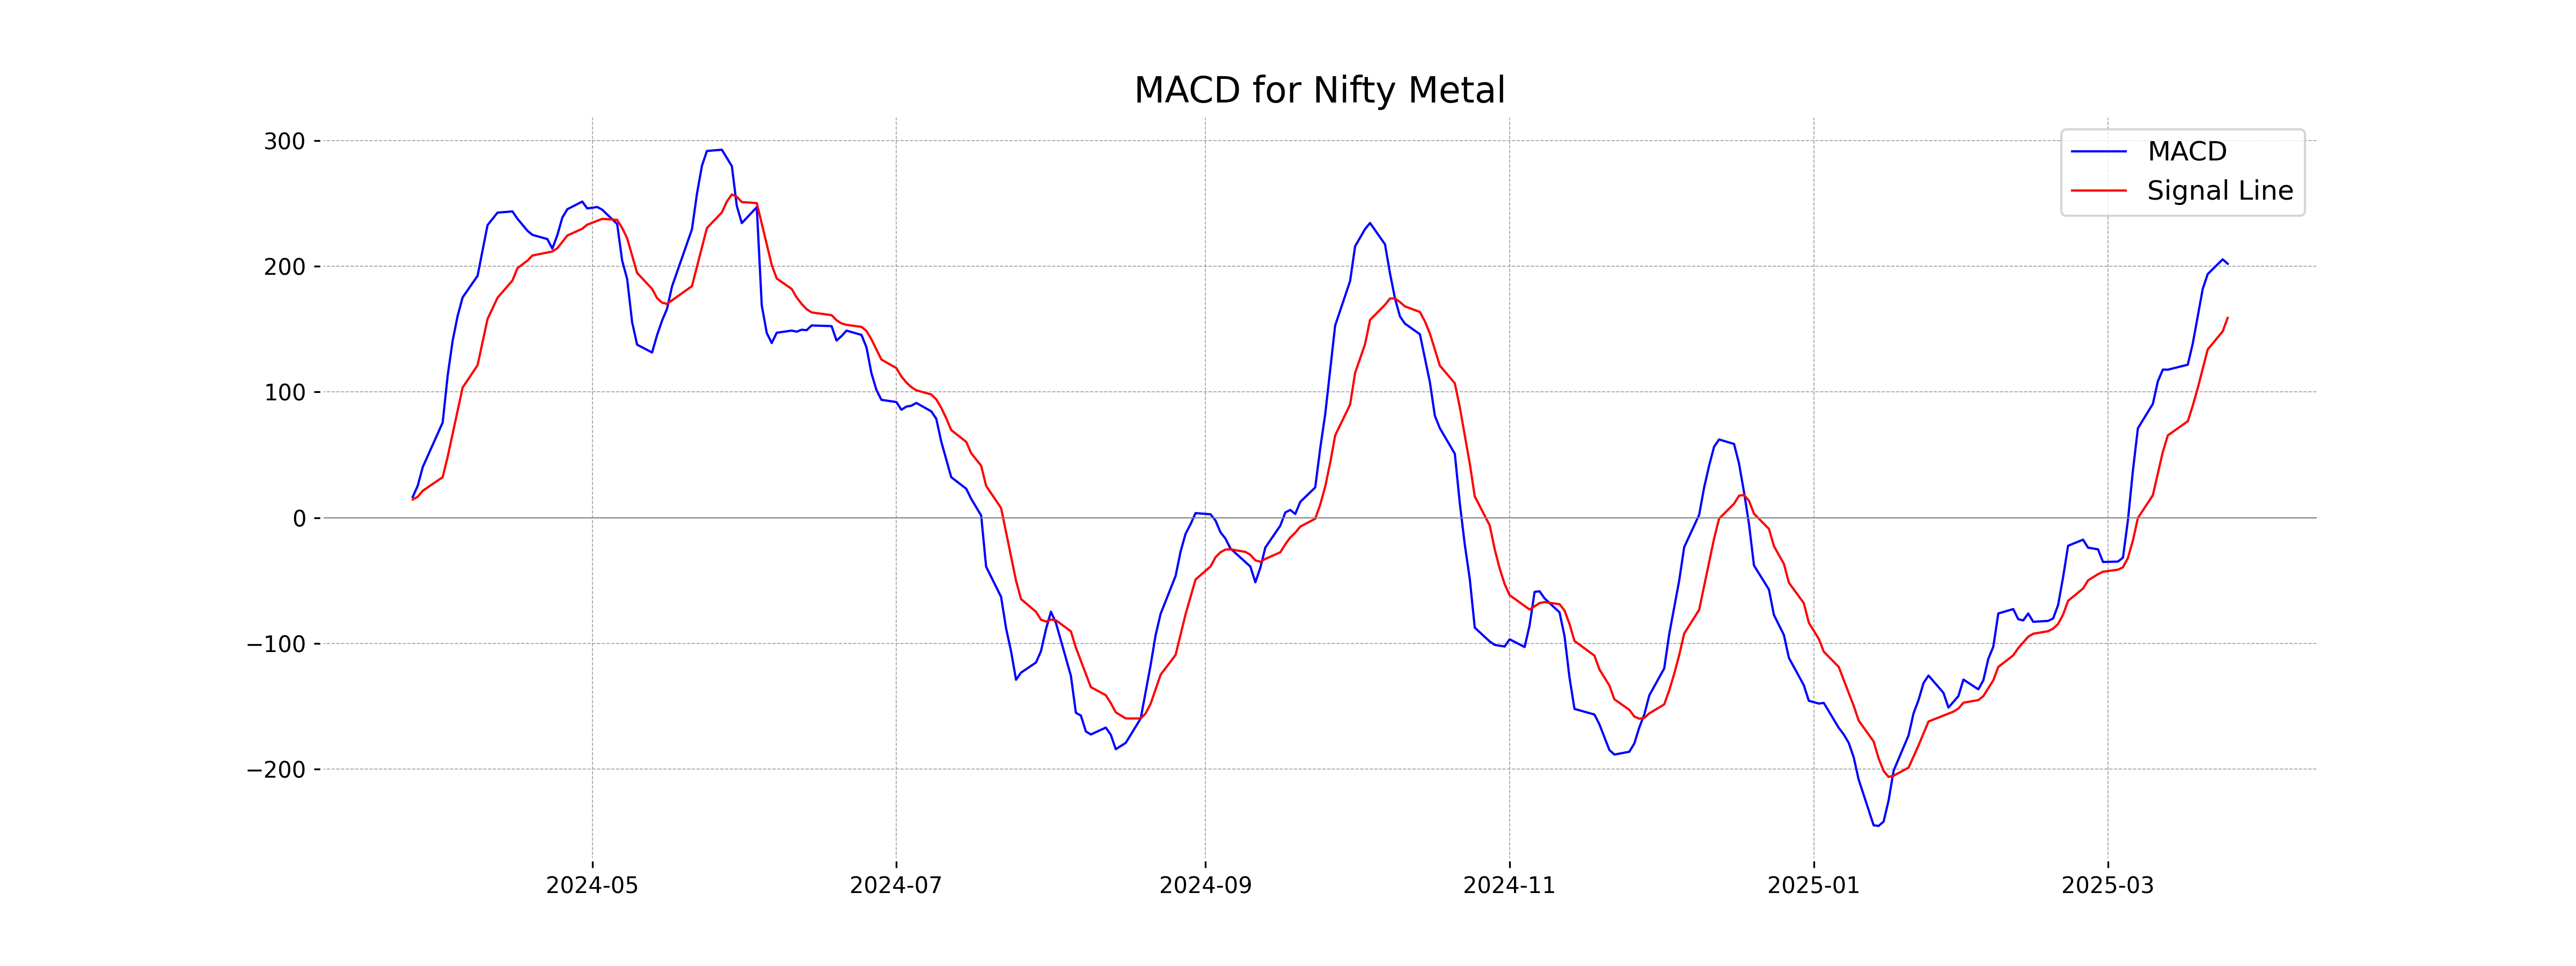
Analysis for Nifty Metal - March 25, 2025

Nifty Metal opened at 9291.35, reaching a high of 9299.15 and a low of 9098.20, ultimately closing at 9132.90. This represents a percentage decrease of 1.40% from its previous close of 9262.85, with a points change of -129.95. The technical indicators show that the 10-day EMA is above the 20-day EMA, and the MACD is above its signal line, indicating positive momentum, although the price decrease suggests recent weakness.

Relationship with Key Moving Averages
Based on the provided data, Nifty Metal's close price of 9132.90 is above its 10 EMA of 9050.00, indicating short-term strength. However, the close price is below both the 50 EMA of 8717.45 and the 200 EMA of 8812.03, suggesting a longer-term upward momentum.
Moving Averages Trend (MACD)
The MACD value for Nifty Metal is 202.01, with a MACD signal line at 158.93, indicating a bullish momentum as the MACD line is above the signal line. This suggests potential upward price movement if the trend persists.
RSI Analysis
The RSI value for Nifty Metal is 62.41, which indicates that the stock is neither overbought nor oversold, but is closer to the overbought threshold of 70. This suggests that there is still room for upward movement, but caution is advised as it approaches overbought levels.

Analysis for Nifty Bank - March 25, 2025

Nifty Bank opened at 51874.20, reaching a high of 52063.95 and a low of 51429.60, before closing at 51607.95, marking a slight decrease of 0.19% or 97.0 points from the previous close of 51704.95. The stock's 50-day EMA stands at 49525.26, while the 200-day EMA is 49941.33, with an RSI of 73.37 indicating a relatively strong momentum.

Relationship with Key Moving Averages
The Nifty Bank index closed at 51607.95, which is above the 50-day EMA (49525.26), 200-day EMA (49941.33), 10-day EMA (50046.81), and 20-day EMA (49506.66). This suggests a strong bullish trend, as the closing price is higher than all the key moving averages.
Moving Averages Trend (MACD)
The MACD for Nifty Bank is 454.63, which is significantly higher than the MACD Signal of 37.65, indicating strong bullish momentum. This suggests a potential continuation of the upward price trend.

RSI Analysis
The RSI for Nifty Bank is 73.37, indicating that it is in the overbought territory. This suggests that the stock might be overvalued, and a price correction could be imminent. Traders might look for potential selling opportunities or wait for a pullback to re-enter.

Analysis for Nifty 50 - March 25, 2025

Nifty 50 opened at 23751.5, reached a high of 23869.6, and closed at 23668.65. The index showed a slight positive change of 0.04%, with a small increase of 10.3 points. The Relative Strength Index is at 71.52, indicating a strong momentum.

Relationship with Key Moving Averages
Nifty 50 is currently trading at 23,668.65, which is above the 50 EMA of 23,062.75 and the 200 EMA of 23,406.87, indicating a bullish trend. The current close is also higher than both the 10 EMA (23,105.12) and the 20 EMA (22,926.39), further supporting the positive momentum.
Moving Averages Trend (MACD)
The Nifty 50's MACD value of 123.50 indicates strong bullish momentum, as it is significantly above the MACD Signal line of -48.48. This suggests that the upward trend may continue, but it's important to monitor for potential overbought conditions, given the high RSI of 71.52.

RSI Analysis
The RSI value for Nifty 50 is 71.52, indicating that the index is in the overbought territory. This suggests potential for a price correction or pullback, as the RSI is above the typical overbought threshold of 70. Traders may consider this a signal to evaluate their positions.

Up Next

Indian stock market sector-wise performance today - March 25, 2025

Indian stock market sector-wise performance today - March 26, 2025

Top 5 Nifty 50 gainers today – March 26, 2025: Biggest stock moves

NSE Nifty 50: Top 5 stock losers of March 26, 2025

Global stock market indices: How the world markets performed today - 25 March 2025

Top 5 Nifty 50 gainers today – March 25, 2025: Biggest stock moves

More videos

NSE Nifty 50: Top 5 stock losers of March 25, 2025

Amid probe into Rs 100 crore Bribe-for-Jobs scandal, TCS names new hiring head

TCS hit by bribe-for-job scandal; 4 fired, 3 HR consulting firms blacklisted

Global stock market indices: How the world markets performed today - 21 March 2025

Indian stock market sector-wise performance today - March 21, 2025

Top 5 Nifty 50 gainers today – March 21, 2025: Biggest stock moves

NSE Nifty 50: Top 5 stock losers of March 21, 2025

Global stock market indices: How the world markets performed today - 20 March 2025

Indian stock market sector-wise performance today - March 20, 2025

Top 5 Nifty 50 gainers today – March 20, 2025: Biggest stock moves