


Highlights
- Adani Enterprises shows bullish momentum despite price decline
- IndusInd Bank enters oversold territory with RSI at 19.23
- Coal India trades above 50 EMA but faces resistance
Latest news

Hamas warns of hostage risk amid Israeli air strikes on Gaza

'Why did you take my son’s life?', US mother faces teen accused of his murder

RCB's Swastik Chikara humorously pranked Virat Kohli by using his perfume

Ravichandran Ashwin endorsed Vijaykumar Vyshak as the real hero

BJP expels Basangouda Patil Yatnal for six years due to criticism of party

Kunal Kamra's satirical jabs stir political waters in Maharashtra

U.S. reconfigures Greenland approach amid backlash

Rahul Gandhi criticizes Speaker Om Birla for stifling opposition voices in Lok Sabha
NSE Nifty 50: Top 5 stock losers of March 25, 2025


In this article, we will explore the technical indicators of some of the low-performing stocks on the Indian stock market, including ADANIENT, ADANIPORTS, COALINDIA, DRREDDY, and INDUSINDBK.
By looking at these stocks through the lens of key technical factors, we aim to better understand their price movements, trends, and potential future performance.

Analysis for Adani Enterprises - March 25, 2025

Adani Enterprises experienced a decrease of 2.04% in its stock price, closing at 2320.35 compared to the previous close of 2368.70. Despite the decline, the company maintains a strong RSI of 56.89 and a favorable MACD above its signal line, suggesting potential bullish momentum. The stock operates within the Energy sector, specifically in the Thermal Coal industry, with a market cap of approximately 2.68 trillion INR.

Relationship with Key Moving Averages
Adani Enterprises, with a close price of 2320.35, is trading above its 10 EMA of 2300.76 and 50 EMA of 2301.07, indicating short-term upward momentum. However, it remains below the 200 EMA of 2602.94, suggesting a longer-term downtrend relative to its historical performance.
Moving Averages Trend (MACD)
Adani Enterprises' MACD is 23.95, considerably above the MACD Signal line of 3.71, indicating a strong bullish momentum. This might suggest a positive trend reversal or a continuation of upward movement if the trend maintains. However, it's essential to consider other indicators and market conditions for comprehensive analysis.

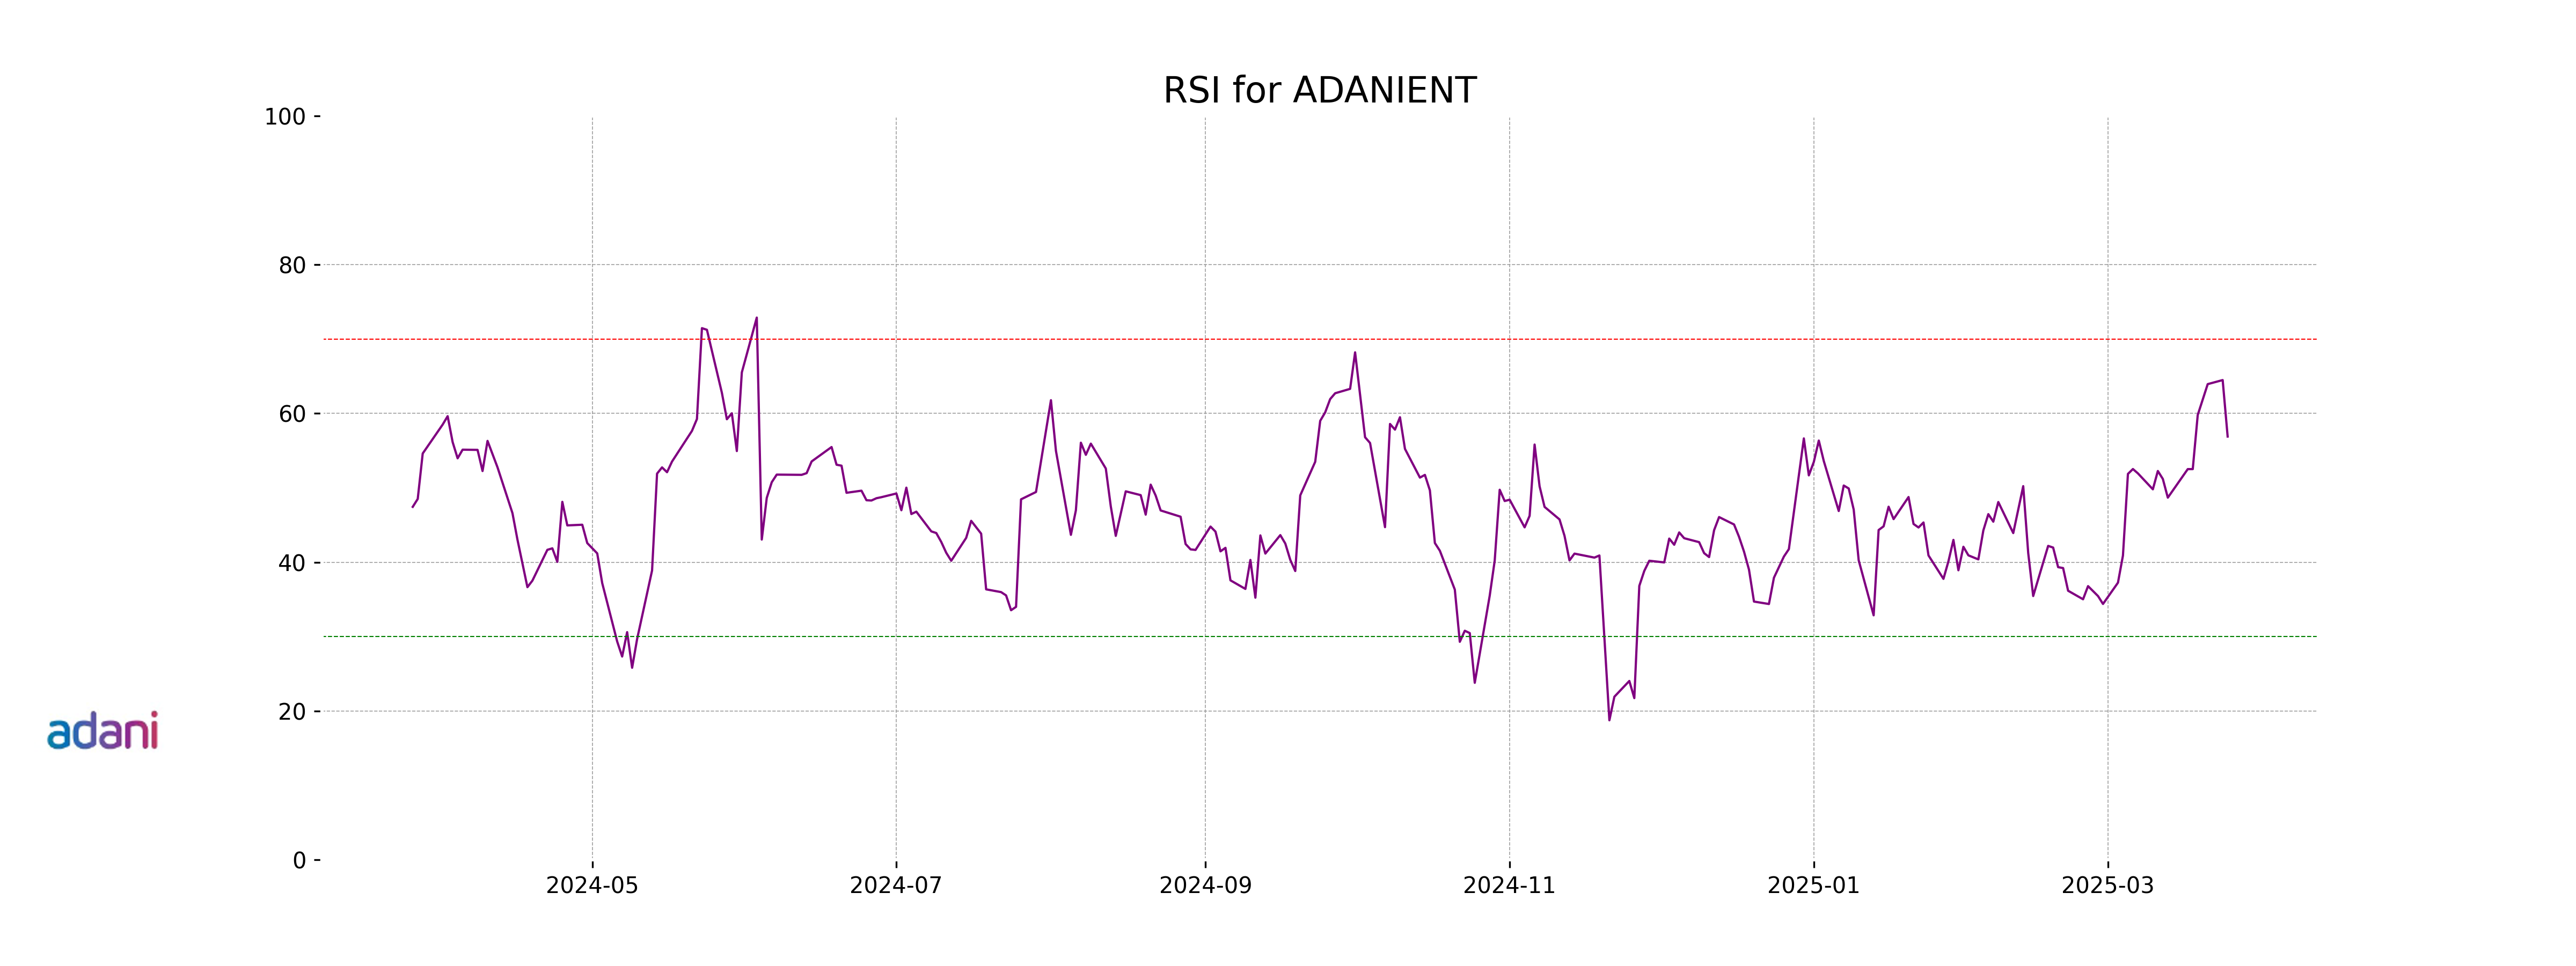
RSI Analysis
### RSI Analysis for Adani Enterprises The Relative Strength Index (RSI) for Adani Enterprises stands at approximately 56.89, indicating a neutral market position. This suggests that the stock is neither overbought nor oversold, with room for potential upward or downward movement depending on the overall market trends and investor sentiment.
Analysis for Adani Ports - March 25, 2025

Adani Ports closed at 1182.45, down by -1.53% from the previous close of 1200.80. The stock's performance shows a decline with a MACD suggesting bullish momentum and an RSI indicating it is neither overbought nor oversold. With a market cap of 2.55 trillion, it operates in the Marine Shipping industry in India's industrial sector.

Relationship with Key Moving Averages
Based on the data, Adani Ports is trading above its 50-day EMA but below its 200-day EMA. The current price is also above the 10-day and slightly above the 20-day EMAs. This indicates a short-term upward momentum amidst a longer-term bearish trend.
Moving Averages Trend (MACD)
Adani Ports exhibits a bullish signal with its MACD line at 20.25, which is above the MACD Signal line at 11.17. This suggests a potential upward momentum in the stock's price trend.

RSI Analysis
The Relative Strength Index (RSI) for Adani Ports is 62.09, indicating that the stock is neither overbought nor oversold, as it remains in the neutral zone. Generally, an RSI above 70 suggests overbought conditions, while below 30 indicates oversold conditions.

Analysis for Coal India - March 25, 2025

Coal India observed a negative performance in recent trading, with a closing price of 398.30 INR, reflecting a decrease of approximately 1.90% from its previous close of 406.00 INR. Although the stock remains above its 50-day EMA of 381.45 INR, it is slightly below its 200-day EMA, indicating potential resistance levels. The market cap stands at approximately 2.45 trillion INR, positioning it as a significant entity in the energy sector, particularly within the thermal coal industry in India.

Relationship with Key Moving Averages
Based on the data, Coal India's stock is trading below its previous close of 406.0, with a current close of 398.3. The stock is above its 50 EMA of 381.45 and near its 200 EMA of 401.22, indicating some upward momentum over the short term but testing the long-term trend.
Moving Averages Trend (MACD)
The MACD for Coal India is currently at 8.04, which is above the MACD signal line of 4.97. This suggests a bullish trend, indicating the possibility of upward momentum in the stock price.

RSI Analysis
Coal India currently has an RSI of 62.53, which suggests that the stock is in the neutral zone, leaning towards being overbought but not yet in the overbought territory (above 70). This indicates that the stock's price is neither greatly undervalued nor overvalued at the moment, and it may continue with its current trend unless other indicators suggest otherwise.

Analysis for Dr Reddys Labs - March 25, 2025

Dr. Reddys Labs delivered a closing price of 1177.90, marking a decline of 2.68% from the previous close of 1210.30, with a volume of 2,860,801 shares traded. The stock's performance aligns with key technical indicators, such as a 50-day EMA of 1192.40 and a 200-day EMA of 1235.72, suggesting a bearish momentum with its MACD at -1.64 and RSI at 52.54.

Relationship with Key Moving Averages
Dr Reddy's Laboratories' current closing price of 1177.90 is below its 50-day EMA of 1192.40 and its 200-day EMA of 1235.72, suggesting a bearish trend relative to these averages. However, it is above the 10-day EMA of 1169.35 and the 20-day EMA of 1163.80, indicating potential short-term support.
Moving Averages Trend (MACD)
Dr Reddy's Laboratories' MACD value is -1.64, which is above its MACD Signal of -14.03. This indicates a potential bullish momentum, as the MACD line is moving closer to crossing above the signal line. A cross above would confirm a buy signal, suggesting increasing positive momentum for the stock.

RSI Analysis
Dr Reddys Labs has a Relative Strength Index (RSI) of 52.54, indicating a neutral position. This suggests that the stock is neither overbought nor oversold at the moment. With the RSI near the mid-point of 50, the stock might be in a stable zone, but traders should watch for any emerging trends.

Analysis for IndusInd Bank - March 25, 2025

IndusInd Bank experienced a decline in its stock performance, with a closing price of 637.05, down by 4.84% from the previous close. The stock's Relative Strength Index (RSI) is notably low at 19.23, indicating potential oversold conditions. Despite a market cap of approximately 496.3 billion and a PE ratio of 6.85, its stock currently trades below significant moving averages including the 50 EMA and 200 EMA.
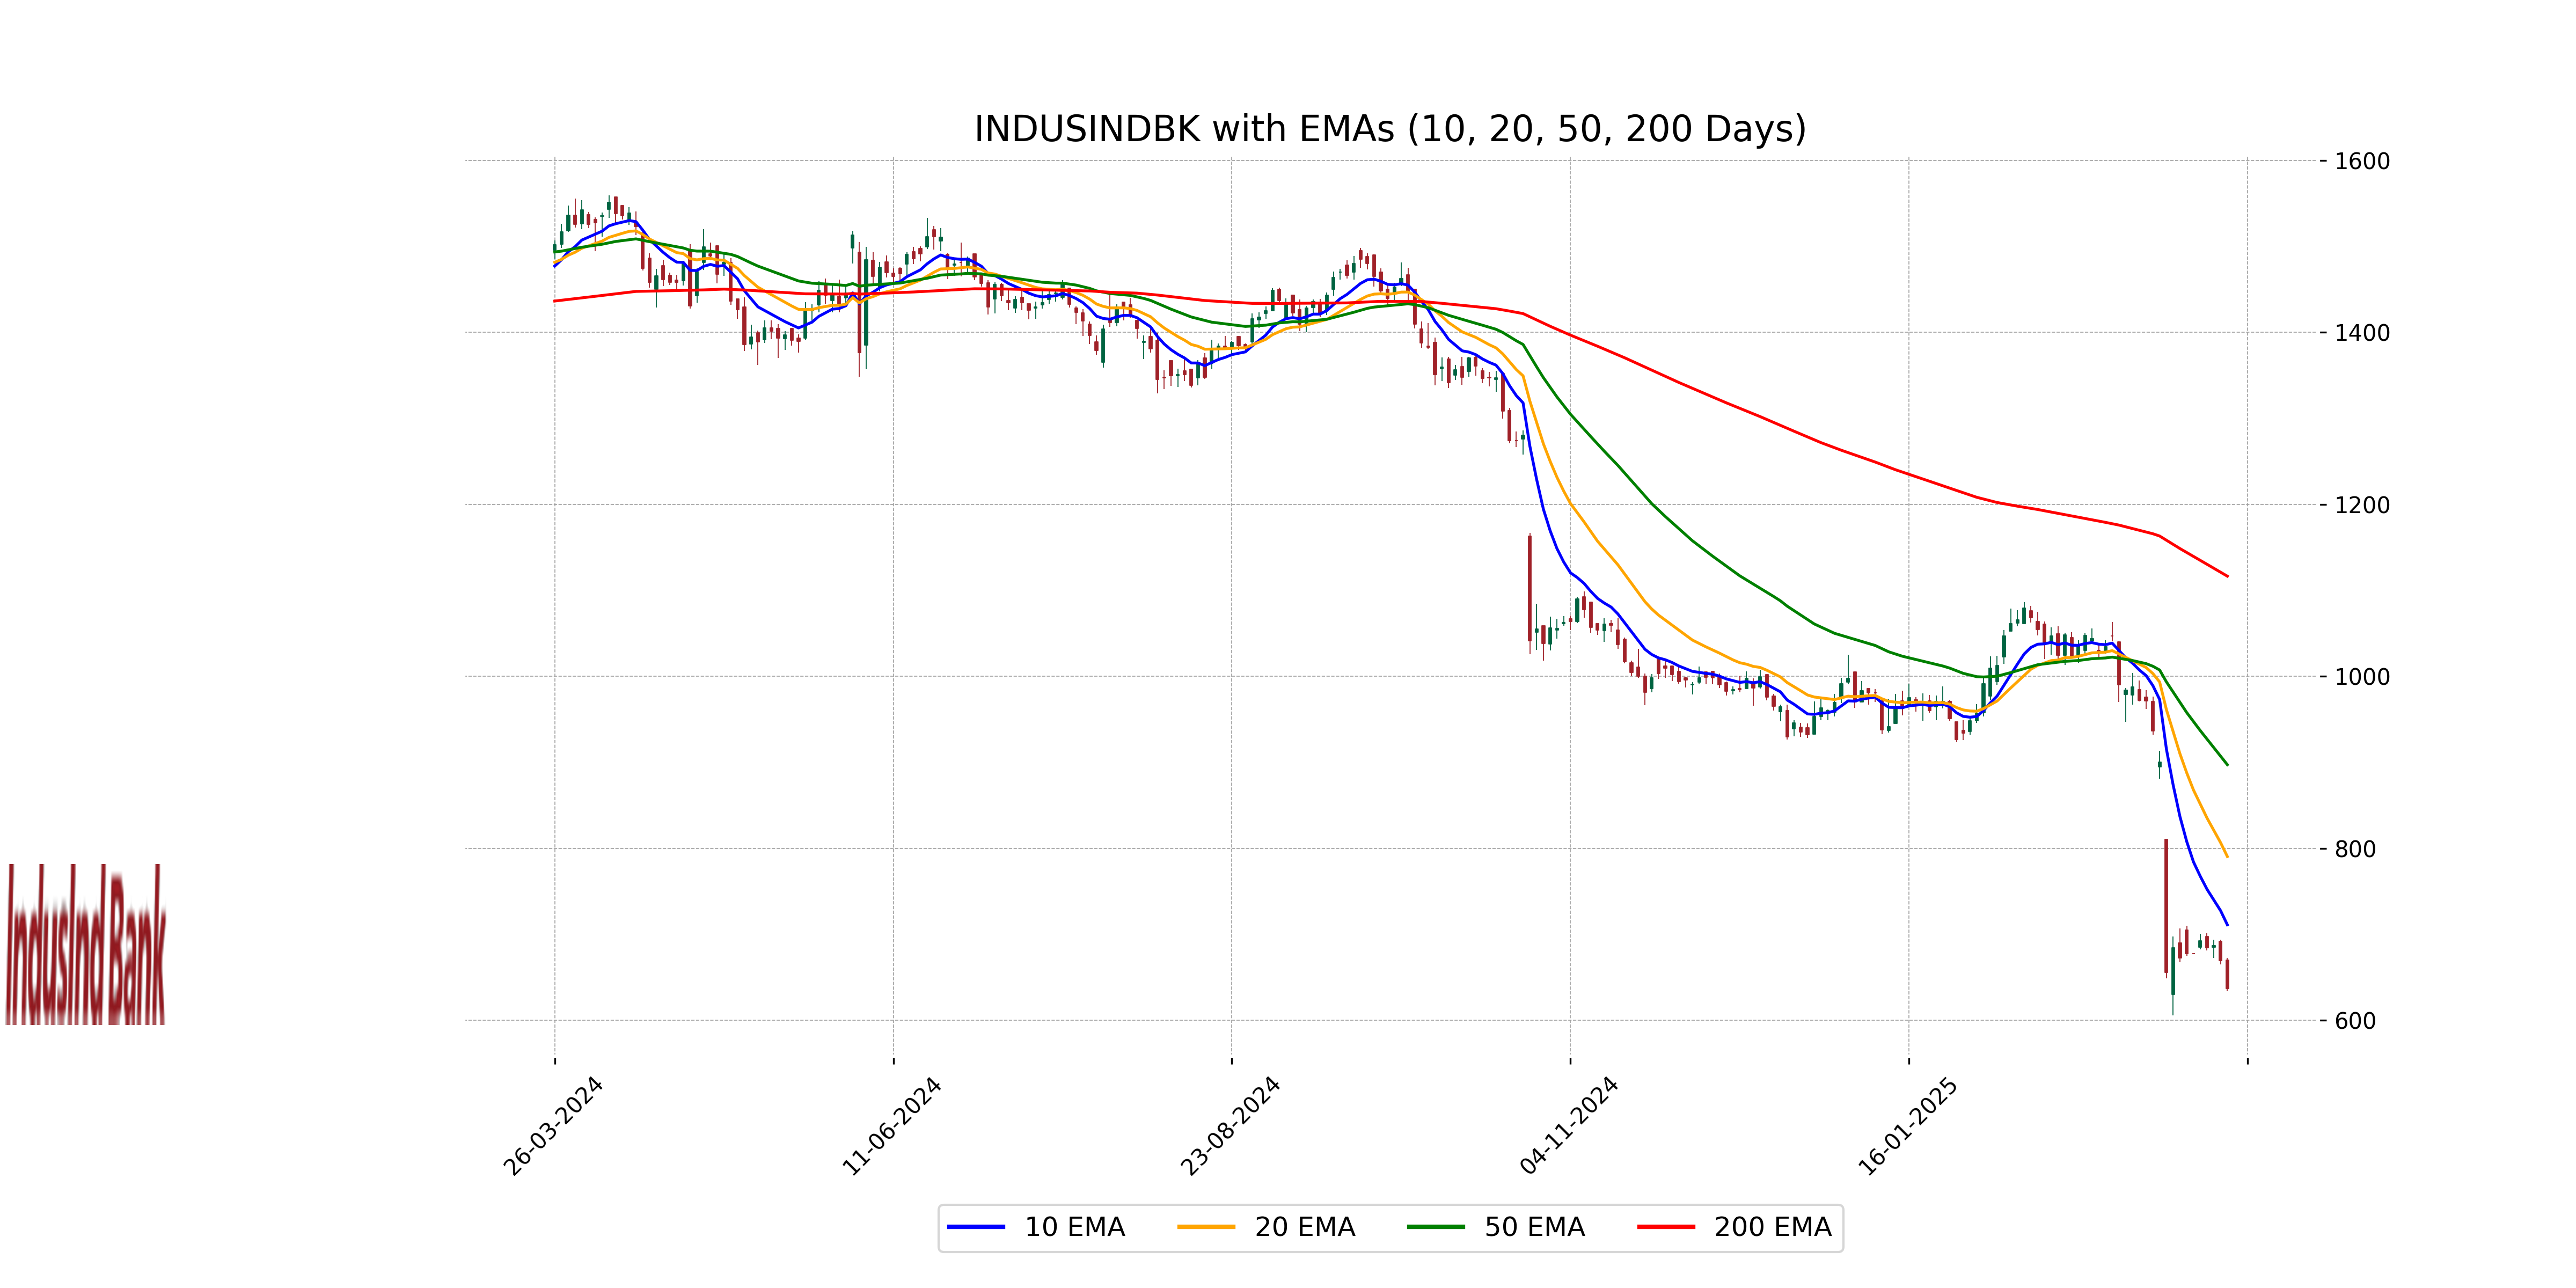
Relationship with Key Moving Averages
IndusInd Bank's current stock price of 637.05 is significantly below its key moving averages, including the 50 EMA at 897.25 and the 200 EMA at 1116.46, indicating a strong bearish trend. Additionally, the 10 EMA and 20 EMA, at 711.10 and 790.49 respectively, are also above the current price, further underscoring the downward momentum.
Moving Averages Trend (MACD)
The MACD value for IndusInd Bank is -93.87, while the MACD Signal is -78.20. This indicates a bearish signal as the MACD line is below the signal line, suggesting potential downside momentum in the stock price.

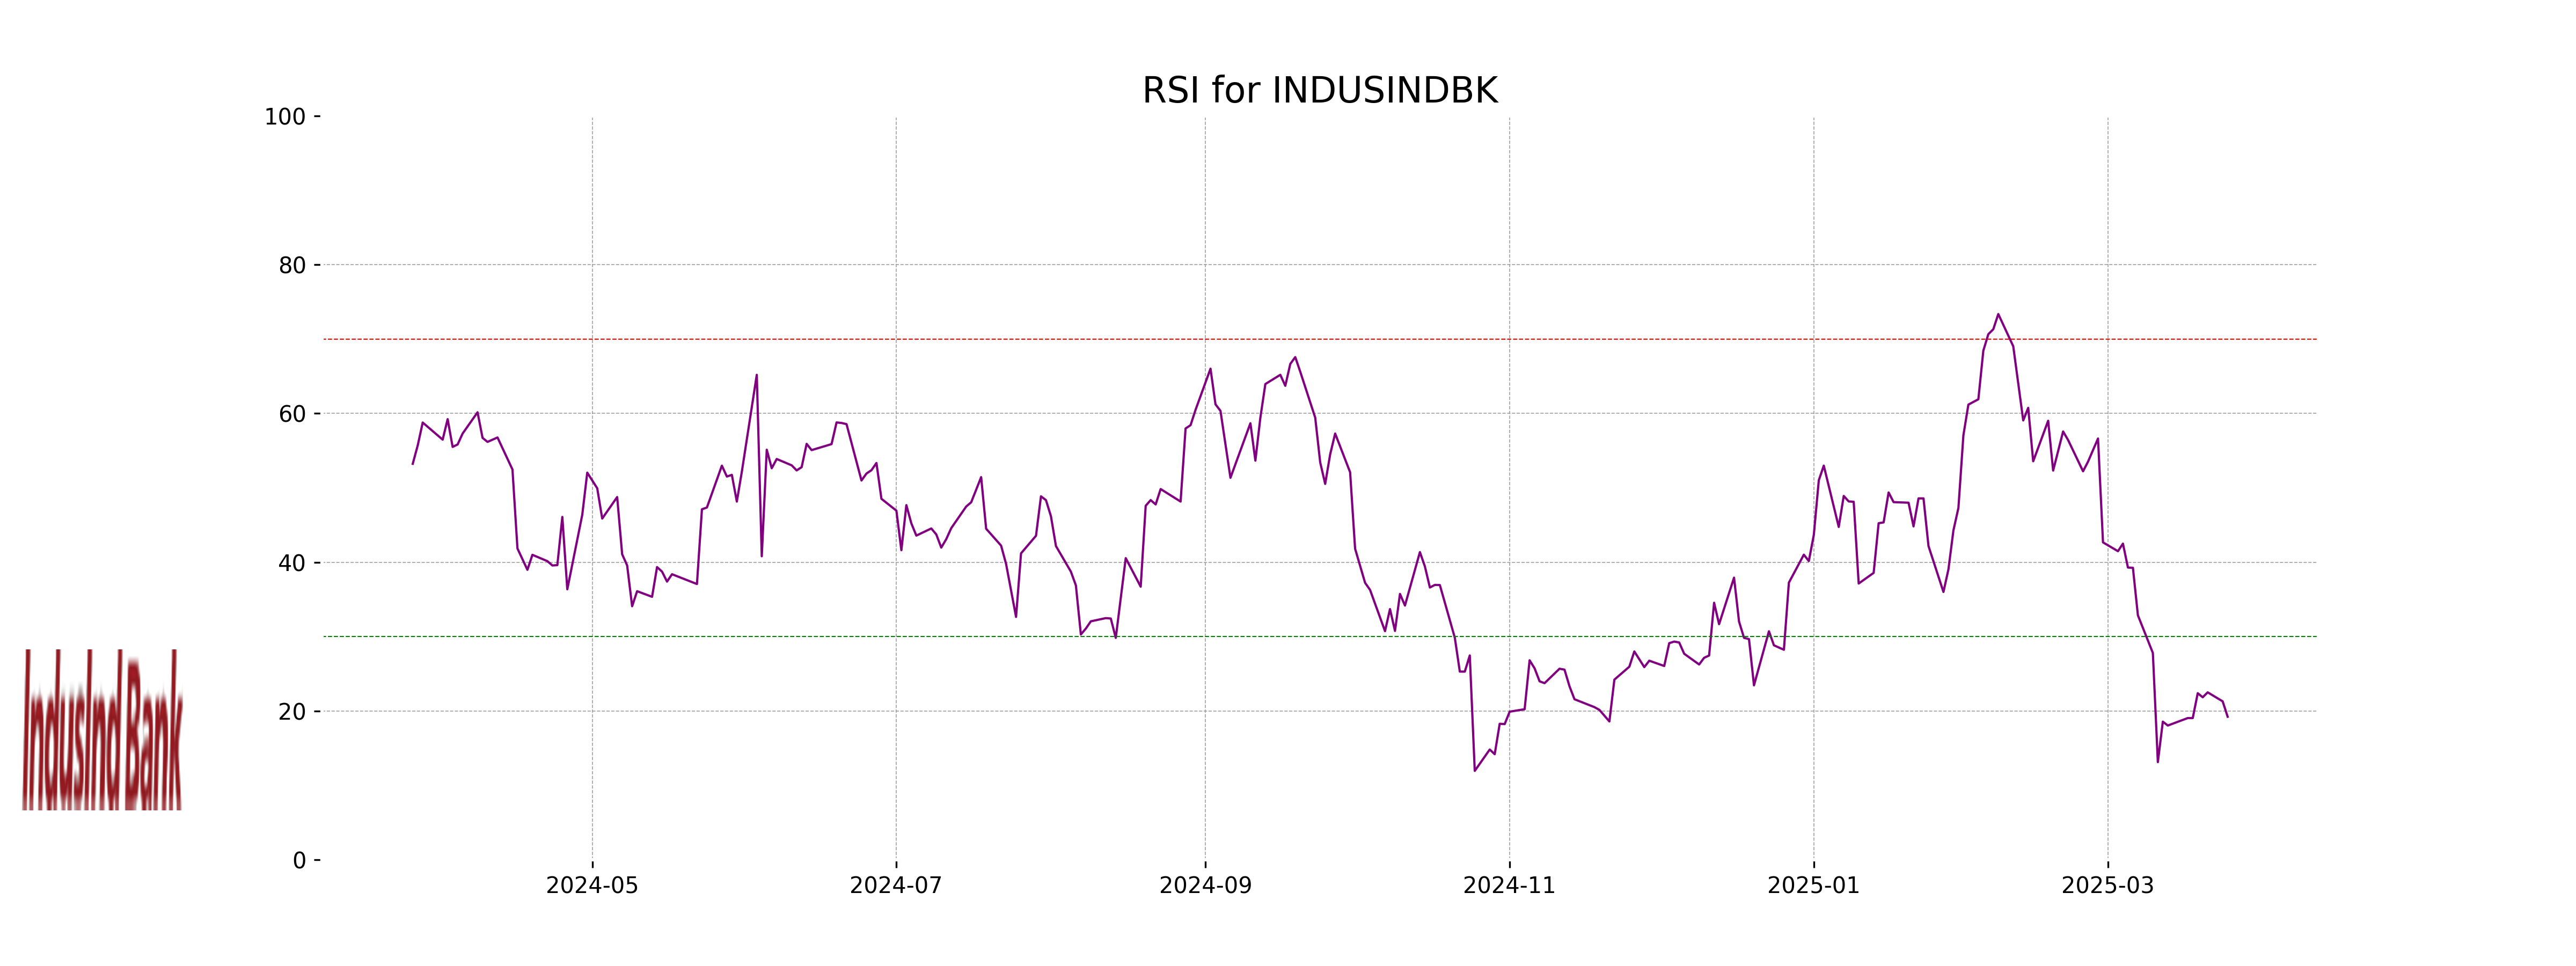
RSI Analysis
IndusInd Bank's RSI (Relative Strength Index) is at 19.23, which suggests that the stock is in the oversold territory. Typically, an RSI below 30 indicates that a stock is potentially undervalued or experiencing bearish momentum, suggesting possible opportunities for buyers if other indicators align.
Up Next

NSE Nifty 50: Top 5 stock losers of March 25, 2025

Indian stock market sector-wise performance today - March 26, 2025

Top 5 Nifty 50 gainers today – March 26, 2025: Biggest stock moves

NSE Nifty 50: Top 5 stock losers of March 26, 2025

Global stock market indices: How the world markets performed today - 25 March 2025

Indian stock market sector-wise performance today - March 25, 2025

More videos

Top 5 Nifty 50 gainers today – March 25, 2025: Biggest stock moves

Amid probe into Rs 100 crore Bribe-for-Jobs scandal, TCS names new hiring head

TCS hit by bribe-for-job scandal; 4 fired, 3 HR consulting firms blacklisted

Global stock market indices: How the world markets performed today - 21 March 2025

Indian stock market sector-wise performance today - March 21, 2025

Top 5 Nifty 50 gainers today – March 21, 2025: Biggest stock moves

NSE Nifty 50: Top 5 stock losers of March 21, 2025

Global stock market indices: How the world markets performed today - 20 March 2025

Indian stock market sector-wise performance today - March 20, 2025

Top 5 Nifty 50 gainers today – March 20, 2025: Biggest stock moves