


Highlights
- Bharti Airtel shows bullish trend with strong RSI
- HCL Technologies indicates mixed signals with MACD
- IndusInd Bank nears oversold zone with weak momentum
Latest news

Sunrisers Hyderabad aims for redemption against Delhi Capitals post-defeat to LSG

Watch the thrilling action film 'Deva', now streaming on Netflix

The Yemen War Plan Leak unveils U.S. strike strategies after a security breach

A 7.7-magnitude quake in Myanmar caused widespread destruction

KL Rahul returns to Delhi Capitals for the match against SRH

John Abraham humorously addresses the viral 'kiss' with Shah Rukh Khan from Pathaan

Nicholas Pooran's explosive performance in the 2025 IPL season positions him as a leading T20 player

Ashwin raises concerns over the lack of recognition for bowlers in IPL 2025
Top 5 Nifty 50 gainers today – March 26, 2025: Biggest stock moves


In this article, we will explore the technical indicators of some of the high-performing stocks on the Indian stock market, including BHARTIARTL, HCLTECH, HEROMOTOCO, INDUSINDBK, and TRENT.
By looking at these stocks through the lens of key technical factors, we aim to better understand their price movements, trends, and potential future performance.

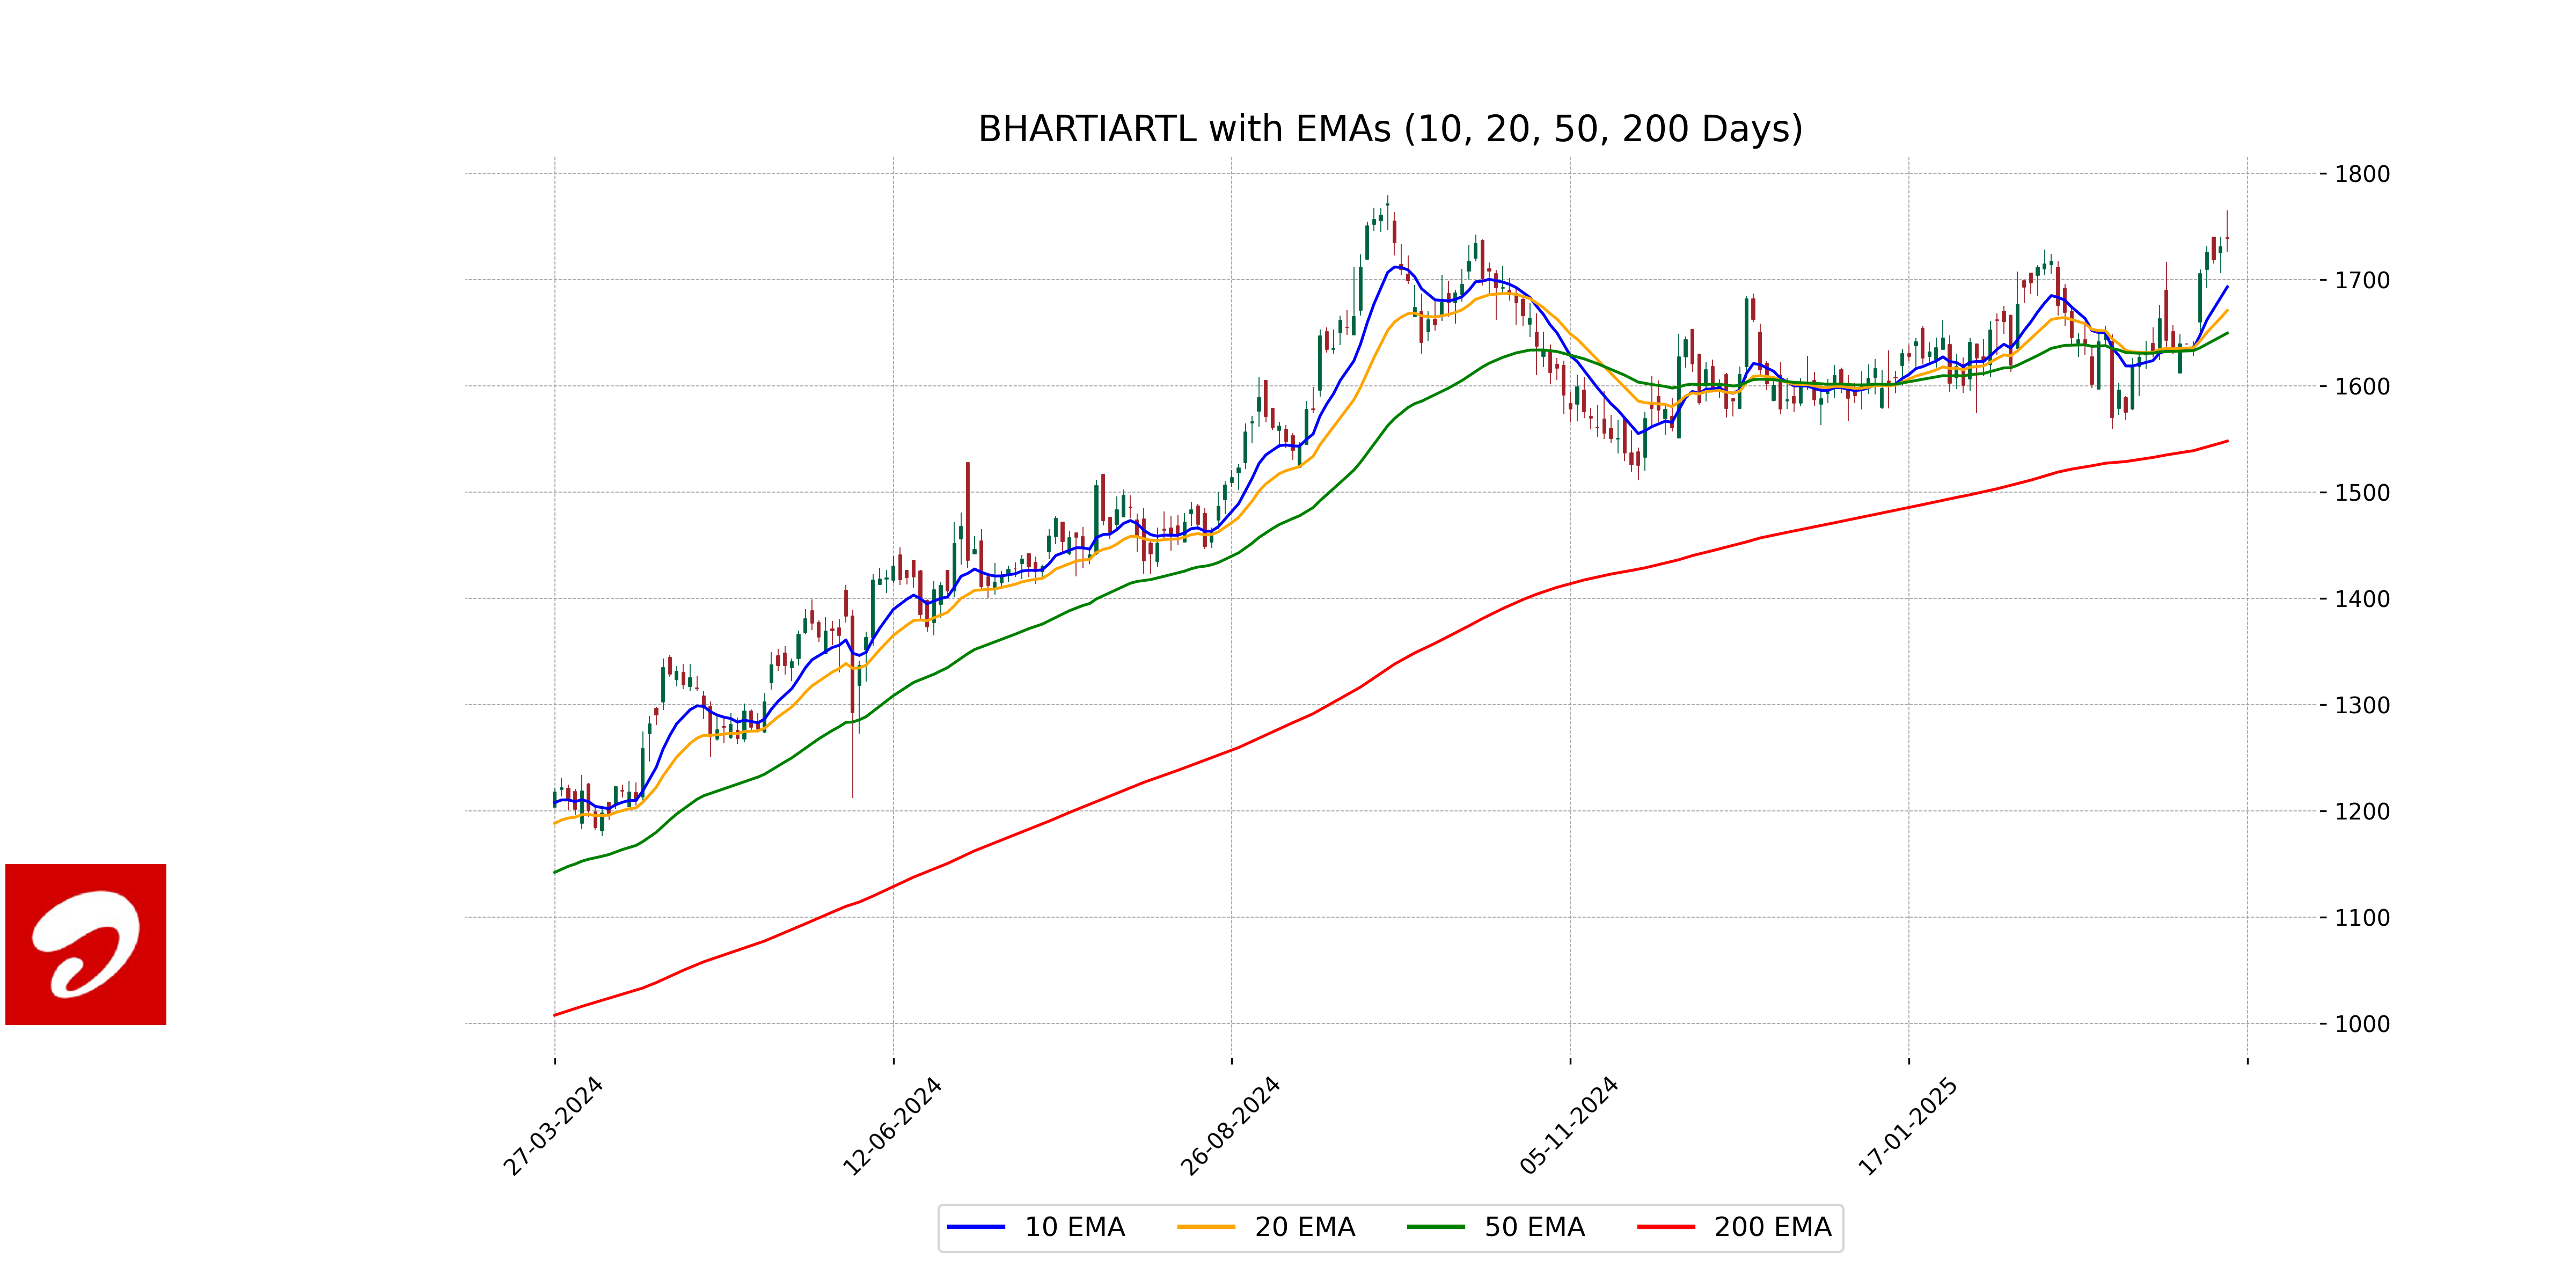
Analysis for Bharti Airtel - March 26, 2025

Bharti Airtel had a noteworthy performance with its closing price at 1738.55, witnessing a modest increase of approximately 0.47% from the previous close. The company's stock showed strong market interest, as evident from a trading volume of 7,142,106 shares. Positioned within the Communication Services sector in the Telecom Services industry, Bagging a market capitalization of over 10 trillion, the company continues to exhibit robust growth with a healthy PE ratio of 42.21 and an impressive EPS of 41.19.
Relationship with Key Moving Averages
Bharti Airtel's recent close of 1738.55 is above its 10 EMA of 1693.14, 20 EMA of 1670.99, 50 EMA of 1649.61, and 200 EMA of 1548.06. This suggests a short-term bullish momentum compared to its key moving averages.
Moving Averages Trend (MACD)
MACD Analysis for Bharti Airtel: The MACD for Bharti Airtel is greater than the MACD Signal (22.19 vs 9.94), indicating a bullish trend. This suggests potential upward momentum in the stock's price, supported by a strong RSI of 66.03.

RSI Analysis
The Relative Strength Index (RSI) for Bharti Airtel is 66.03, which indicates that the stock is nearing the overbought territory. Typically, an RSI above 70 suggests that a stock might be overvalued, potentially leading to a price correction. However, with an RSI of 66.03, Bharti Airtel is not yet in the overbought zone.

Analysis for HCL Technologies - March 26, 2025

HCL Technologies opened at 1624.90, reached a high of 1644.95, and closed at 1633.40, marking a 0.52% increase from the previous close. The company operates within the Information Technology Services industry in India and has a market cap of approximately 4.43 trillion INR. Key indicators include a PE ratio of 25.98 and an EPS of 62.88, with an RSI of 54.71, suggesting a moderate strength in the current momentum.

Relationship with Key Moving Averages
HCL Technologies closed at 1633.40, which is below its 50-day EMA of 1663.72 and its 200-day EMA of 1681.69, indicating a potential bearish trend in the context of these moving averages. However, it is trading above its 10-day EMA of 1588.73 and 20-day EMA of 1597.13, suggesting some short-term bullish momentum.
Moving Averages Trend (MACD)
HCL Technologies' MACD value of -22.58, which is above its MACD Signal of -38.53, suggests a potential upward momentum. This indicates that the stock price might experience a bullish movement in the near term. However, further confirmation from additional indicators is recommended for more confident trading decisions.

RSI Analysis
The Relative Strength Index (RSI) for HCL Technologies is 54.71, indicating a neutral position. An RSI value around this range suggests that the stock is neither overbought nor oversold. It is important to monitor the RSI for any significant shifts that could indicate changes in momentum.

Analysis for Hero MotoCorp - March 26, 2025

Hero MotoCorp's stock opened at 3650.0 and closed at 3645.95, marking a slight gain with a 0.50% change and an 18-point rise over the previous close. The stock's performance indicates a consistent trading range with some volatility, as seen from the day's high of 3669.30 and a low of 3605.40. The company operates in the Consumer Cyclical sector, specifically in the Auto Manufacturers industry in India, and has a market cap of 729.23 billion INR. The RSI of 45.48 suggests neutral momentum, while the MACD is negative but showing a narrowing gap with its signal line, indicating potential trend changes.

Relationship with Key Moving Averages
Hero MotoCorp is currently trading below its 50-day EMA of 3838.32 and 200-day EMA of 4337.07, indicating a potential bearish trend in the long term. However, it is trading above its 10-day EMA of 3611.00, suggesting a short-term upward momentum.
Moving Averages Trend (MACD)
MACD Analysis for Hero MotoCorp The MACD value of -74.02 indicates a bearish momentum as it is below the MACD Signal line of -97.18. This suggests potential downward pressure, though the gap narrowing could hint at a possible reversal if the trend continues.

RSI Analysis
Hero MotoCorp's RSI is at 45.48, indicating that the stock is currently in a neutral zone and neither overbought nor oversold. It suggests balanced momentum, with no immediate pressure for a reversal or continuation of the current trend.

Analysis for IndusInd Bank - March 26, 2025
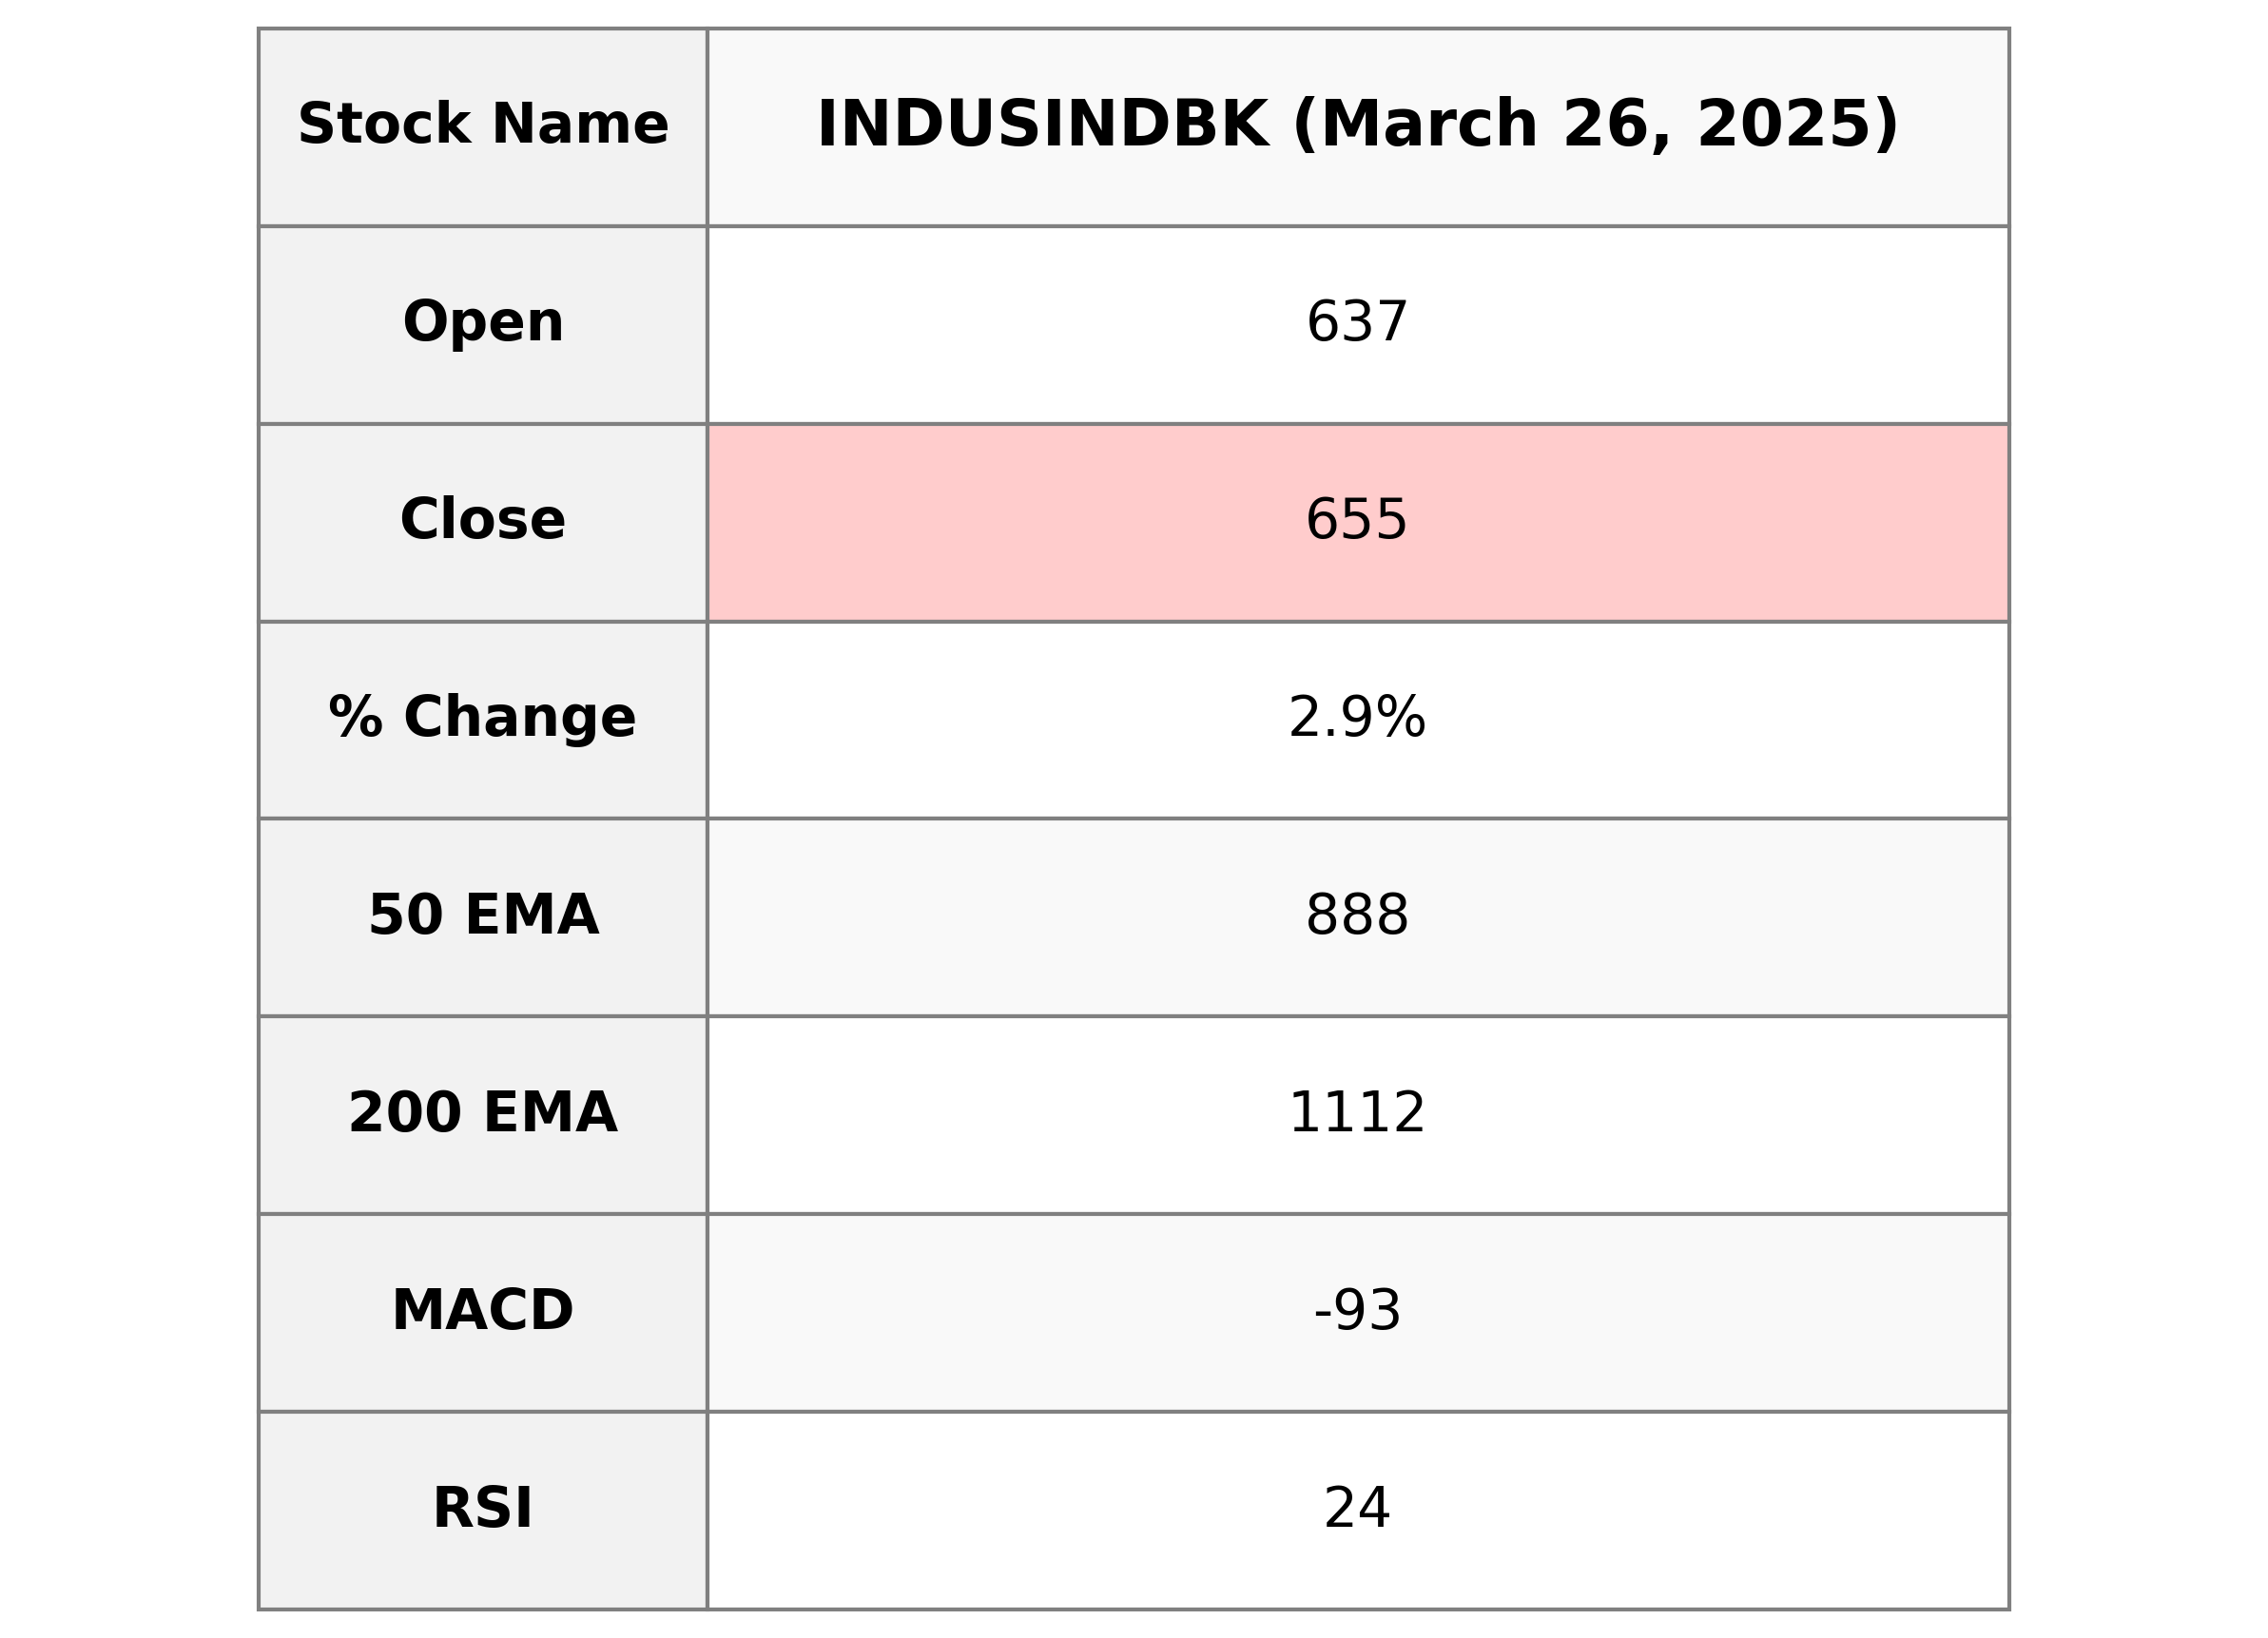
IndusInd Bank demonstrated a notable performance, with a close at 655.30, reflecting a 2.86% increase compared to the previous close. The bank's market cap is substantial at 510,514,102,272, operating within the Financial Services sector. However, the RSI indicates oversold conditions, and the MACD suggests a negative trend.

Relationship with Key Moving Averages
The closing price of IndusInd Bank at 655.30 is below its key moving averages, indicating a bearish trend: 10 EMA at 700.96, 20 EMA at 777.61, 50 EMA at 887.76, and 200 EMA at 1111.86. This suggests the stock is currently trading well below its recent average prices, possibly indicating weakness or a downtrend.
Moving Averages Trend (MACD)
The MACD for IndusInd Bank is noted at -92.81, with a signal line at -81.13. This indicates a negative trend as the MACD is below the signal line. Combined with the low RSI of 23.72, the stock is potentially oversold, suggesting a bearish sentiment in the market.

RSI Analysis
The RSI value for IndusInd Bank is 23.72, which indicates that the stock is currently in the oversold territory. Typically, an RSI below 30 suggests that the stock may be undervalued and could be due for a price correction or rebound.

Analysis for Trent - March 26, 2025
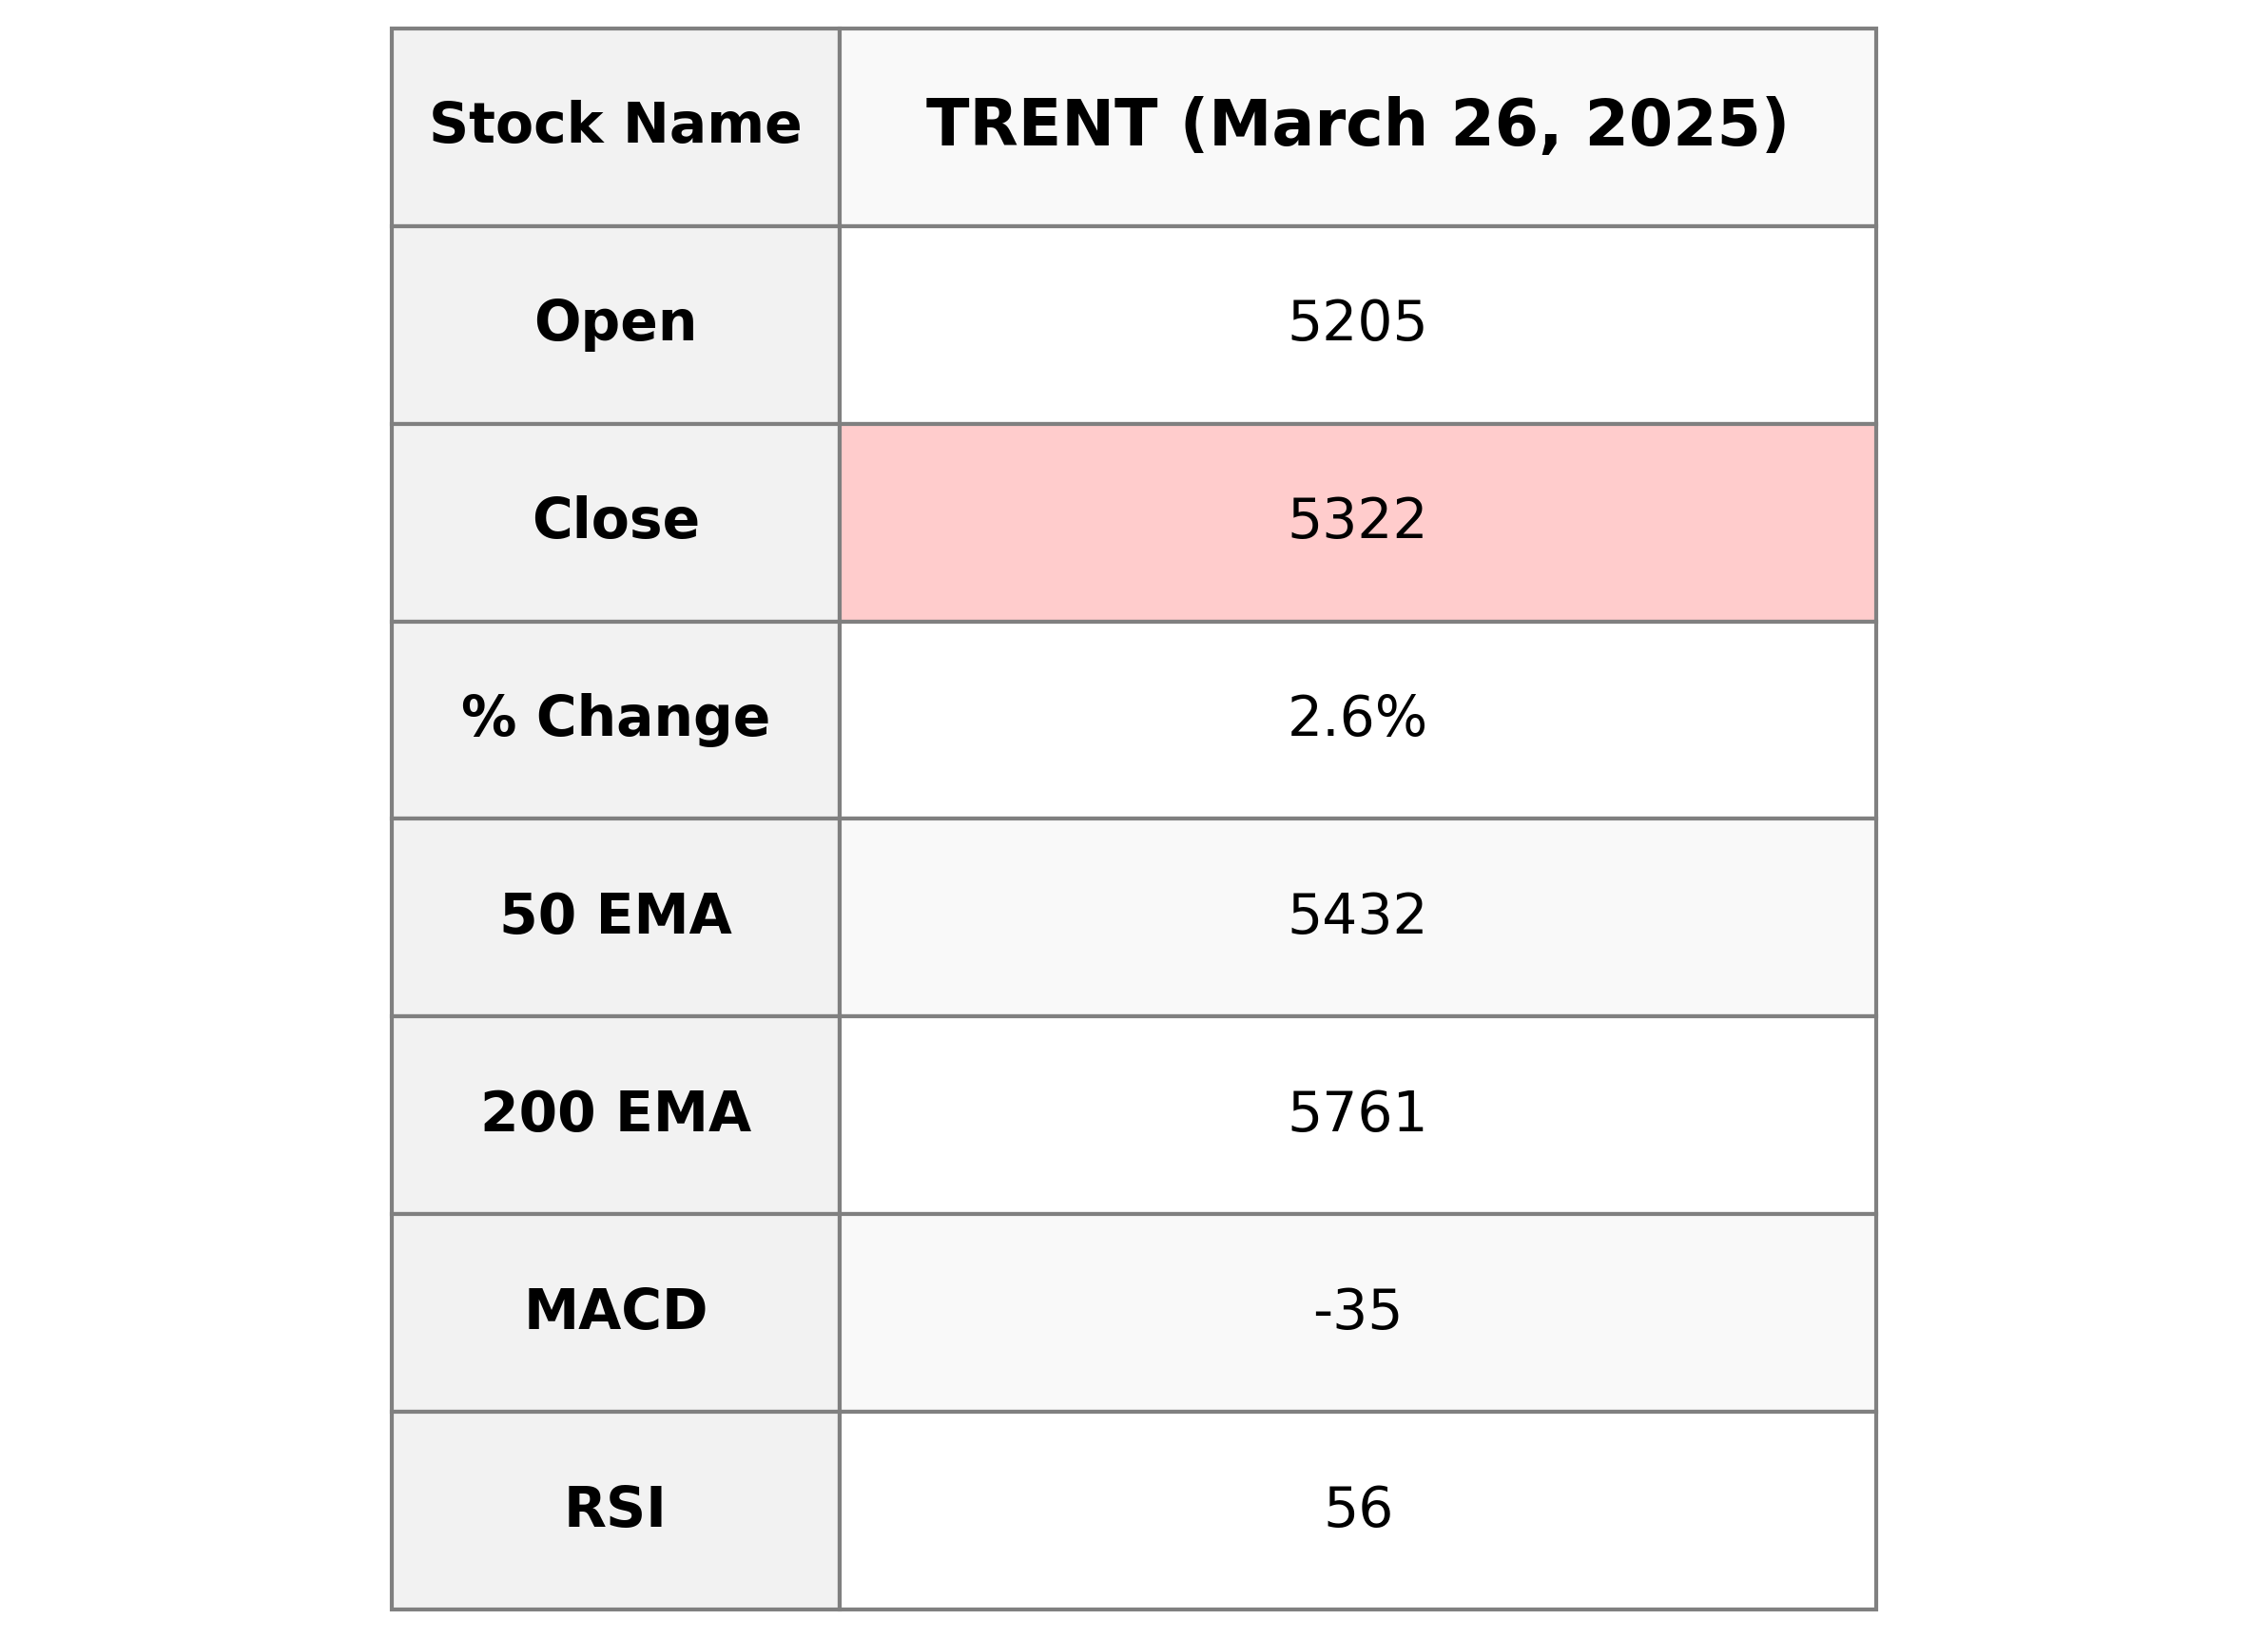
Trent, operating in the Consumer Cyclical sector within the Apparel Retail industry in India, has shown a positive performance with a closing price of 5321.95, marking a 2.64% increase from the previous close. Despite this uptick, the stock is trading below its 50 EMA and 200 EMA, suggesting some resistance in achieving higher momentum. The RSI stands at 55.51, indicating neither overbought nor oversold conditions, while a negative MACD highlights a bearish trend currently in place.

Relationship with Key Moving Averages
Trent closed at 5321.95, which is below its 50-day EMA of 5431.96 and significantly below its 200-day EMA of 5761.02, indicating a potential bearish trend despite being above the 10-day EMA of 5156.48 and 20-day EMA of 5144.97. The stock experienced a positive change of 136.90 points (2.64%) from the previous close.
Moving Averages Trend (MACD)
TRENT MACD Analysis: The MACD for Trent is calculated at -35.37, indicating a potential bearish trend as it is below the MACD Signal line of -92.40. This suggests the stock has recently been gaining momentum but still requires careful monitoring for further confirmation of a trend change.

RSI Analysis
The RSI value for Trent is 55.51, indicating a neutral market position that is leaning slightly towards a bullish trend. This suggests that the stock is neither overbought nor oversold at this time and might have potential for upward movement.

Up Next

Top 5 Nifty 50 gainers today – March 26, 2025: Biggest stock moves

Global stock market indices: How the world markets performed today - 28 March 2025

Indian stock market sector-wise performance today - March 28, 2025

NSE Nifty 50: Top 5 stock losers of March 28, 2025

Top 5 Nifty 50 gainers today – March 28, 2025: Biggest stock moves

Global stock market indices: How the world markets performed today - 27 March 2025

More videos

Indian stock market sector-wise performance today - March 27, 2025

NSE Nifty 50: Top 5 stock losers of March 27, 2025

Top 5 Nifty 50 gainers today – March 27, 2025: Biggest stock moves

Global stock market indices: How the world markets performed today - 26 March 2025

Indian stock market sector-wise performance today - March 26, 2025

NSE Nifty 50: Top 5 stock losers of March 26, 2025

Global stock market indices: How the world markets performed today - 25 March 2025

Indian stock market sector-wise performance today - March 25, 2025

Top 5 Nifty 50 gainers today – March 25, 2025: Biggest stock moves

NSE Nifty 50: Top 5 stock losers of March 25, 2025