


Highlights
- Nifty IT up by 0.57%, reflecting sector recovery
- Nifty Auto down by 1.04%, indicating market caution
- Nifty Energy rises 1.44% amid strong sector performance
Latest news

Global stock market indices: How the world markets performed today - 31 March 2025

Indian stock market sector-wise performance today - March 31, 2025

NSE Nifty 50: Top 5 stock losers of March 31, 2025

Top 5 Nifty 50 gainers today – March 31, 2025: Biggest stock moves

IPL 2025: Rajasthan Royals captain Riyan Parag fined for slow over-rate against CSK

Eid strengthens social unity, fosters spirit of brotherhood: Yogi Adityanath

U.P. Rozgar Mission: Empowering Global Job Aspirants

IRCTC to set up Rail Neer bottled water plant in Prayagraj
Indian stock market sector-wise performance today - March 27, 2025


The stock market on Thursday (March 27, 2025) demonstrated a nuanced performance across various sectors and indices, with both gains and declines observed.
Starting with the Sensex, a prominent benchmark in the stock market, it managed to ascend by 0.41%, closing at 77,606.43. This increase of 317.93 points was bolstered by positive investor sentiment.
In contrast, the Nifty Auto experienced the most significant decline, falling by -1.04% to close at 21,516.75. This sector faced challenges due to concerns over potential disruptions in supply chains, leading to cautious investments.
The Nifty Energy sector, however, had a strong showing with a rise of 1.44%, closing at 33,682.95. This was largely driven by increased demand for energy resources and favorable market dynamics in the global oil markets, boosting investor confidence.
Meanwhile, the Nifty FMCG saw an increase of 0.54%, closing at 53,276.60. The sector benefitted from stable consumer demand and optimistic growth projections.
The Nifty Infrastructure also posted a gain, rising by 0.63%, ending the day at 8,481.90. This was attributed to government initiatives and infrastructure investments driving investor interest.
The Nifty IT recorded a modest increase of 0.57%, settling at 37,548.30. The sector's climb was supported by a consistent demand for technology services and positive earnings reports.
Nifty Metal enjoyed a modest gain of 0.68%, closing at 9,159.80, as the demand for metals remained strong due to industrial activities picking up.
The Bank Nifty also witnessed a notable increase of 0.72%, finishing at 51,575.85. The robust performance was driven by strong earnings reports from major banks and an optimistic economic outlook.
Finally, the Nifty itself rose by 0.45%, reaching 23,591.95 as confidence across various sectors buoyed the broader market. In sum, the divergent performance across sectors underscores the dynamic nature of the stock market, with energy leading the gains due to favorable external factors, while the auto sector lagged due to persistent uncertainties.
The overall market sentiment remained positive with several indices securing gains amidst selective sectoral headwinds.

Analysis for Sensex - March 27, 2025

Sensex Performance The Sensex opened at 77,087.39 and closed at 77,606.43, experiencing a positive change of approximately 0.41% or 317.93 points. The market showed a higher level of activity as indicated by the 65.02 RSI, and the MACD at 510.77, suggesting bullish momentum during the trading session.

Relationship with Key Moving Averages
The Sensex closed at 77,606.43, which is above the 50-day EMA of 76,221.34 and the 10-day EMA of 76,586.62, indicating a short-term upward trend. It is also slightly above the 200-day EMA of 77,172.67, suggesting a bullish market sentiment.
Moving Averages Trend (MACD)
The MACD value for Sensex is significantly higher than the MACD Signal, indicating a strong bullish trend. With an RSI of 65.02, it suggests positive momentum, although nearing overbought conditions. Investors should watch for any divergence or changes in the trend.

RSI Analysis
The RSI for Sensex is currently at 65.02, indicating that the index is approaching overbought levels, but it's not quite there yet. Typically, an RSI above 70 suggests overbought conditions, while one below 30 indicates oversold conditions. Monitoring is advised to watch for potential reversal signals if RSI trends toward 70.

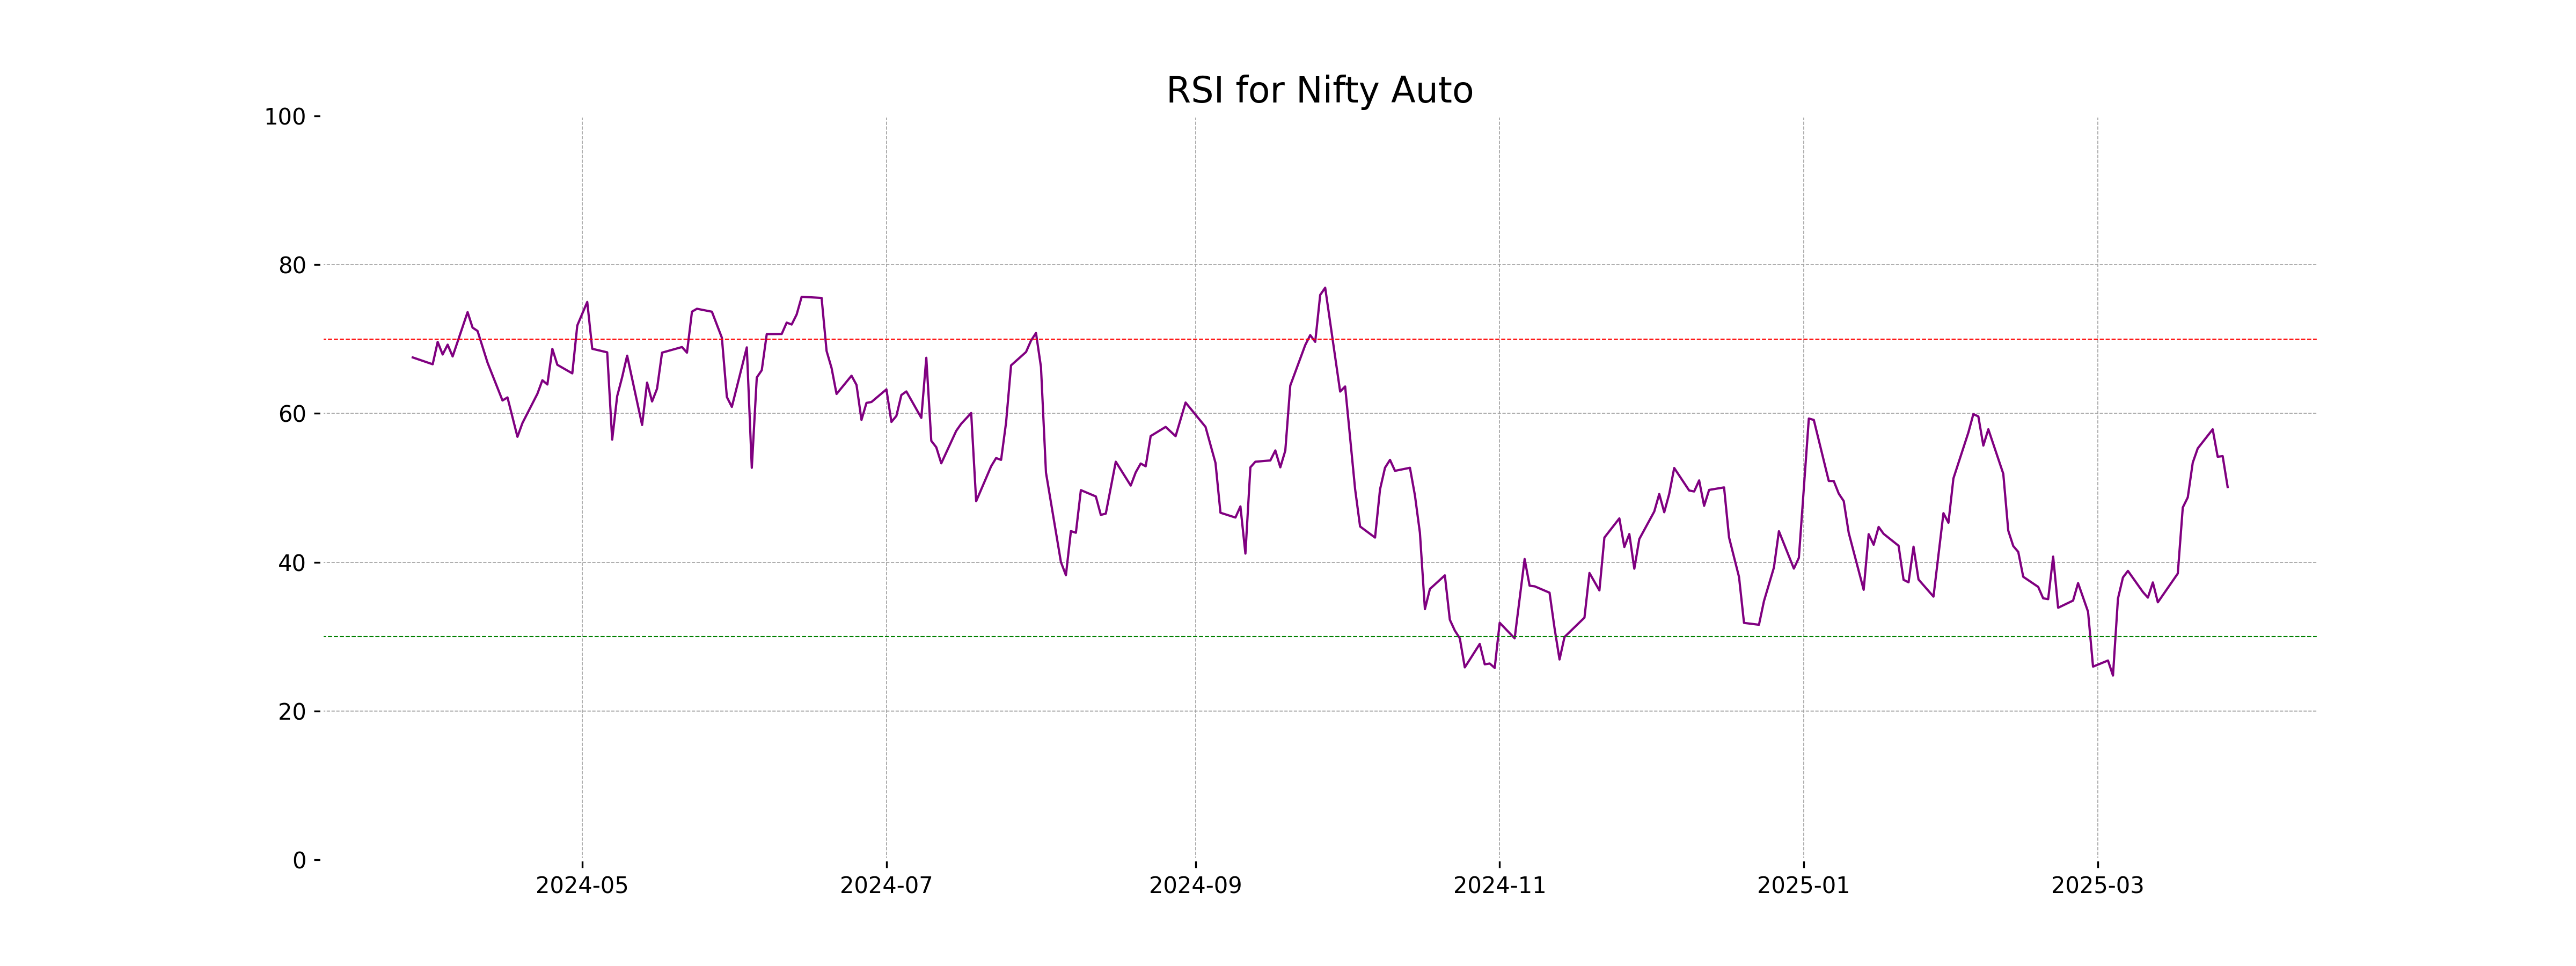
Analysis for Nifty Auto - March 27, 2025

The Nifty Auto index opened at 21445.65 and closed at 21516.75, marking a decline of 1.04% with a points change of -226.05 from the previous close of 21742.80. The RSI stands at 50.11, indicating a neutral momentum. The MACD value of -47.16 suggests a bearish trend compared to the MACD Signal. The index is below both its 50 EMA and 200 EMA, highlighting downward pressure in the short to long term.

Relationship with Key Moving Averages
The Nifty Auto index closed at 21516.75, which is below its 50 EMA of 21882.43 and 200 EMA of 22764.52, indicating a bearish trend compared to these key moving averages. It is slightly above its 10 EMA of 21486.13 and 20 EMA of 21435.02, suggesting a short-term upward correction. The RSI is neutral at 50.11.
Moving Averages Trend (MACD)
Based on the data provided, the MACD for Nifty Auto is -47.16, which is higher than the MACD Signal of -199.64. This suggests a potential shift towards bullish momentum, as the MACD line is moving closer to crossing the signal line from below. However, since both values are negative, it indicates the index is still in bearish territory.

RSI Analysis
The Relative Strength Index (RSI) for Nifty Auto stands at 50.11. This indicates a neutral position in terms of momentum, suggesting neither overbought nor oversold conditions in the market. Investors may consider additional technical indicators for further insights.
Analysis for Nifty Energy - March 27, 2025

Nifty Energy Performance The Nifty Energy index opened at 33,130.75, reached a high of 33,778.90, and closed at 33,682.95, marking a 1.44% increase from the previous close of 33,205.40. With a strong RSI of 63.08 and a bullish MACD of 442.09, the index shows positive momentum. However, its 200 EMA of 35,911.03 suggests it’s trading below the long-term average, indicating potential resistance in a broader context.

Relationship with Key Moving Averages
Nifty Energy's closing price of 33,682.95 is above the 50-day EMA of 32,791.02 and the 200-day EMA of 35,911.03, indicating a short-term positive trend against the longer-term average. It is also above the 10-day and 20-day EMAs, suggesting recent bullish momentum in relation to its recent averages.
Moving Averages Trend (MACD)
The MACD for Nifty Energy is currently at 442.09 with a MACD Signal of 155.52, suggesting a bullish momentum as the MACD is above the Signal line. This indicates potential upward price movement for the index. Keep monitoring for any changes in the trend.

RSI Analysis
The RSI for Nifty Energy stands at 63.08, which suggests that the stock is in a relatively strong position, nearing overbought territory but not yet at critical levels. Values above 70 typically indicate overbought conditions, implying that the current performance is optimistic, but investors should monitor for any signs of reversal.

Analysis for Nifty FMCG - March 27, 2025

Nifty FMCG opened at 53002.55 and closed at 53276.60, showing a percentage change of 0.54% from its previous close of 52988.50. The index saw a high of 53475.05 and a low of 52649.20, with no volume reported. The Relative Strength Index (RSI) is 56.15, indicating a moderately strong momentum, while the Moving Average Convergence Divergence (MACD) is at -69.24, suggesting a weak bearish trend.

Relationship with Key Moving Averages
The Nifty FMCG closed at 53,276.60, which is below its 50 EMA of 53,609.83 and its 200 EMA of 56,271.55, indicating a potential short-term bearish trend. However, it is above its 10 EMA of 52,777.42 and its 20 EMA of 52,658.49, suggesting some short-term bullish momentum.
Moving Averages Trend (MACD)
The MACD for Nifty FMCG is -69.24, which is above its signal line of -354.35, suggesting a bullish trend as the MACD line is crossing above the signal line. However, the MACD is still in negative territory, indicating the overall momentum remains somewhat bearish but is showing signs of potential positive change.

RSI Analysis
The Relative Strength Index (RSI) for Nifty FMCG stands at 56.15, suggesting a neutral to slightly bullish momentum. Generally, an RSI above 50 indicates that the asset is gaining strength. It is neither in the overbought nor oversold region, implying stability in current market conditions.

Analysis for Nifty Infra - March 27, 2025

Nifty Infra opened at 8422.45 and closed at 8481.90, marking a percentage change of 0.63% with an increase of 53.35 points. The RSI stands at 67.95, indicating a near overbought situation. The MACD is at 111.28, well above the signal line of 43.14, suggesting a bullish trend.
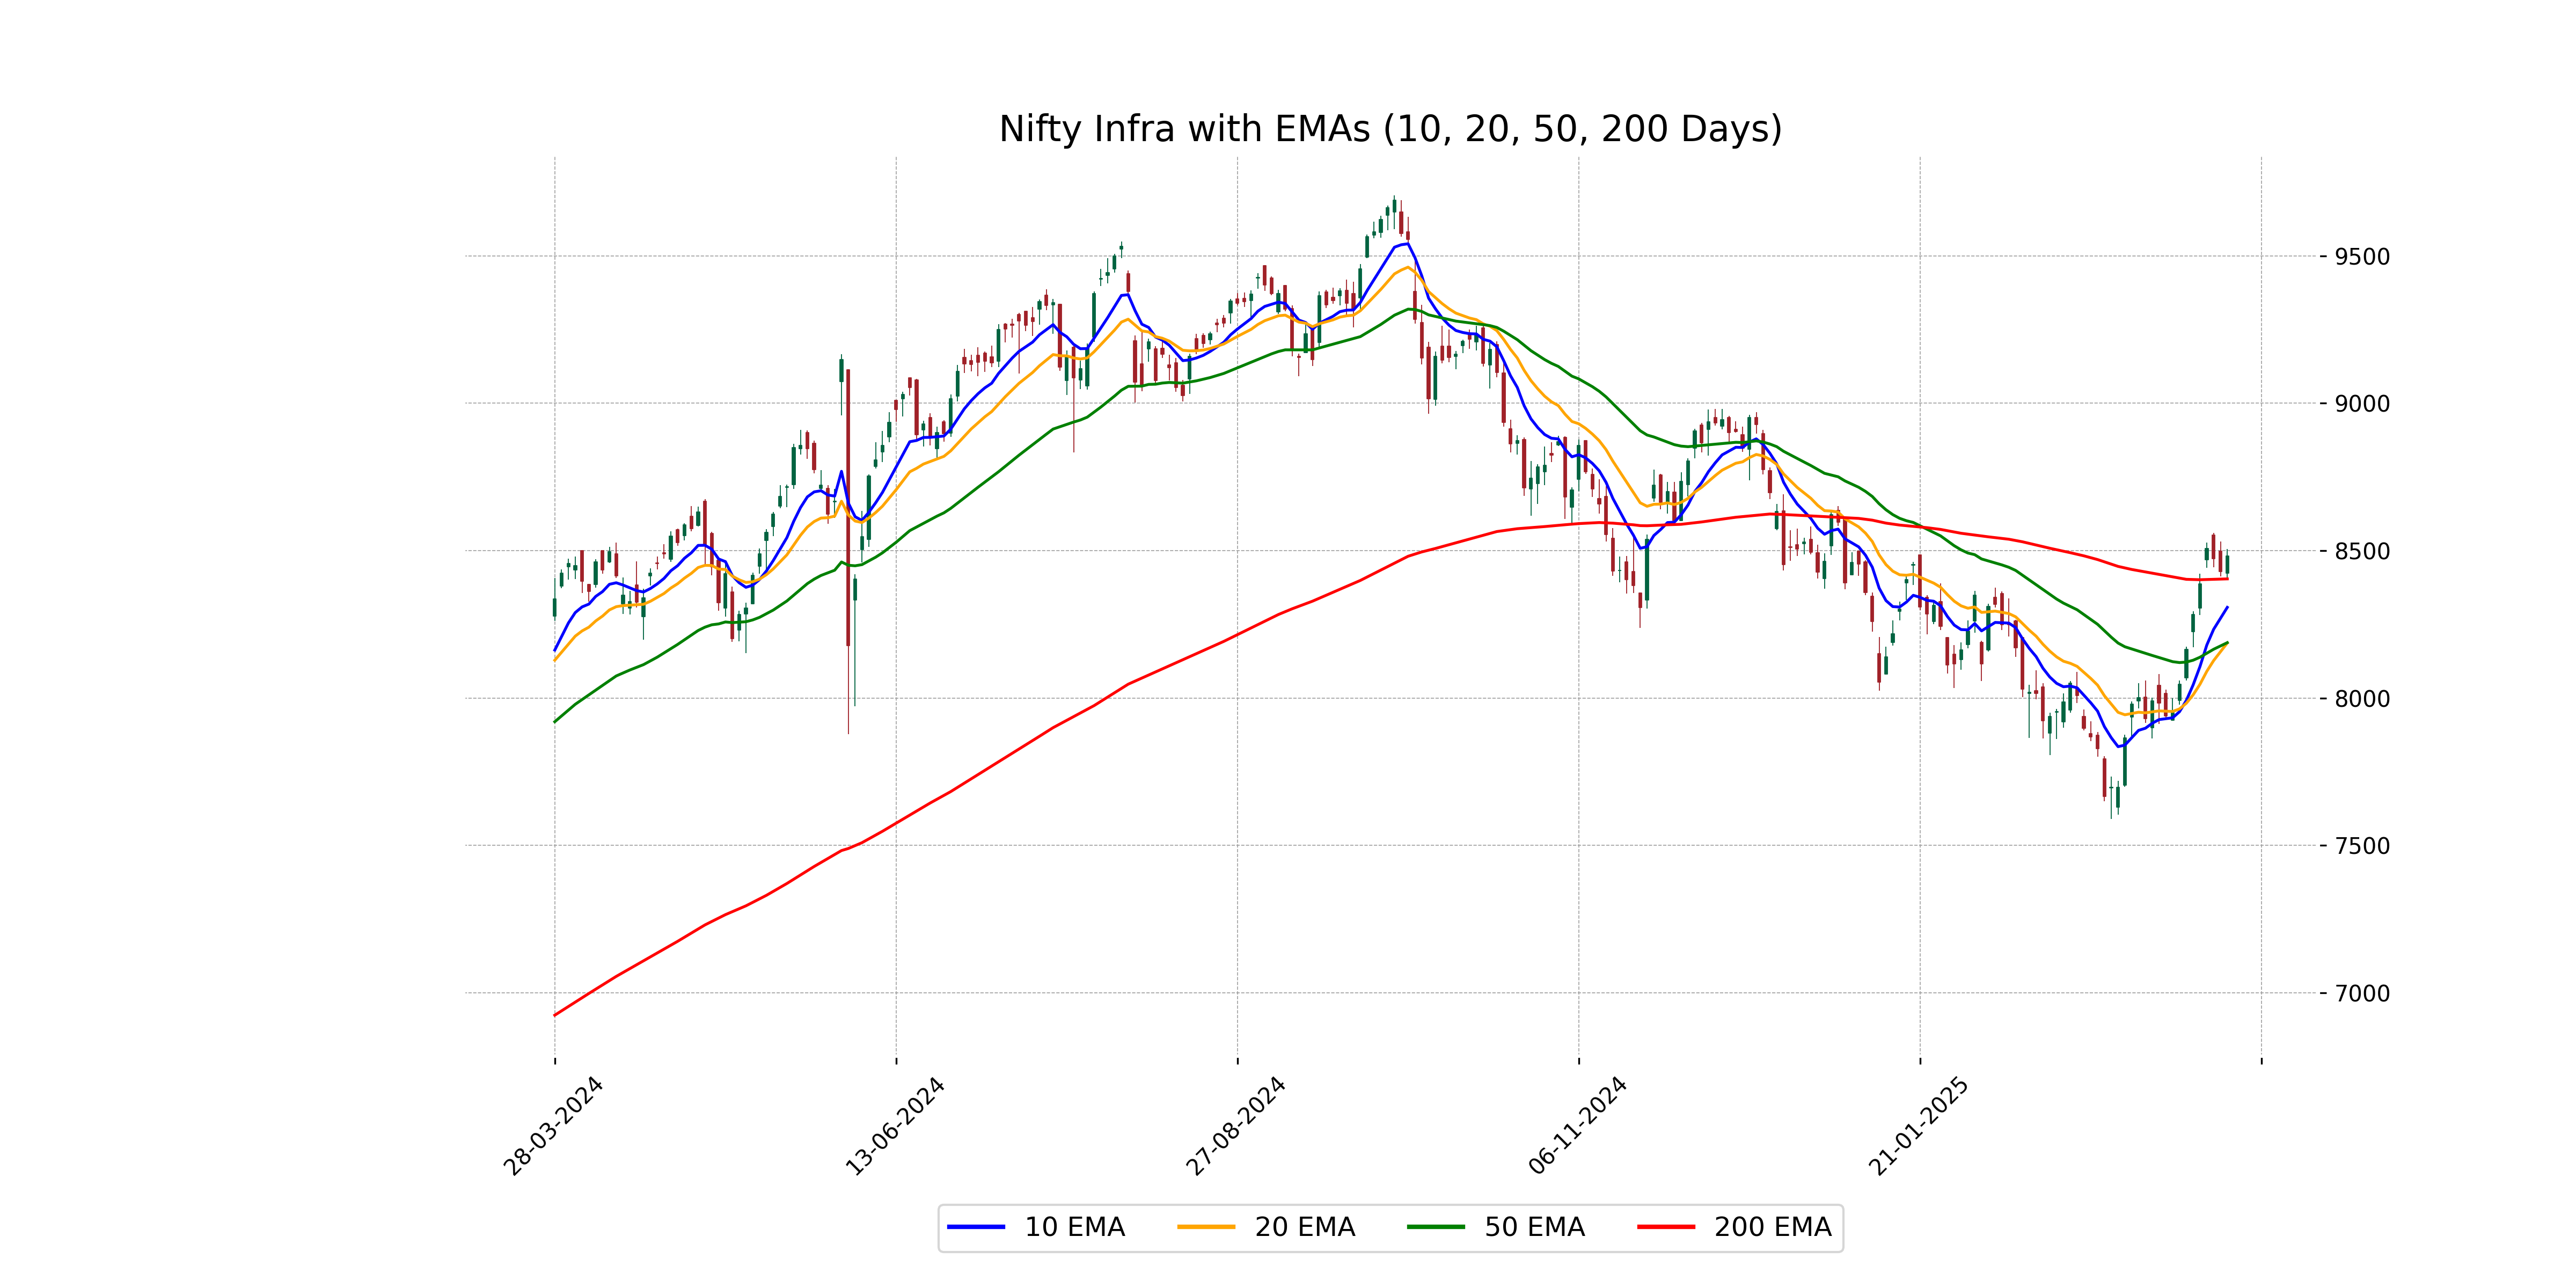
Relationship with Key Moving Averages
The closing price of Nifty Infra is 8481.90, which is above the 50 EMA (8187.56), 200 EMA (8403.89), 10 EMA (8307.28), and 20 EMA (8186.61), indicating a strong upward trend relative to these moving averages. The positive MACD further supports bullish momentum.
Moving Averages Trend (MACD)
The MACD for Nifty Infra stands at 111.28, which is significantly above the MACD Signal of 43.14. This suggests a bullish momentum, indicating potential continued upward movement in the short term.

RSI Analysis
Based on the provided data, the Nifty Infra RSI is 67.95, which is generally considered to be approaching the overbought territory. While an RSI above 70 typically indicates overbought conditions, a level close to 68 suggests the stock is demonstrating strong recent momentum, and investors may watch for potential trend reversals.

Analysis for Nifty IT - March 27, 2025

Nifty IT opened at 37,168.15, with a high of 37,627.60, and closed at 37,548.30. It saw a positive percentage change of 0.57% from the previous close, gaining 211.60 points. The RSI stands at 43.80, indicating moderate weakness, while the MACD reflects a negative trend with its value below the signal line.

Relationship with Key Moving Averages
Nifty IT is currently trading below its 50 EMA and 200 EMA, indicating a potential bearish trend. However, it is trading above the 10 EMA but below the 20 EMA, suggesting short-term volatility with limited upward momentum.
Moving Averages Trend (MACD)
Based on the provided data, Nifty IT has a MACD of -849.99, which is above the MACD Signal of -1117.03. This suggests a potential bullish crossover, indicating a potential shift towards upward momentum, but the overall MACD value remains negative, suggesting caution.

RSI Analysis
The RSI for Nifty IT stands at 43.80, indicating a neutral trend, as values above 70 typically suggest overbought conditions and values below 30 indicate oversold territory. This suggests that the index is neither overbought nor oversold at the current levels, providing room for directional movement based on future market catalysts.

Analysis for Nifty Metal - March 27, 2025

Nifty Metal opened at 9066.85 and closed at 9159.80, with a high of 9178.70 and a low of 9057.10. The index saw a percentage change of 0.68% and a points change of 62.10. Technical indicators reflect a relative strength index (RSI) of 62.63, suggesting moderate bullish momentum, while the MACD of 190.75 shows a positive signal compared to its MACD Signal line of 170.93.

Relationship with Key Moving Averages
Nifty Metal closed at 9159.80, which is above both its 50 EMA of 8749.13 and 10 EMA of 9077.06, indicating a short-term bullish trend. It is also positioned above the 200 EMA of 8818.41, suggesting a longer-term bullish outlook.
Moving Averages Trend (MACD)
The MACD value for Nifty Metal is 190.75, which is above the MACD Signal value of 170.93, indicating a bullish trend. This suggests that momentum is currently in favor of the bulls, as indicated by the upward direction of the MACD line crossing above the signal line.

RSI Analysis
The RSI for Nifty Metal is 62.63, suggesting a moderate level of strength. An RSI above 50 often indicates bullish momentum, which aligns with the recent positive price movement. However, it is important to monitor for any signs of overbought conditions as RSI approaches higher levels, such as above 70.

Analysis for Nifty Bank - March 27, 2025

The Nifty Bank index opened at 51,084.70 and closed at 51,575.85, registering a positive change of 0.72%. The index showed strength by rising 366.85 points from the previous close of 51,209. The RSI stands at 69.96, indicating that the market is approaching overbought conditions.

Relationship with Key Moving Averages
Nifty Bank closed at 51575.85, which is above its 10 EMA of 50497.70, 20 EMA of 49850.41, 50 EMA of 49669.11, and 200 EMA of 49970.51, indicating a strong bullish trend. The positive % Change of 0.716% and a Points Change of 366.85 further support this upward momentum.
Moving Averages Trend (MACD)
Nifty Bank's MACD value of 608.36 is significantly higher than the MACD Signal of 230.21, indicating bullish momentum. This separation suggests the possibility of continued upward movement in the market.

RSI Analysis
The RSI (Relative Strength Index) for Nifty Bank is 69.96, indicating that the stock is approaching the overbought threshold. This suggests potential caution for investors as the stock could be nearing an overbought condition, which might precede a price correction.

Analysis for Nifty 50 - March 27, 2025

Nifty 50 Performance Description: The Nifty 50 opened at 23,433.95 and closed at 23,591.95, marking a positive change of 0.45% with an increase of 105.10 points from the previous close of 23,486.85. The highest and lowest points during the trading session were 23,646.45 and 23,412.20, respectively. The Relative Strength Index (RSI) indicates a value of 66.72, suggesting a strong market momentum.

Relationship with Key Moving Averages
The Nifty 50 index is trading above key moving averages, including the 50 EMA at 23,099.49 and the 200 EMA at 23,409.67, indicating a bullish trend. It is also above the 10 EMA at 23,250.42 and the 20 EMA at 23,038.07, reinforcing short-term positive momentum.
Moving Averages Trend (MACD)
Nifty 50 MACD Analysis: The MACD for Nifty 50 is significantly above its signal line with a value of 177.31 compared to the signal line at 28.42, indicating bullish momentum. The positive divergence suggests that the upward trend is likely to continue in the near term.

RSI Analysis
The RSI (Relative Strength Index) for Nifty 50 is 66.72, which suggests that the index is approaching the overbought territory. This can indicate that the stock is gaining strength, but investors should be cautious of a potential pullback if the RSI moves above 70.

Up Next

Indian stock market sector-wise performance today - March 27, 2025
Indian stock market sector-wise performance today - March 31, 2025
NSE Nifty 50: Top 5 stock losers of March 31, 2025
Top 5 Nifty 50 gainers today – March 31, 2025: Biggest stock moves

Global stock market indices: How the world markets performed today - 28 March 2025

Indian stock market sector-wise performance today - March 28, 2025

More videos

NSE Nifty 50: Top 5 stock losers of March 28, 2025

Top 5 Nifty 50 gainers today – March 28, 2025: Biggest stock moves

Global stock market indices: How the world markets performed today - 27 March 2025

NSE Nifty 50: Top 5 stock losers of March 27, 2025

Top 5 Nifty 50 gainers today – March 27, 2025: Biggest stock moves

Global stock market indices: How the world markets performed today - 26 March 2025

Indian stock market sector-wise performance today - March 26, 2025

Top 5 Nifty 50 gainers today – March 26, 2025: Biggest stock moves

NSE Nifty 50: Top 5 stock losers of March 26, 2025

Global stock market indices: How the world markets performed today - 25 March 2025