


Highlights
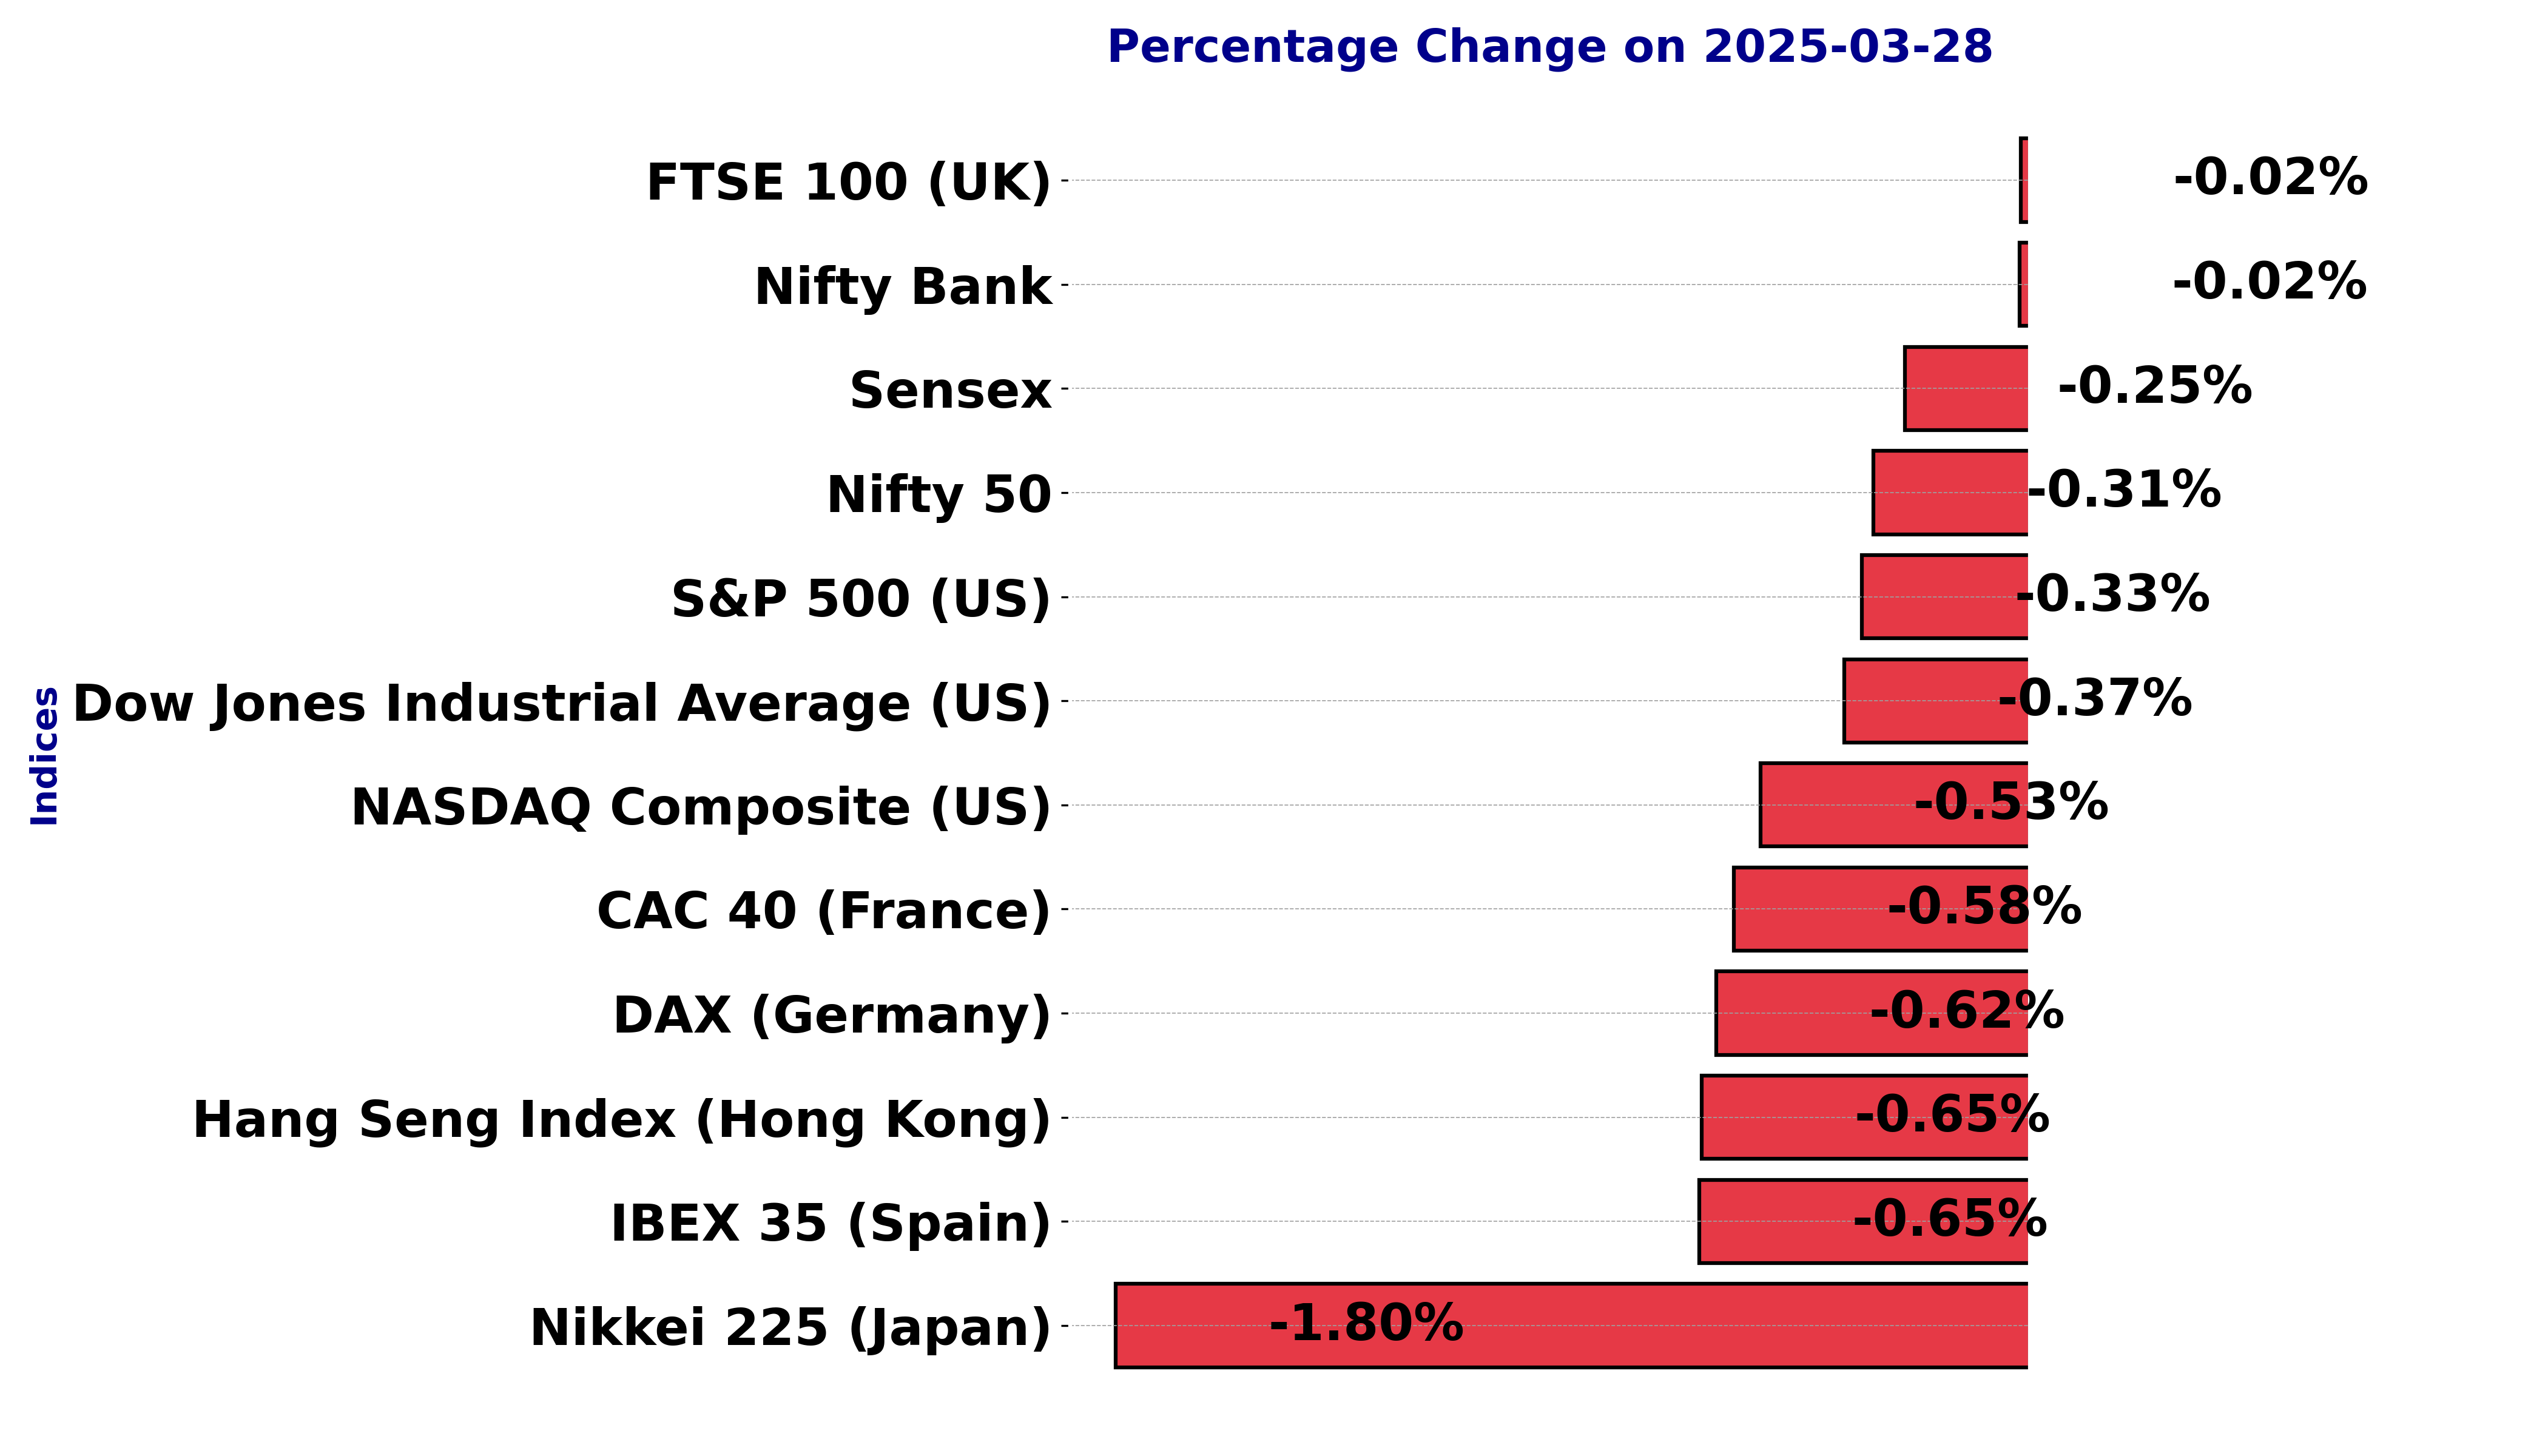
- Dow Jones declined 0.37%, closing at 42,299.70
- Nikkei 225 dropped 1.80%, closing at 37,120.33
- NASDAQ Composite fell 0.53%, closing at 17,804.03
Latest news

Samsung Galaxy M17 5G Review: Best Budget Samsung Phone Under ₹15,000?

OnePlus 15R first look: OnePlus changes the R-series playbook

India's retail inflation rises to 0.71% in November

Cabinet approves CoalSETU window for auction of coal to boost industrial use and export

Cabinet approves Minimum Support Price for Copra for 2026 season

Fire never left: Vinesh Phogat comes out of retirement, targets LA Olympics

Flexible office segment in India set to grow faster, over 25% annually by 2027: Report

Rahul Gandhi flags issue of air pollution, seeks discussion in Lok Sabha
Global stock market indices: How the world markets performed today - 28 March 2025


The international stock market indices showed varied performances on March 28, 2025, reflecting the economic sentiment across different regions.
In this article, we analyze the performance of key global indices including the S&P 500, Dow Jones Industrial Average, NASDAQ Composite, FTSE 100, DAX, CAC 40, IBEX 35, Nikkei 225, Hang Seng, Nifty 50, and BSE Sensex.
Analysis for Sensex - March 28, 2025

The BSESN experienced a slight decline with a closing at 77,414.92, dropping by 191.51 points or a percentage change of -0.25% compared to the previous close. The intraday price movement saw a high of 77,766.70 and a low of 77,185.62. The Relative Strength Index (RSI) indicates a moderately strong trend with a value of 62.94, while the Moving Average Convergence Divergence (MACD) shows a positive momentum at 555.44, higher than its signal line.

Relationship with Key Moving Averages
Sensex closed at 77,414.92, slightly below its 200-EMA of 77,175.37 but above the 50-EMA of 76,268.15. The close is also higher than both the 10-EMA of 76,737.22 and the 20-EMA of 76,087.89, indicating a position above short-term moving averages.
Moving Averages Trend (MACD)
The MACD value for Sensex is significantly higher than the MACD Signal, indicating a bullish trend. The positive MACD suggests that upward momentum is prevailing. However, investors should consider other technical indicators like RSI and recent EMA values for a comprehensive analysis.

RSI Analysis
The Relative Strength Index (RSI) of Sensex is 62.94, indicating that it is approaching the overbought territory, but not at extreme levels yet. Generally, an RSI above 70 suggests an asset may be overbought, while below 30 indicates it may be oversold. Hence, Sensex's RSI suggests a moderately bullish sentiment in the market currently.

Analysis for Dow Jones Industrial Average (US) - March 28, 2025

The Dow Jones Industrial Average (US) reported a slight decrease, closing at 42,299.70, reflecting a -0.37% change from the previous day’s close of 42,454.79. The day's trading saw the index reach a high of 42,523.84 and a low of 42,142.19, with a volume of 484.54 million. Despite a MACD of -310.96, indicating bearish momentum, the RSI at 46.57 suggests the index is nearing an oversold condition.

Relationship with Key Moving Averages
The Dow Jones Industrial Average's closing price of 42,299.70 is below its 50-day EMA of 42,917.25, indicating a bearish trend in the short-to-medium term. The index, however, remains above its 200-day EMA of 42,019.13, suggesting long-term strength.
Moving Averages Trend (MACD)
The MACD indicator for the Dow Jones Industrial Average shows a value of -310.96, while the MACD Signal is -448.66. Since the MACD line is above the signal line, it may suggest a potential short-term bullish sentiment. However, both values are negative, indicating the overall trend could be bearish.

RSI Analysis
- Relative Strength Index (RSI) Analysis for Dow Jones Industrial Average (US): The RSI is at 46.57, which is below the neutral 50 mark, suggesting slightly bearish sentiment. It is not in the oversold or overbought zones, indicating a relatively balanced condition with a potential for either further decline or reversal.

Analysis for CAC 40 (France) - March 28, 2025

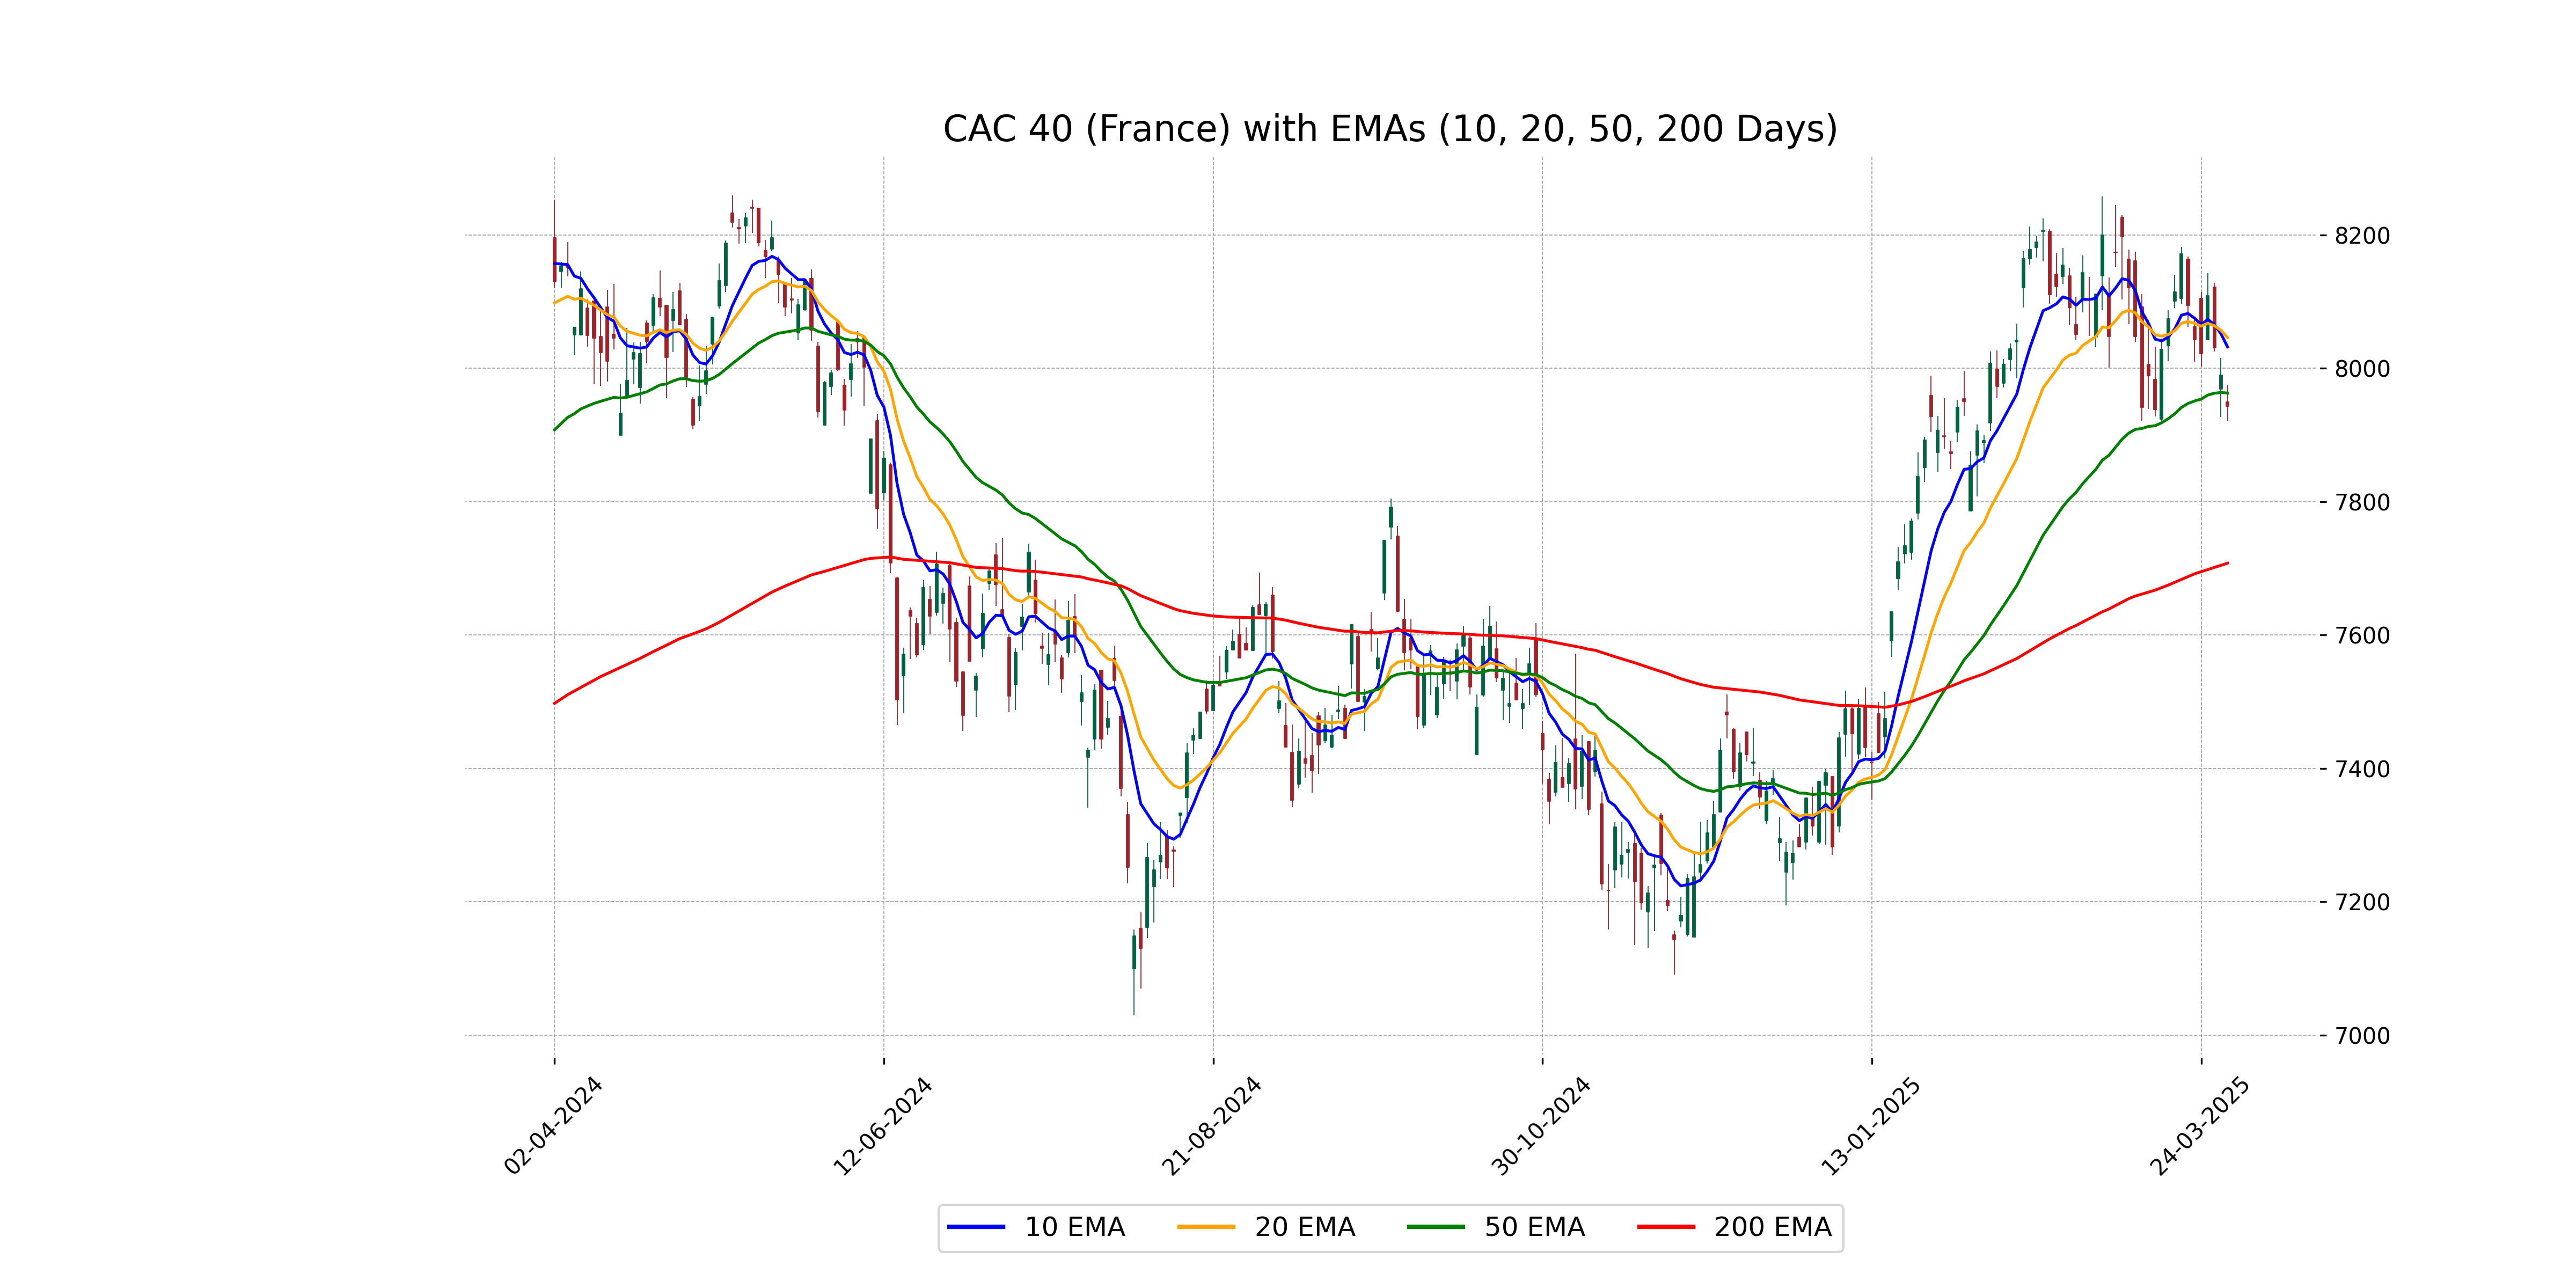
CAC 40 (France) Performance Summary: The CAC 40 index opened at 7949.23 and closed slightly lower at 7943.54, marking a decrease of 0.58%. The index faced high at 7975.55 and a low at 7921.71. Technical indicators such as an RSI of 43.83 suggest a bearish sentiment, while the MACD values further support this with a negative divergence from its signal line. The 50-day EMA is currently at 7962.99, indicating the index is slightly below its short-term trend.
Relationship with Key Moving Averages
The CAC 40 (France) closed below its 10 EMA and 20 EMA but slightly above its 50 EMA, indicating a short-term bearish trend compared to its recent average prices. Additionally, the index remains well above its 200 EMA, suggesting it is still in a long-term uptrend despite recent declines.
Moving Averages Trend (MACD)
The MACD for CAC 40 is negative at -1.8983 and below the MACD Signal line of 17.3496, indicating a bearish trend. This suggests potential continued weakness, as the momentum is currently in favor of the sellers.

RSI Analysis
The RSI for CAC 40 (France) is 43.83, which suggests that the index is neither overbought nor oversold. Typically, an RSI below 30 indicates oversold conditions, while above 70 indicates overbought conditions. Hence, currently, CAC 40 shows neutral momentum.

Analysis for FTSE 100 (UK) - March 28, 2025

The FTSE 100 opened at 8666.12 and closed slightly lower at 8664.46, marking a minor drop of 0.02% or 1.64 points. Despite the small decrease in the closing price, the Relative Strength Index (RSI) is neutral at 50.50, and the MACD indicator suggests a slight bearish sentiment as it is below the MACD signal line.

Relationship with Key Moving Averages
The FTSE 100 closed slightly below its 10 EMA and 20 EMA at 8664.46, indicating a minor downward momentum as it also fell below the previous close. However, it remains above its 50 EMA and 200 EMA, reflecting a potentially long-term bullish trend, despite the small daily decrease.
Moving Averages Trend (MACD)
The MACD for FTSE 100 (UK) is 4.08, below the MACD Signal of 5.62, suggesting a potential bearish signal. This indicates that the stock might experience downward momentum unless there is a crossover above the signal line soon.

RSI Analysis
Based on the provided stock data, the FTSE 100 has an RSI value of 50.50, indicating that the index is currently in a neutral zone and neither overbought nor oversold. This suggests a balance between buying and selling pressures at the moment.

Analysis for DAX (Germany) - March 28, 2025

DAX (Germany) opened at 22,558.84, with a high of 22,614.96 and a low of 22,438.05, closing at 22,538.67. The index experienced a decline, with a percentage change of -0.62% and a points change of -140.07. The RSI is at 47.49, while the MACD and MACD Signal are 135.51 and 226.14, respectively, suggesting a bearish momentum.

Relationship with Key Moving Averages
The DAX closed at 22538.67, positioning itself above its 50-EMA of 22250.69 and 200-EMA of 20267.63, but below both the 10-EMA of 22835.72 and the 20-EMA of 22789.43. This indicates a potential short-term bearish trend against its longer-term upward support.
Moving Averages Trend (MACD)
MACD Analysis for DAX (Germany): The MACD value is currently 135.51, which is lower than the MACD Signal line at 226.14. This suggests a potential bearish trend as the MACD line crossing below the signal line can indicate a sell signal.

RSI Analysis
The RSI for DAX (Germany) is 47.49, indicating that the index is currently in a neutral zone. It is neither overbought nor oversold, suggesting potential stability or lack of strong momentum in the market.

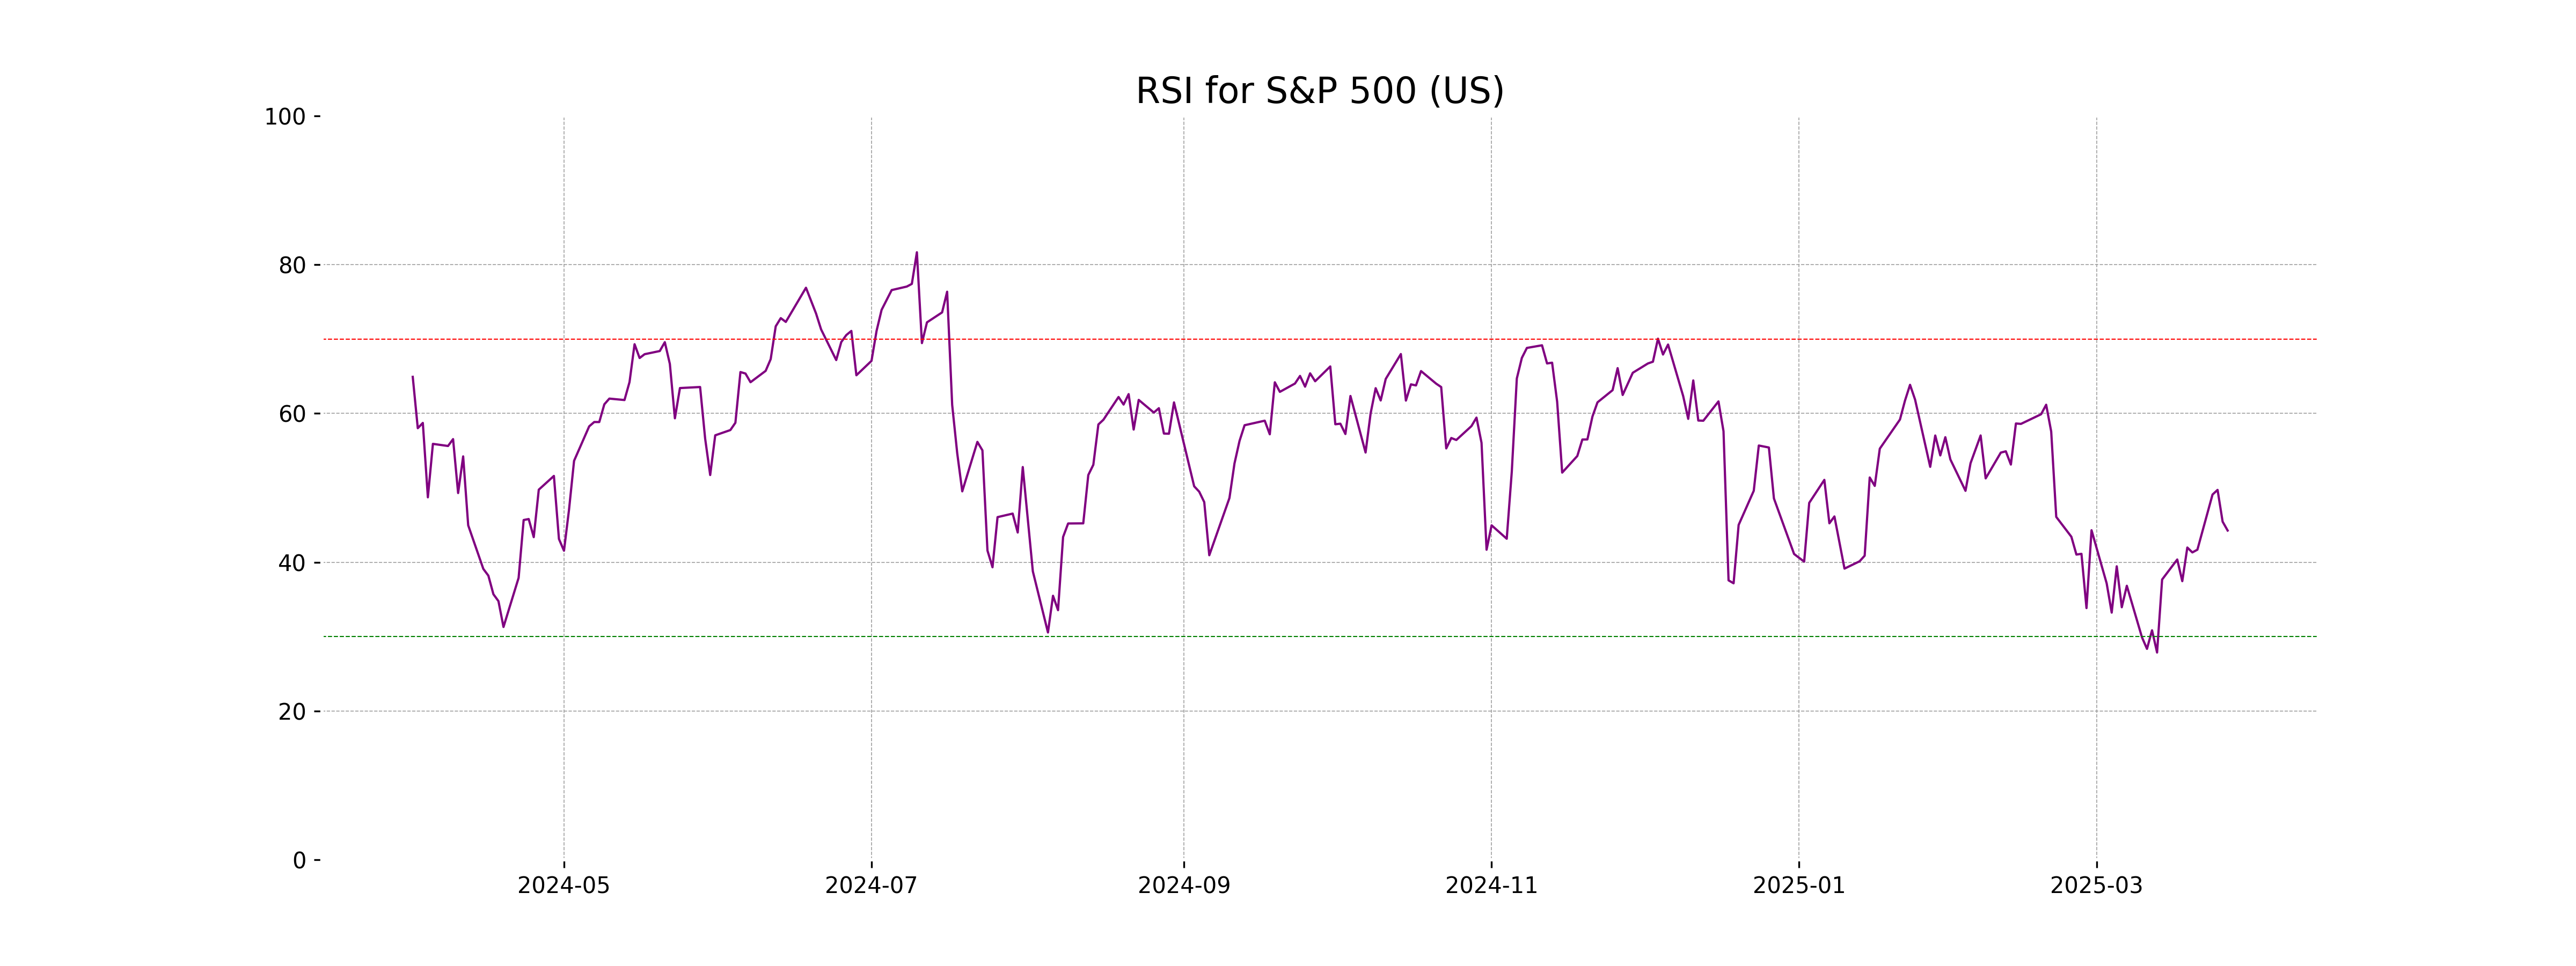
Analysis for S&P 500 (US) - March 28, 2025

S&P 500 (US) opened at 5695.64, reaching a high of 5732.28 and a low of 5670.94, closing at 5693.31. This reflects a decrease of 0.33% with a point change of -18.89. The 10 EMA is 5703.81, and the RSI indicates a value of 44.26, suggesting weaker market momentum.

Relationship with Key Moving Averages
The S&P 500 closed at 5693.31, which is below the 10 EMA of 5703.81, the 20 EMA of 5738.80, and the 50 EMA of 5835.12. It is, however, slightly above the 200 EMA of 5705.28. This suggests a short-term bearish trend as it is trading below the shorter-term moving averages.
Moving Averages Trend (MACD)
The MACD value of -58.22, which is above the signal line at -76.89, indicates a potential upward momentum for the S&P 500. However, both values being quite negative suggests that the index might still be in a bearish phase overall.

RSI Analysis
The S&P 500 currently shows an RSI of 44.26, which is below the neutral 50 level, indicating that the index is leaning towards the oversold side. This suggests potential bearish pressure, though it is not yet in oversold territory, as the RSI is above 30.
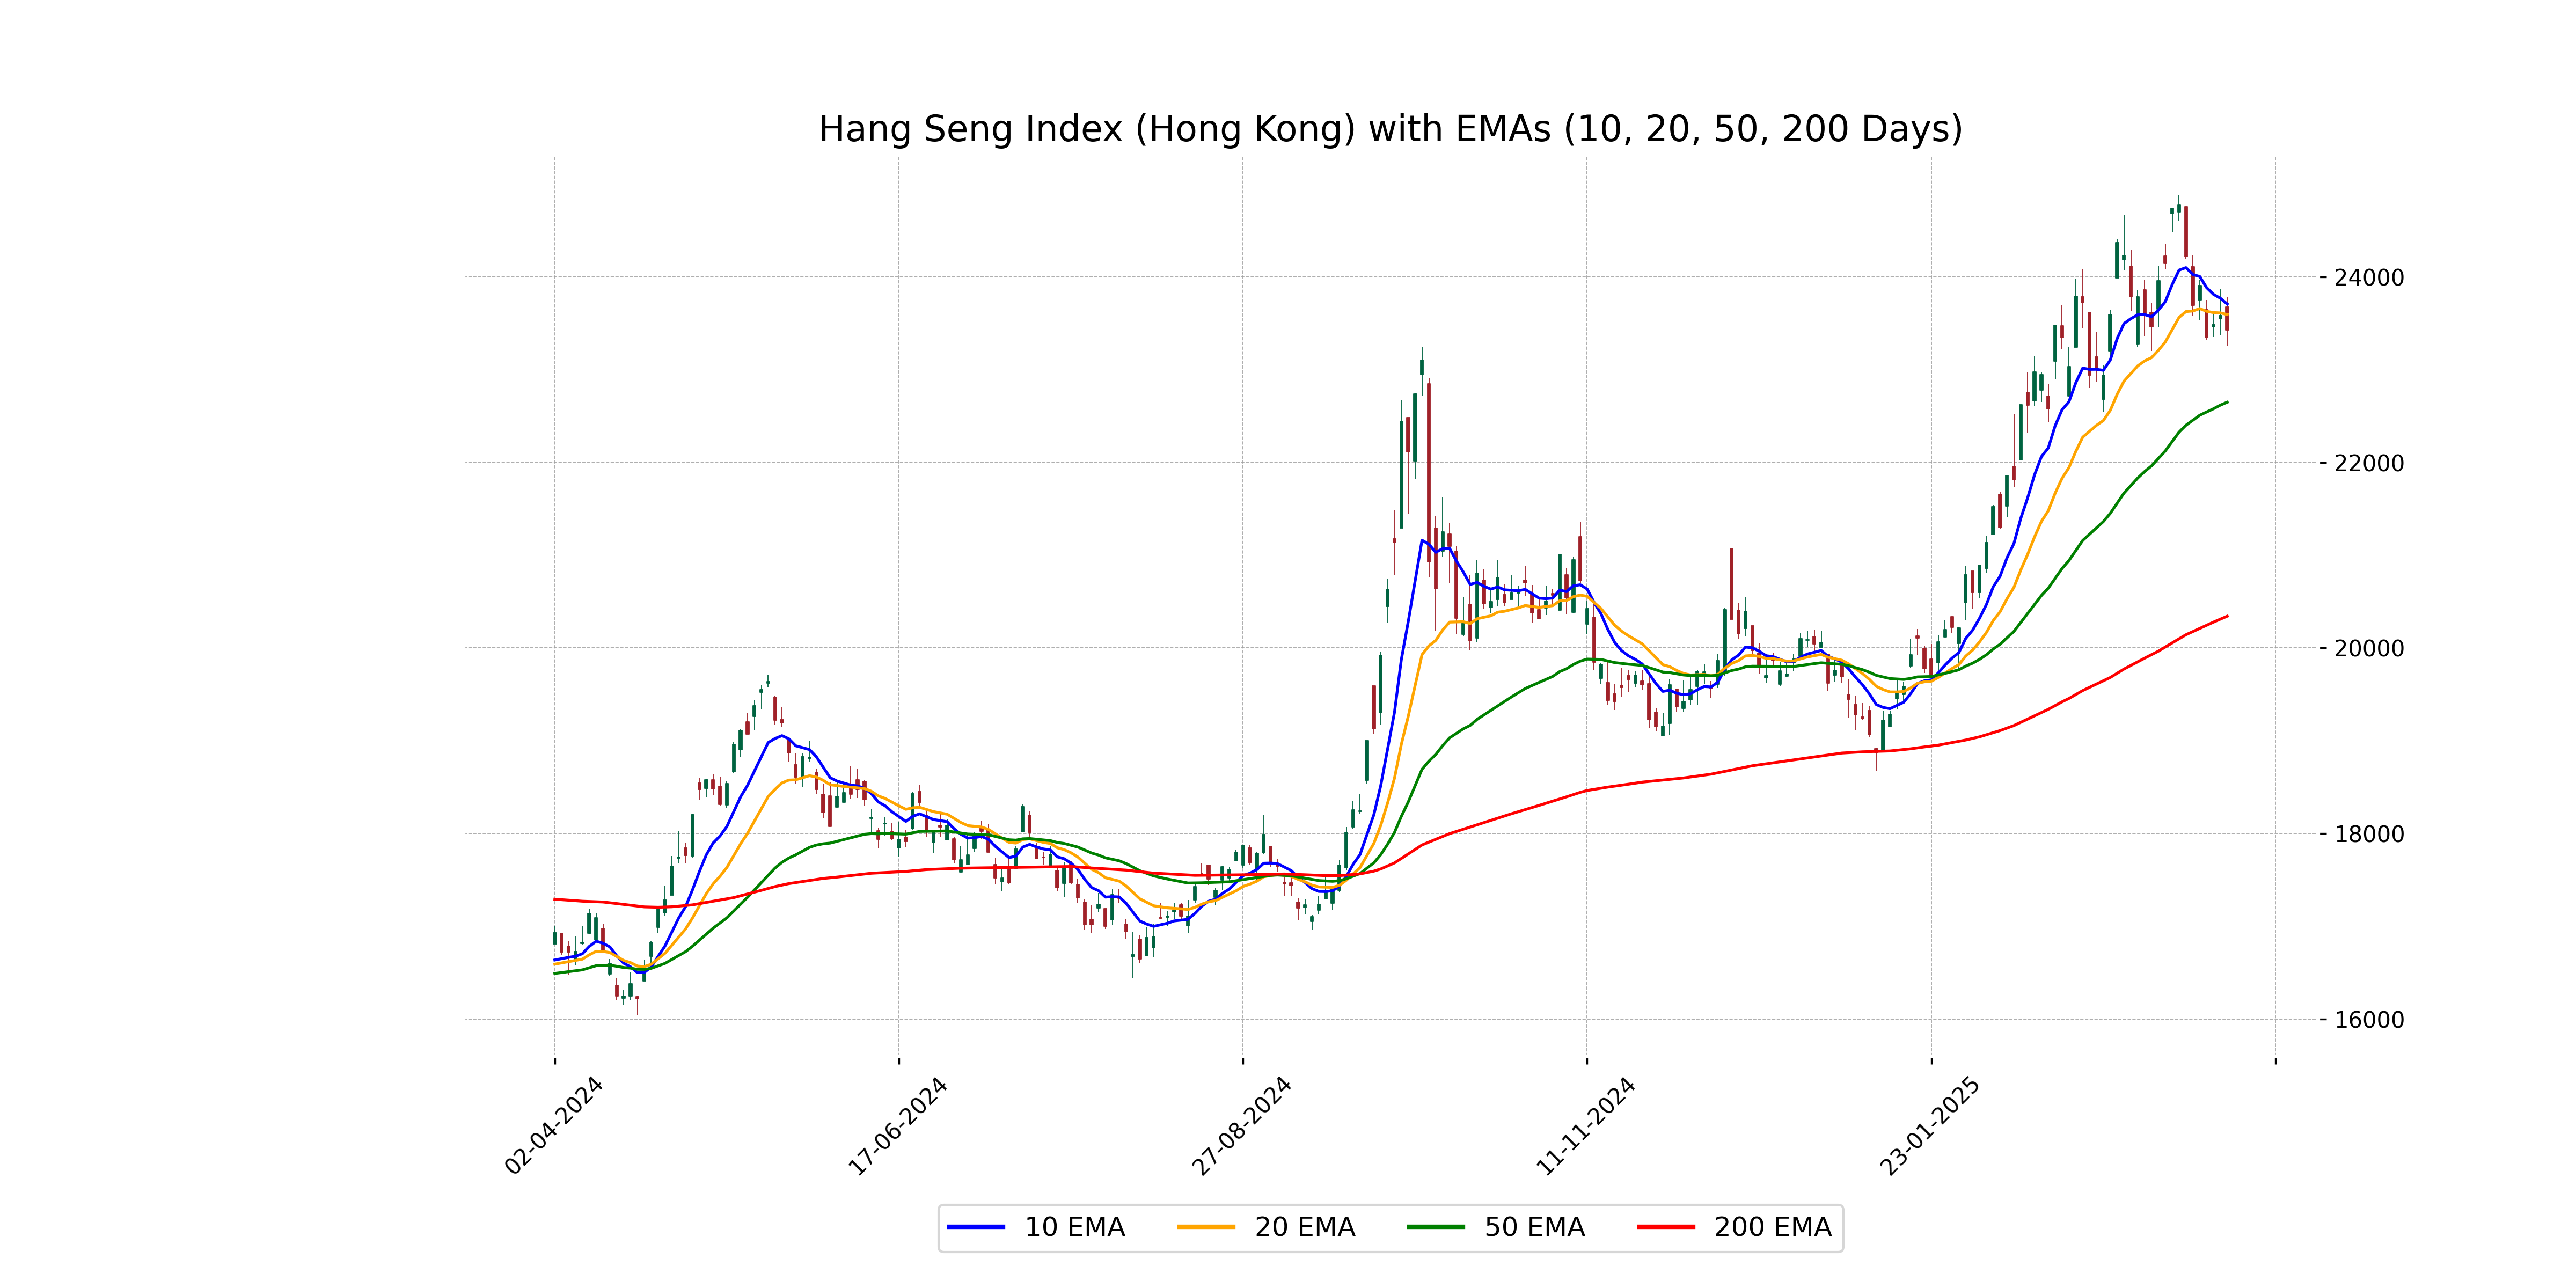
Analysis for Hang Seng Index (Hong Kong) - March 28, 2025

The Hang Seng Index (Hong Kong) opened at 23,672.82 and closed at 23,426.60, marking a decrease of 0.65% with a drop of 152.20 points from the previous close. The index showed a volatile trading session with a high of 23,775.30 and a low of 23,254.30, along with an RSI of 50.55 suggesting a neutral momentum.
Relationship with Key Moving Averages
The Hang Seng Index closed at 23,426.60, which is below its 10 EMA of 23,705.89 and the 20 EMA of 23,592.50, indicating short-term bearish momentum. However, the index remains above the 50 EMA of 22,648.36 and the 200 EMA of 20,342.83, suggesting a long-term bullish trend.
Moving Averages Trend (MACD)
The MACD for Hang Seng Index (Hong Kong) is 297.75, which is lower than the MACD Signal of 481.89, indicating that the market might be experiencing bearish momentum. This suggests investors should be cautious as a bearish crossover may signal further downward movement.

RSI Analysis
The current RSI for the Hang Seng Index (Hong Kong) is 50.55, indicating a neutral market condition. An RSI around 50 suggests that the index is neither overbought nor oversold, reflecting a balanced market sentiment at present.

Analysis for IBEX 35 (Spain) - March 28, 2025

The IBEX 35 index opened at 13,363.40 and closed slightly lower at 13,335.20, recording a decline of 0.65% from the previous close with a points change of -87.40. The index showed a trading volume of 32,397,459, with the Relative Strength Index (RSI) at 57.66, indicating moderate momentum. The index's 10-day EMA stands at 13,328.24, slightly above its closing price.

Relationship with Key Moving Averages
IBEX 35 (Spain) is trading slightly above its 10-day EMA but below its 50-day EMA, indicating a recent upward momentum yet still within a broader range that suggests caution. It's significantly above the 200-day EMA, suggesting a long-term uptrend.
Moving Averages Trend (MACD)
The MACD value of 148.65 is below the MACD Signal of 151.12, suggesting a potential short-term bearish trend for the IBEX 35 index. The RSI is 57.66, indicating a moderately positive momentum but not overbought.

RSI Analysis
The IBEX 35 (Spain) has an RSI of 57.66, indicating that the index is in the neutral zone, suggesting neither overbought nor oversold conditions. This value suggests a relatively balanced momentum but warrants watching for any significant changes.

Analysis for NASDAQ Composite (US) - March 28, 2025

NASDAQ Composite (US) showed a slight decline in its performance, closing at 17,804.03, down from the previous close of 17,899.02, resulting in a percentage change of -0.53% and a points change of -94.99. The Relative Strength Index (RSI) indicates a moderate position at 42.43, and the MACD suggests a bearish trend with a value of -303.62 compared to the signal line at -385.99.

Relationship with Key Moving Averages
The NASDAQ Composite is positioned below its key moving averages, indicating a bearish trend. It is below the 10 EMA (17910.182), 20 EMA (18096.683), 50 EMA (18613.593), and 200 EMA (18249.493), suggesting short-term to long-term downward momentum.
Moving Averages Trend (MACD)
NASDAQ Composite (US) is currently experiencing a bearish trend based on the MACD analysis. The MACD value of -303.62 is below the MACD Signal of -385.99, indicating potential further downward momentum in the near term.

RSI Analysis
NASDAQ Composite (US) has an RSI of 42.43, indicating that it is in the neutral range. An RSI below 50 suggests that the index may be experiencing some bearish pressure, but it is not yet in oversold territory.

Analysis for Nikkei 225 (Japan) - March 28, 2025

Nikkei 225 (Japan) Performance: On the current trading session, the Nikkei 225 opened at 37,357.52 and closed lower at 37,120.33, marking a decline of approximately 1.80%, or 679.64 points down from the previous close of 37,799.97. The index's current RSI is 40.93, indicating potential bearish momentum, while the MACD is trending below its signal line, further hinting at a possible downward trend.

Relationship with Key Moving Averages
The Nikkei 225 closed at 37120.33, which is below its 10-day EMA of 37565.79 and the 20-day EMA of 37663.82, indicating a potential bearish trend in the short to medium term. Additionally, it is significantly below both the 50-day EMA of 38122.16 and the 200-day EMA of 38156.89, suggesting overall weakness in the index.
Moving Averages Trend (MACD)
Nikkei 225 is showing a bearish signal according to the MACD analysis. The MACD line is currently above the Signal line, indicating ongoing downward momentum. This suggests a potential continuation of the recent downtrend.

RSI Analysis
RSI Analysis for Nikkei 225 (Japan): The RSI value is 40.93, which suggests that the index is closer to being oversold, as it is below the neutral level of 50. This could indicate a potential buying opportunity if the downward trend reverses. However, further analysis is required to confirm any potential reversal.

Analysis for Nifty Bank - March 28, 2025

The Nifty Bank index opened at 51,608.40, reaching a high of 51,839.10 and a low of 51,335.35, before closing at 51,564.85. This represents a slight decline of 0.0213% with an 11-point decrease compared to the previous close. The index's RSI indicates strong momentum at 69.80, and the MACD suggests a potential upward trend difference from the MACD signal.

Relationship with Key Moving Averages
The close price of Nifty Bank at 51,564.85 is above its 50-day EMA (49,743.46) and 200-day EMA (49,986.60), indicating a strong upward trend. However, it is slightly above the 10-day EMA (50,691.73) and 20-day EMA (50,013.69), which may suggest a short-term correction or consolidation phase.
Moving Averages Trend (MACD)
Nifty Bank's MACD line is at 663.67, which is above the MACD Signal line at 316.90, suggesting a bullish momentum. The positive MACD indicates that the short-term moving average is above the long-term average, potentially signaling an upward trend.

RSI Analysis
The RSI (Relative Strength Index) for Nifty Bank is at 69.8, indicating that it is nearing the overbought territory which typically is around 70. This suggests that the stock might be trading at a higher price relative to its recent performance, potentially signaling a slowdown or reversal in the price trend.

Analysis for Nifty 50 - March 28, 2025

The Nifty 50 index opened at 23,600.40 and closed at 23,519.35, experiencing a decrease of 72.60 points, equivalent to a -0.31% change from the previous close of 23,591.95. The RSI stands at 64.07, suggesting a moderately strong current trend, and the MACD is 190.96, indicating bullish momentum.

Relationship with Key Moving Averages
Nifty 50 is trading above its 50-day EMA (23115.95) and 200-day EMA (23410.85), indicating a bullish trend, but below its previous close. The index is also above its 10-day EMA (23299.32) and 20-day EMA (23083.91).
Moving Averages Trend (MACD)
MACD Analysis for Nifty 50: The Moving Average Convergence Divergence (MACD) value of 190.96 is significantly higher than the MACD Signal line at 60.93, indicating a bullish trend. This suggests potential upward momentum in the market for Nifty 50.

RSI Analysis
The RSI value for Nifty 50 is 64.07, suggesting that the market is approaching overbought territory but is not yet there. This indicates a moderately strong upward momentum, but investors should watch for any potential reversals if it trends higher.

Up Next
Global stock market indices: How the world markets performed today - 28 March 2025

Microsoft commits USD 17.5 billion investment in India: CEO Satya Nadella

CBI books Anil Ambani's son, Reliance Home Finance Ltd. in Rs 228 crore bank fraud case

RBI raises FY26 GDP growth projection to 7.3 pc

RBI trims policy interest rate by 25bps to 5.25pc, loans to get cheaper

Rupee slumps to all-time low of 90.25 against US dollar in intra-day trade

More videos

Reliance completes merger of Star Television Productions with Jiostar

India to lead emerging market growth with 7pc GDP rise in 2025: Moody’s

Nifty hits record high after 14 months; Sensex nears all-time peak

Reliance stops Russian oil use at its only-for-export refinery to comply with EU sanctions

ED attaches fresh assets worth over Rs 1,400 cr in case against Anil Ambani's Reliance Group

India signs one-year deal to import 2.2 million tonnes of LPG from US

India International Trade Fair begins at Pragati Maidan amid tight security

Stock markets decline in initial trade on foreign fund outflows, weak Asian peers

Amazon to lay off 30,000 office workers amid AI-driven cost cuts

US sanctions on Russian firms to hit Reliance; PSUs likely to keep buying Russian oil via traders